
Market
Bearish Signals Point to Further Losses

Ripple (XRP) price has been under significant pressure following a series of bearish technical signals and legal developments. After the SEC filed an appeal against Ripple, XRP experienced a sharp decline.
Despite this, the RSI has moved from deeply oversold levels. That indicates that the selling pressure may be easing, though the overall trend remains bearish.
XRP RSI Is Currently Neutral
XRP’s RSI is currently sitting at 41.60, a notable jump from its deeply oversold level of 19.79 on October 3. This increase signals that the intense selling pressure seen earlier in the month has eased, and some buyers have stepped in.
However, the upward shift in RSI doesn’t necessarily point at reversal of the downtrend. It suggests that the asset has moved out of extremely oversold territory and is experiencing a potential relief rally.
The Relative Strength Index (RSI) is a momentum oscillator used in technical analysis to measure the speed and magnitude of recent price changes. It ranges from 0 to 100, with key thresholds at 30 and 70. When the RSI falls below 30, it indicates that the asset is oversold and may be due for a rebound. On the other hand, an RSI above 70 means the asset is overbought.
Read More: Ripple (XRP) Price Prediction 2024/2025/2030
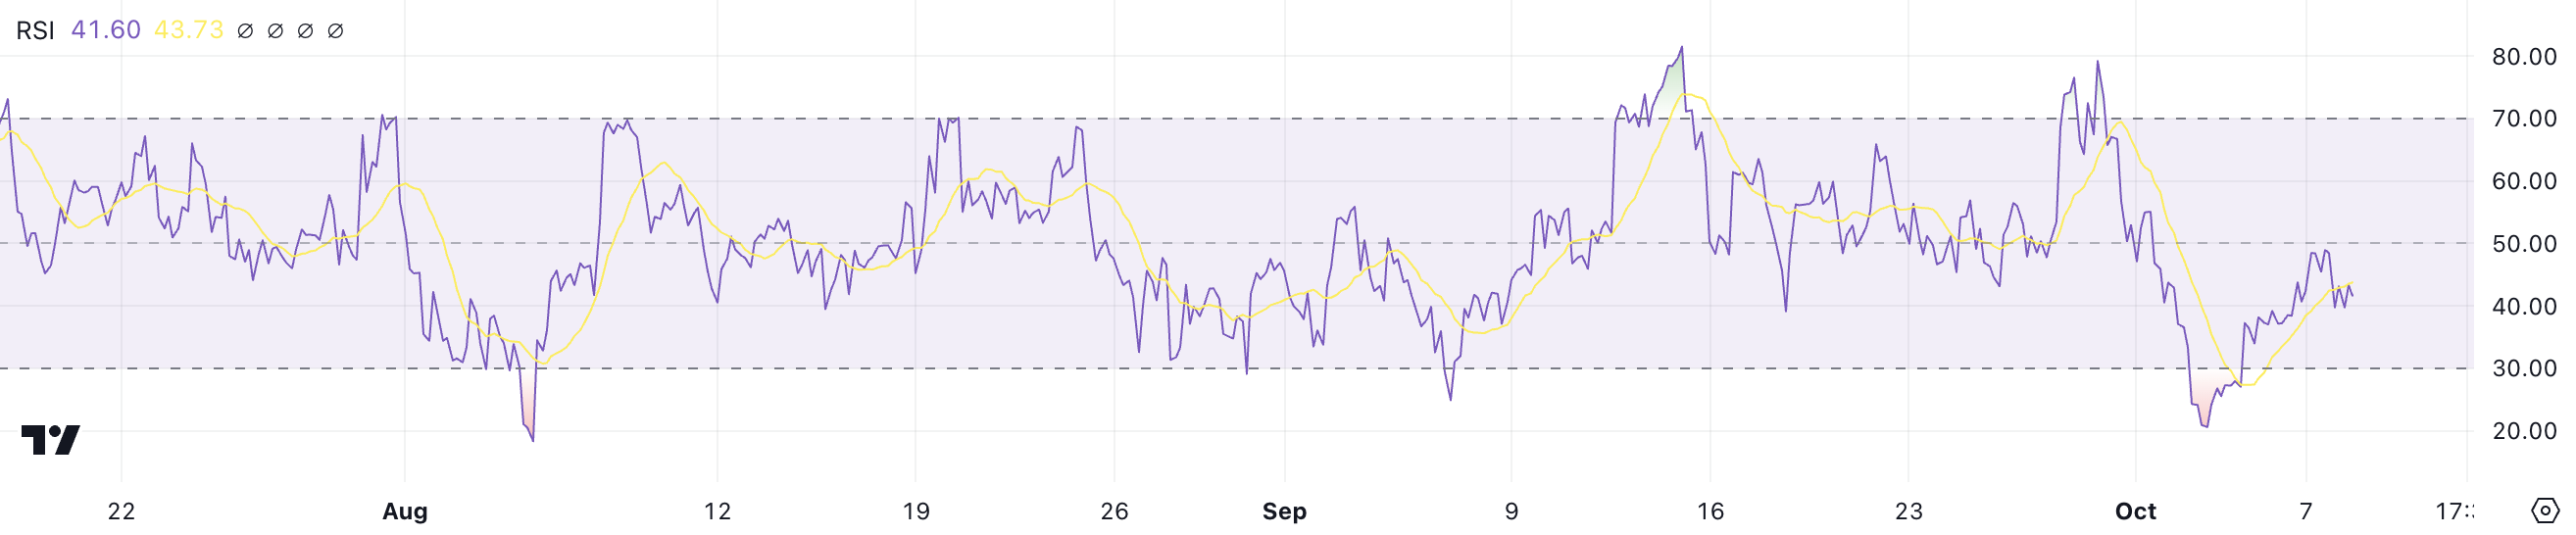
An RSI of 41.60 means that XRP, while still in a downtrend, is seeing some stabilization as the market has cooled off from extreme selling. This level indicates that the bearish momentum is weakening.
However, it seems the buyers haven’t gained enough strength to reverse the trend fully. In the context of XRP’s ongoing downtrend, an RSI around 40 suggests that while the asset isn’t in oversold territory anymore, it is still under selling pressure.
Traders typically view RSI levels in this range as neutral or slightly bearish, meaning there may still be room for downward movement unless significant buying pressure emerges to push the RSI toward 50 or higher. For XRP price to break out of its downtrend, stronger bullish signals and an RSI above 50 would be needed to confirm a potential trend reversal.
Ripple’s DMI Shows Downtrend is Strong
The XRP DMI chart shows that the current market sentiment is dominated by bearish momentum. The blue line, which represents the Positive Directional Index (+DI), is sitting at 11.16. That indicates that the buying pressure is quite weak.
In contrast, the red line, or Negative Directional Index (-DI), is higher at 24.55, suggesting that selling pressure is stronger. This imbalance between buyers and sellers reflects a clear downtrend in XRP’s price movement.
The Directional Movement Index (DMI) is a technical indicator used to assess the strength of a trend. It consists of the +DI and -DI, which measure the strength of upward and downward movements, respectively, and the Average Directional Index (ADX), which measures the overall trend strength regardless of direction.
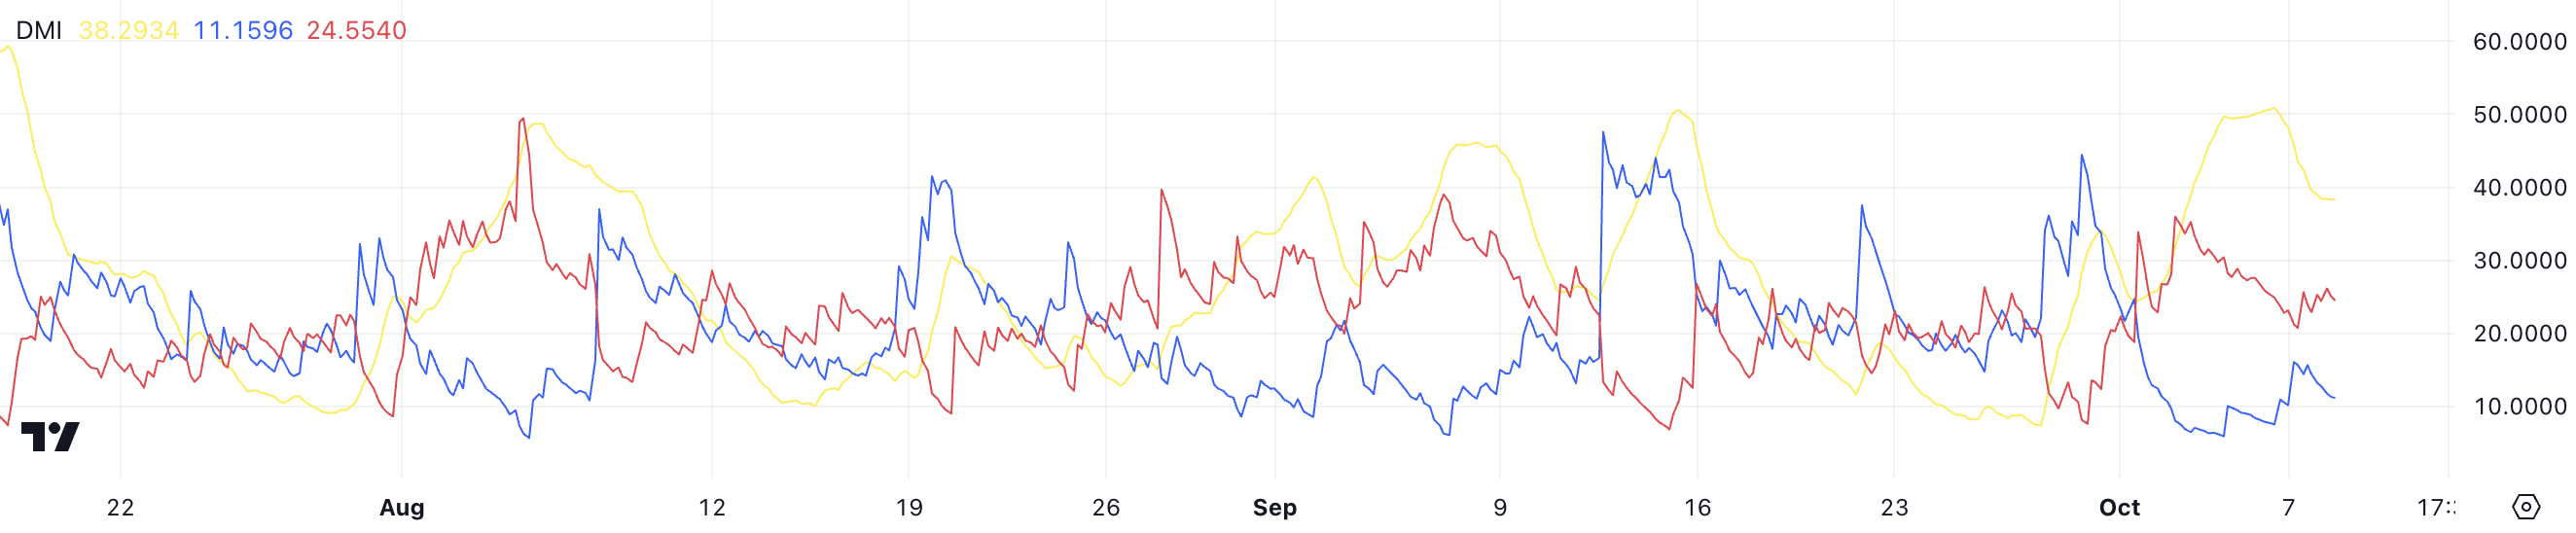
In this case, the ADX, represented by the yellow line, is currently at 38.29. That signals that the bearish trend is relatively strong. While the ADX doesn’t specify whether the trend is bullish or bearish, when paired with a higher -DI, it confirms that XRP is in a fairly strong downtrend.
For a potential trend reversal, we would need to see the +DI crossing above the -DI and the ADX continuing to rise, signaling a shift in momentum.
XRP Price Prediction: A 17% Decline Soon?
On October 2, XRP’s EMA lines formed a death cross, a significant bearish signal that occurs when a short-term EMA crosses below a long-term EMA. This event often signals a shift in market sentiment, indicating that bearish momentum is taking control.
Since the death cross, XRP’s price has dropped by 13%. That reinforces the downtrend that has been dominating the market after the SEC filed an appeal against Ripple.
EMA, or Exponential Moving Average, is a key technical indicator used to smooth price data while giving more weight to recent prices. Compared to the simple moving average, it is more responsive to short-term movements. Traders often rely on the interplay between short-term and long-term EMA lines to gauge market trends and potential reversals.
Read More: Everything You Need To Know About Ripple vs SEC
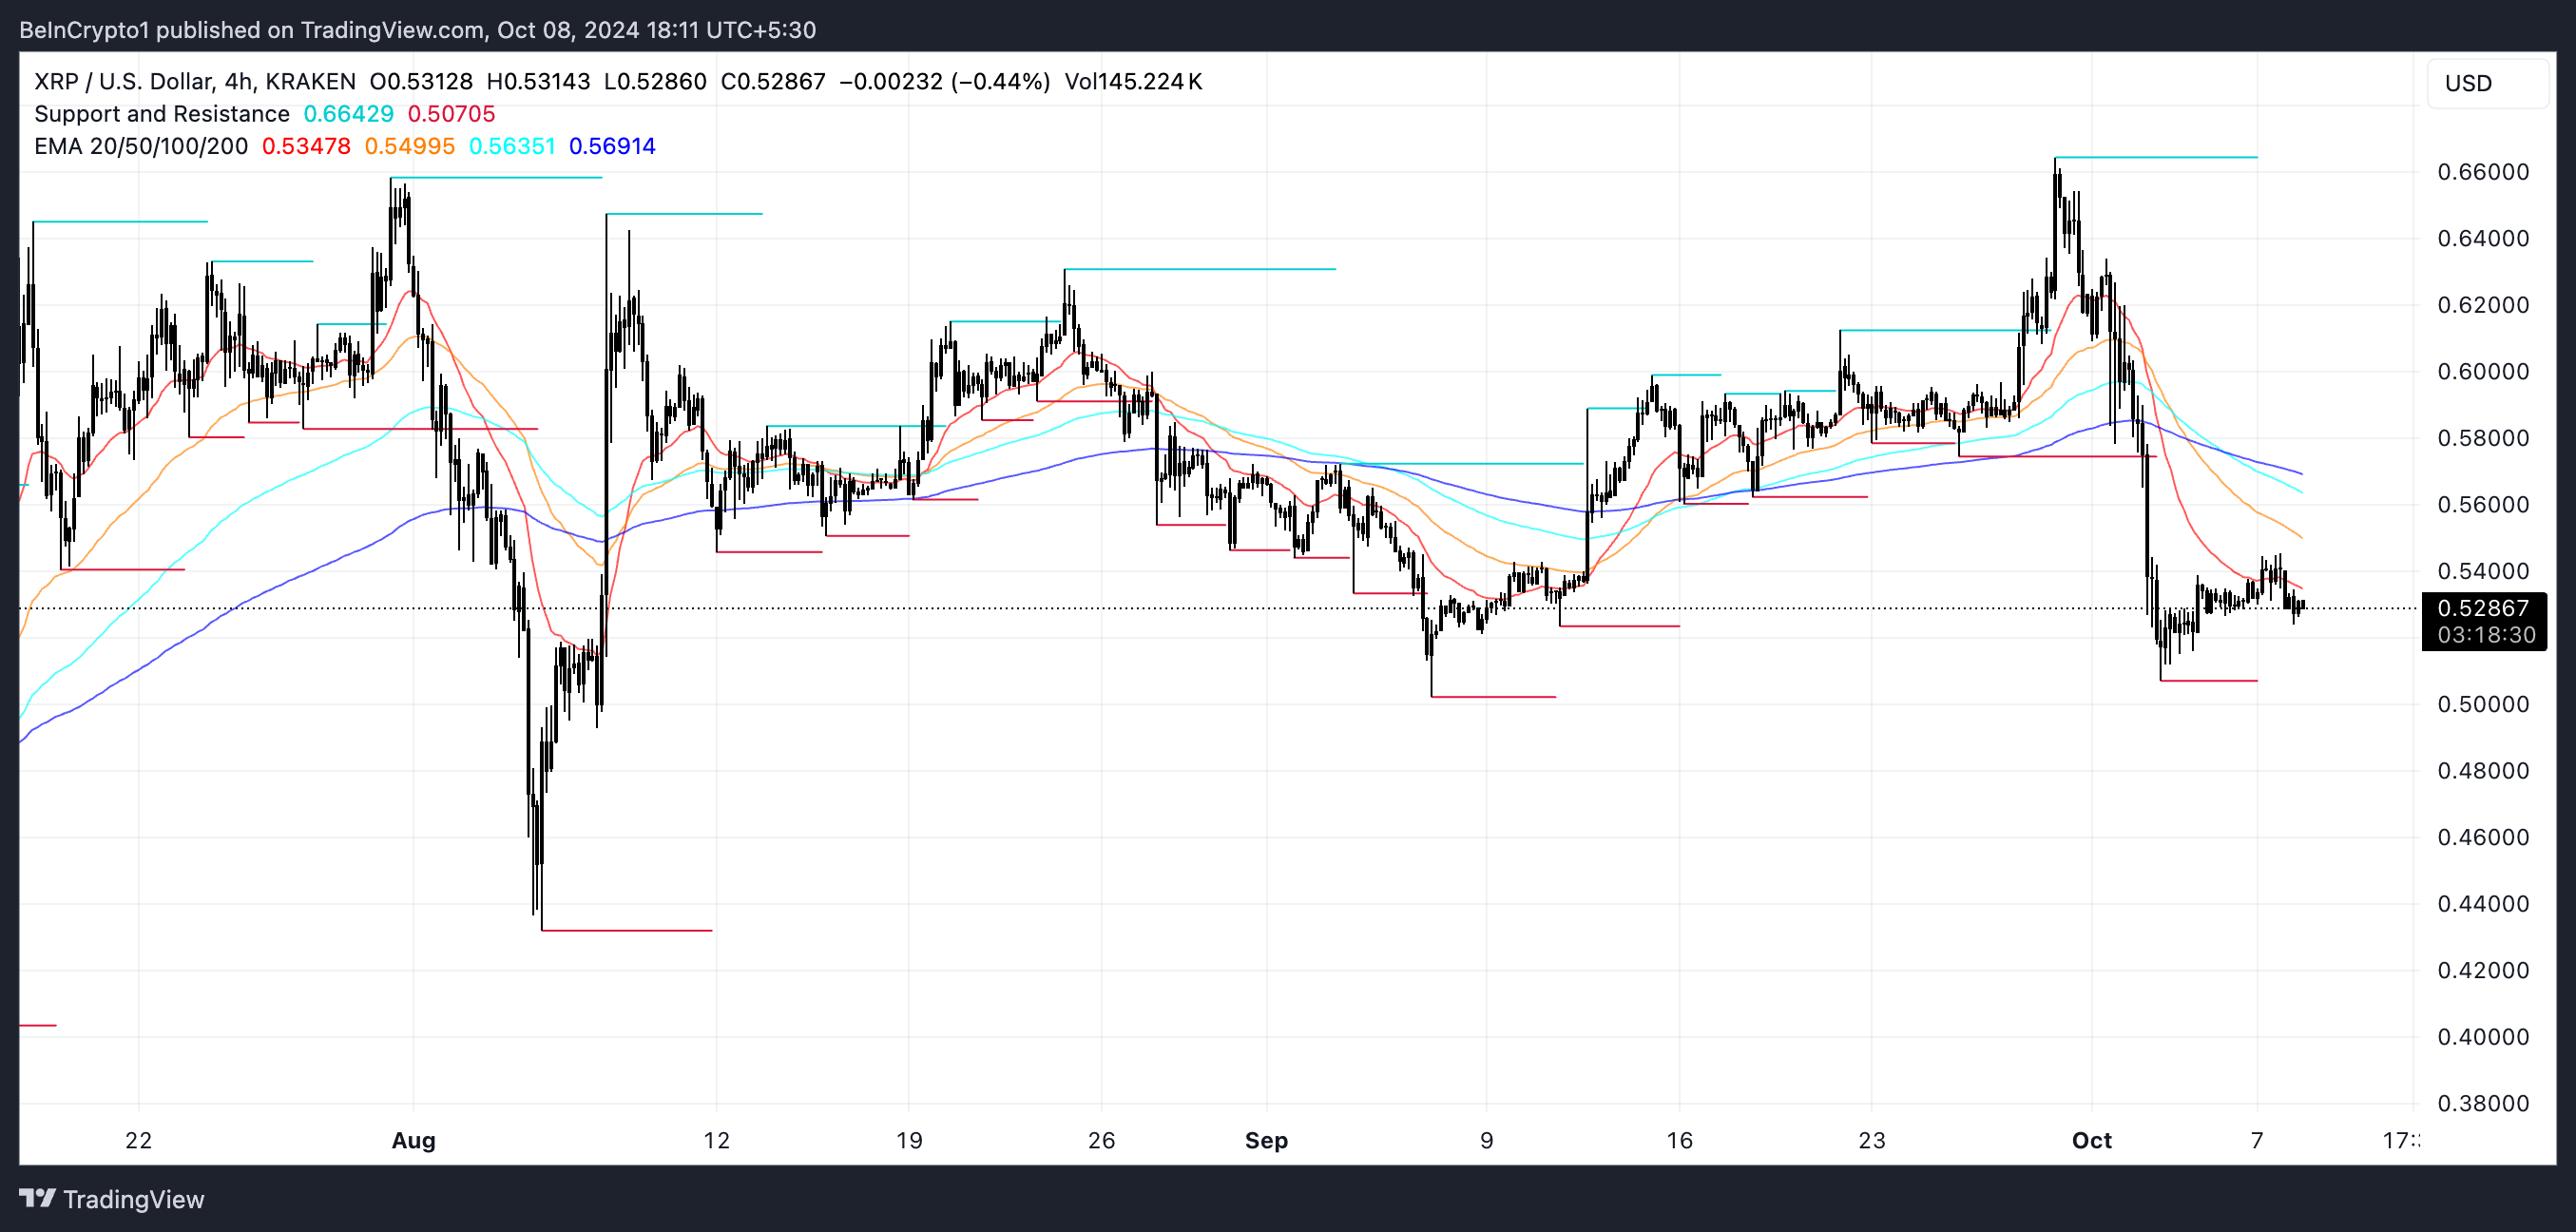
When a death cross forms, it’s generally viewed as a warning that a prolonged downtrend could be on the horizon. If XRP continues to follow this negative trend, the price could drop further. It could potentially reach $0.43, which would represent a 17% decline from the current levels.
However, if XRP price manages to reverse the bearish momentum, it could retest the resistance at $0.61. If this resistance is broken, it may create room for a further rally, pushing XRP price toward the next resistance at $0.66. That would represent a potential 26% upside from the current price level.
Disclaimer
In line with the Trust Project guidelines, this price analysis article is for informational purposes only and should not be considered financial or investment advice. BeInCrypto is committed to accurate, unbiased reporting, but market conditions are subject to change without notice. Always conduct your own research and consult with a professional before making any financial decisions. Please note that our Terms and Conditions, Privacy Policy, and Disclaimers have been updated.


Reason to trust
![]()
Strict editorial policy that focuses on accuracy, relevance, and impartiality
Created by industry experts and meticulously reviewed
The highest standards in reporting and publishing
Strict editorial policy that focuses on accuracy, relevance, and impartiality
Morbi pretium leo et nisl aliquam mollis. Quisque arcu lorem, ultricies quis pellentesque nec, ullamcorper eu odio.
Ethereum price started a increase from the $1,550 zone. ETH is now rising and might attempt to recover above the $1,650 resistance.
- Ethereum started a fresh increase above the $1,580 and $1,600 levels.
- The price is trading above $1,600 and the 100-hourly Simple Moving Average.
- There was a break above a connecting bearish trend line with resistance at $1,590 on the hourly chart of ETH/USD (data feed via Kraken).
- The pair could start a fresh increase if it clears the $1,650 resistance zone.
Ethereum Price Eyes Upside Break
Ethereum price remained stable above the $1,500 level and started a fresh increase, like Bitcoin. ETH traded above the $1,550 and $1,600 levels to enter a short-term positive zone.
There was a break above a connecting bearish trend line with resistance at $1,590 on the hourly chart of ETH/USD. The pair even cleared the $1,620 resistance. A high was formed at $1,644 and the price is stable above the 23.6% Fib retracement level of the upward move from the $1,566 swing low to the $1,644 high.
Ethereum price is now trading above $1,600 and the 100-hourly Simple Moving Average. On the upside, the price seems to be facing hurdles near the $1,640 level. The next key resistance is near the $1,650 level. The first major resistance is near the $1,680 level.

A clear move above the $1,680 resistance might send the price toward the $1,720 resistance. An upside break above the $1,720 resistance might call for more gains in the coming sessions. In the stated case, Ether could rise toward the $1,800 resistance zone or even $1,840 in the near term.
Downside Correction In ETH?
If Ethereum fails to clear the $1,650 resistance, it could start a downside correction. Initial support on the downside is near the $1,620 level. The first major support sits near the $1,605 zone and the 50% Fib retracement level of the upward move from the $1,566 swing low to the $1,644 high.
A clear move below the $1,605 support might push the price toward the $1,580 support. Any more losses might send the price toward the $1,550 support level in the near term. The next key support sits at $1,500.
Technical Indicators
Hourly MACD – The MACD for ETH/USD is gaining momentum in the bullish zone.
Hourly RSI – The RSI for ETH/USD is now above the 50 zone.
Major Support Level – $1,600
Major Resistance Level – $1,650
Barry Silbert, CEO of Digital Currency Group, has stated that Bittensor (TAO) has the potential to outperform Bitcoin (BTC) as a global store of value.
His comments come amid notable growth in the Bittensor network, with its subnet ecosystem market capitalization and the TAO token’s price on the rise.
Will Bittensor’s Decentralized AI Model Outperform Bitcoin’s Legacy?
In a recent interview with Raoul Pal, Silbert highlighted the growing influence of artificial intelligence (AI) in the crypto sector. According to him, Bittensor is at the forefront of this revolution, representing the “next big era for crypto.”
“You had the Bitcoin and the Ethereum and the NFTs, and you had the layer 2s and DeFi. I think this is the next big investment theme for crypto,” Silbert stated.
He went on to explain that Bittensor shares the same pioneering spirit as early Bitcoin. Still, its purpose extends beyond financial sovereignty.
“The boldest prediction that I could make for Bittensor is it could be a better version of Bitcoin as a global store of value,” he claimed.
He argued that instead of the $10 to $12 billion spent annually to secure the Bitcoin network, that same amount could be redirected toward incentivizing a global network of individuals working to solve major world problems. He envisions this money fostering innovation on a massive scale, with the potential to grow into a multi-billion-dollar ecosystem.
While acknowledging the value of securing the Bitcoin network, Silbert emphasized that Bittensor’s potential lies in its ability to harness this vast financial backing to address real-world challenges.
He noted that Bittensor operates on a similar economic model to Bitcoin, with halving mechanisms and decentralization, positioning it as a powerful contender in the quest for a more impactful and value-driven global network.
Silbert also noted that while plenty of decentralized AI projects have emerged, Bittensor has set itself apart. He referred to it as having reached “escape velocity.” This term is used to convey a project’s rapid growth and increasing market influence.
“99.9% of crypto tokens that are out there have no reason to exist and are worthless,” he added.
Market data reflects the growing enthusiasm for Bittensor. Notably, amid the ongoing volatility, TAO has fared well in comparison to the broader market, rising 32.1% in the last week. At press time, the altcoin was trading at $328, up 7.2% over the past day.

Additionally, TAO is currently the top trending cryptocurrency on CoinGecko, underlining its rising popularity among investors. Google Trends data further proves the growing interest in Bittensor. The search volume peaked at 100 at the time of writing.
Meanwhile, the Bittensor ecosystem is also seeing notable progress. The latest data indicated that the market capitalization of Bittensor’s subnet tokens more than doubled in April 2025.

It increased by 166%, rising from $181 million at the beginning of April to $481 million at press time. As reported by BeInCrypto, this growth follows a tripling of active subnets over the past year.
Disclaimer
In adherence to the Trust Project guidelines, BeInCrypto is committed to unbiased, transparent reporting. This news article aims to provide accurate, timely information. However, readers are advised to verify facts independently and consult with a professional before making any decisions based on this content. Please note that our Terms and Conditions, Privacy Policy, and Disclaimers have been updated.

Aayush Jindal, a luminary in the world of financial markets, whose expertise spans over 15 illustrious years in the realms of Forex and cryptocurrency trading. Renowned for his unparalleled proficiency in providing technical analysis, Aayush is a trusted advisor and senior market expert to investors worldwide, guiding them through the intricate landscapes of modern finance with his keen insights and astute chart analysis.
From a young age, Aayush exhibited a natural aptitude for deciphering complex systems and unraveling patterns. Fueled by an insatiable curiosity for understanding market dynamics, he embarked on a journey that would lead him to become one of the foremost authorities in the fields of Forex and crypto trading. With a meticulous eye for detail and an unwavering commitment to excellence, Aayush honed his craft over the years, mastering the art of technical analysis and chart interpretation.
As a software engineer, Aayush harnesses the power of technology to optimize trading strategies and develop innovative solutions for navigating the volatile waters of financial markets. His background in software engineering has equipped him with a unique skill set, enabling him to leverage cutting-edge tools and algorithms to gain a competitive edge in an ever-evolving landscape.
In addition to his roles in finance and technology, Aayush serves as the director of a prestigious IT company, where he spearheads initiatives aimed at driving digital innovation and transformation. Under his visionary leadership, the company has flourished, cementing its position as a leader in the tech industry and paving the way for groundbreaking advancements in software development and IT solutions.
Despite his demanding professional commitments, Aayush is a firm believer in the importance of work-life balance. An avid traveler and adventurer, he finds solace in exploring new destinations, immersing himself in different cultures, and forging lasting memories along the way. Whether he’s trekking through the Himalayas, diving in the azure waters of the Maldives, or experiencing the vibrant energy of bustling metropolises, Aayush embraces every opportunity to broaden his horizons and create unforgettable experiences.
Aayush’s journey to success is marked by a relentless pursuit of excellence and a steadfast commitment to continuous learning and growth. His academic achievements are a testament to his dedication and passion for excellence, having completed his software engineering with honors and excelling in every department.
At his core, Aayush is driven by a profound passion for analyzing markets and uncovering profitable opportunities amidst volatility. Whether he’s poring over price charts, identifying key support and resistance levels, or providing insightful analysis to his clients and followers, Aayush’s unwavering dedication to his craft sets him apart as a true industry leader and a beacon of inspiration to aspiring traders around the globe.
In a world where uncertainty reigns supreme, Aayush Jindal stands as a guiding light, illuminating the path to financial success with his unparalleled expertise, unwavering integrity, and boundless enthusiasm for the markets.

Ethereum Price Clings to Support—Upside Break Could Trigger Rally

Expert Reveals Why BlackRock Hasn’t Pushed for an XRP ETF
Will Bittensor Surpass Bitcoin as a Store of Value? Expert Predicts

Solana, Bitcoin in Texas, and Initia

XRP Bulls Defend $2.00—Is a Fresh Price Surge Loading?

Vitalik Buterin Proposes to Replace EVM with RISC-V

2.52 Million Altcoins Are Ruining Crypto’s Future

Animoca Brands Valuation Tanks 75% In Two Years, Here’s Why

Crypto exchange BingX hacked for $43 million

Are The Big Players Losing Interest?

Hong Kong’s Securities Association Tips Authorities On Crypto Self-Regulation

Coinbase cbBTC Set to go Live on Solana
2.52 Million Altcoins Are Ruining Crypto’s Future
Animoca Brands Valuation Tanks 75% In Two Years, Here’s Why
Crypto exchange BingX hacked for $43 million
Are The Big Players Losing Interest?
Hong Kong’s Securities Association Tips Authorities On Crypto Self-Regulation
Coinbase cbBTC Set to go Live on Solana
-
 Market18 hours ago
1 Year After Bitcoin Halving: What’s Different This Time?
-

 Market22 hours ago
MELANIA Crashes to All-Time Low Amid Insiders Continued Sales
-

 Market19 hours ago
VOXEL Climbs 200% After Suspected Bitget Bot Glitch
-

 Market24 hours ago
Today’s $1K XRP Bag May Become Tomorrow’s Jackpot, Crypto Founder Says
-

 Market17 hours ago
Tokens Big Players Are Buying
-

 Market23 hours ago
Charles Schwab Plans Spot Crypto Trading Rollout in 2026
-

 Altcoin21 hours ago
XRP Leads Crypto Shopping List For Latin America Ahead Of ETH, SOL—Report
-

 Market20 hours ago
How Token Launch Frenzy Is Delaying 2025 Altcoin Season