
Market
FTM Price Explodes 68%, Yet $1 Remains a Distant Target

Fantom (FTM) price has seen a remarkable rally in the last 30 days, surging 68% and sparking speculation of the token’s return to $1. However, despite this impressive performance, on-chain data suggest that the run toward this milestone is far from guaranteed.
FTM’s price last hit $1 six months ago. In this analysis, BeInCrypto reveals the challenges ahead and what investors should watch for.
Holders, Bitcoin Are Obstructing Fantom’s Move
On September 22, Fantom’s price hit $0.71 after the formation of an inverse head and shoulders pattern helped validate the uptrend. However, as of this writing, the value is $0.69, indicating that the FTM’s predicted run to $1 has been pegged back.
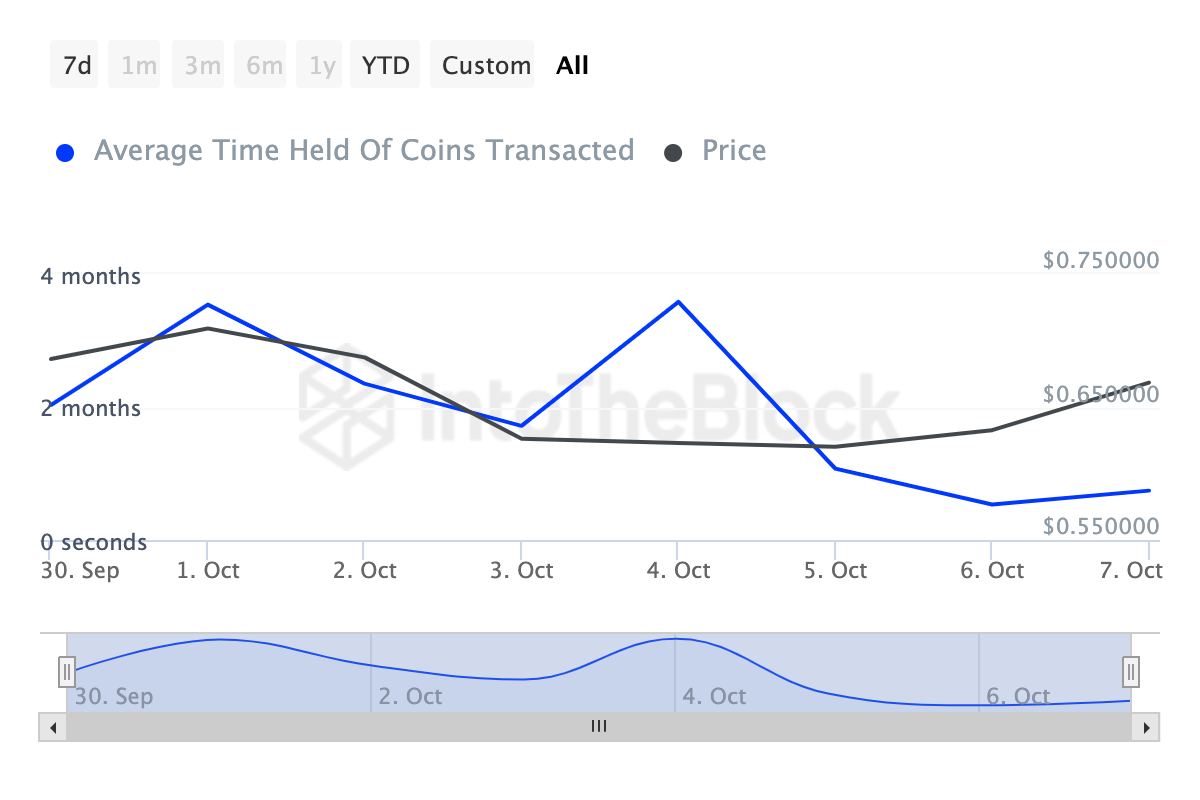
According to data from IntoTheBlock, FTM holders are largely responsible for this decline. Notably, Coins Holding Time, which measures the amount of time a cryptocurrency has been held without being sold, climbed up until October 4.
This development suggests a strong conviction in the token’s short-term potential to move higher. But over the last four days, Fantom’s Coins Holding Time has declined, suggesting that holders have booked profits off the recent hike. If sustained, this selling pressure could hinder FTM’s price from climbing higher.
Read more: How to Add Fantom to MetaMask: A Step-by-Step Guide
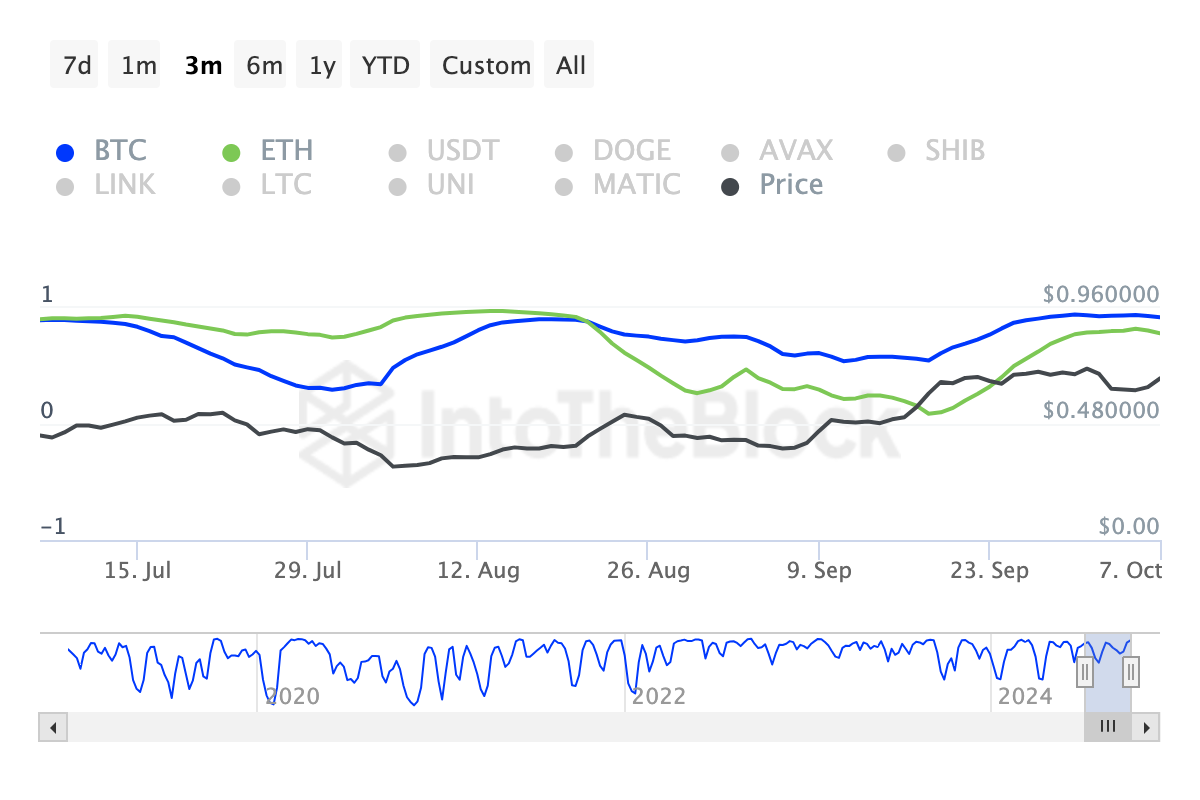
Another factor that could hinder the cryptocurrency’s progress is its correlation with Bitcoin (BTC). Based on IntoTheBlock’s data, the 30-day correlation matrix between BTC and FTM is 0.92. This matrix or coefficient ranges from -1 to +1, where the former indicates little to no correlation while the latter signifies strong directional movement.
The current coefficient reading indicated that FTM moves in almost the same direction as Bitcoin. But recently, Bitcoin’s price, which hit $64,000 yesterday, has decreased to $62,383. As such, FTM’s price will likely follow a similar direction due to the bond the cryptocurrencies share.
FTM Price Prediction: Key Obstacles Threaten $1 Target
On the daily chart, FTM’s price is getting close to the supply zone at $0.73. Historically, whenever the altcoin reaches this point, it experiences a pullback. For instance, on May 10, the price hit $0.73. But shortly after, it decline to $0.64.
A similar occurrence happened on June 8, when FTM got rejected as soon as it hit this point. Should the same pattern play out in this instance, the token’s price could decline to $0.60. Furthermore, a highly bearish scenario could see FTM’s price plunge to $0.52.
Read more: 9 Crypto Wallet Security Tips To Safeguard Your Assets
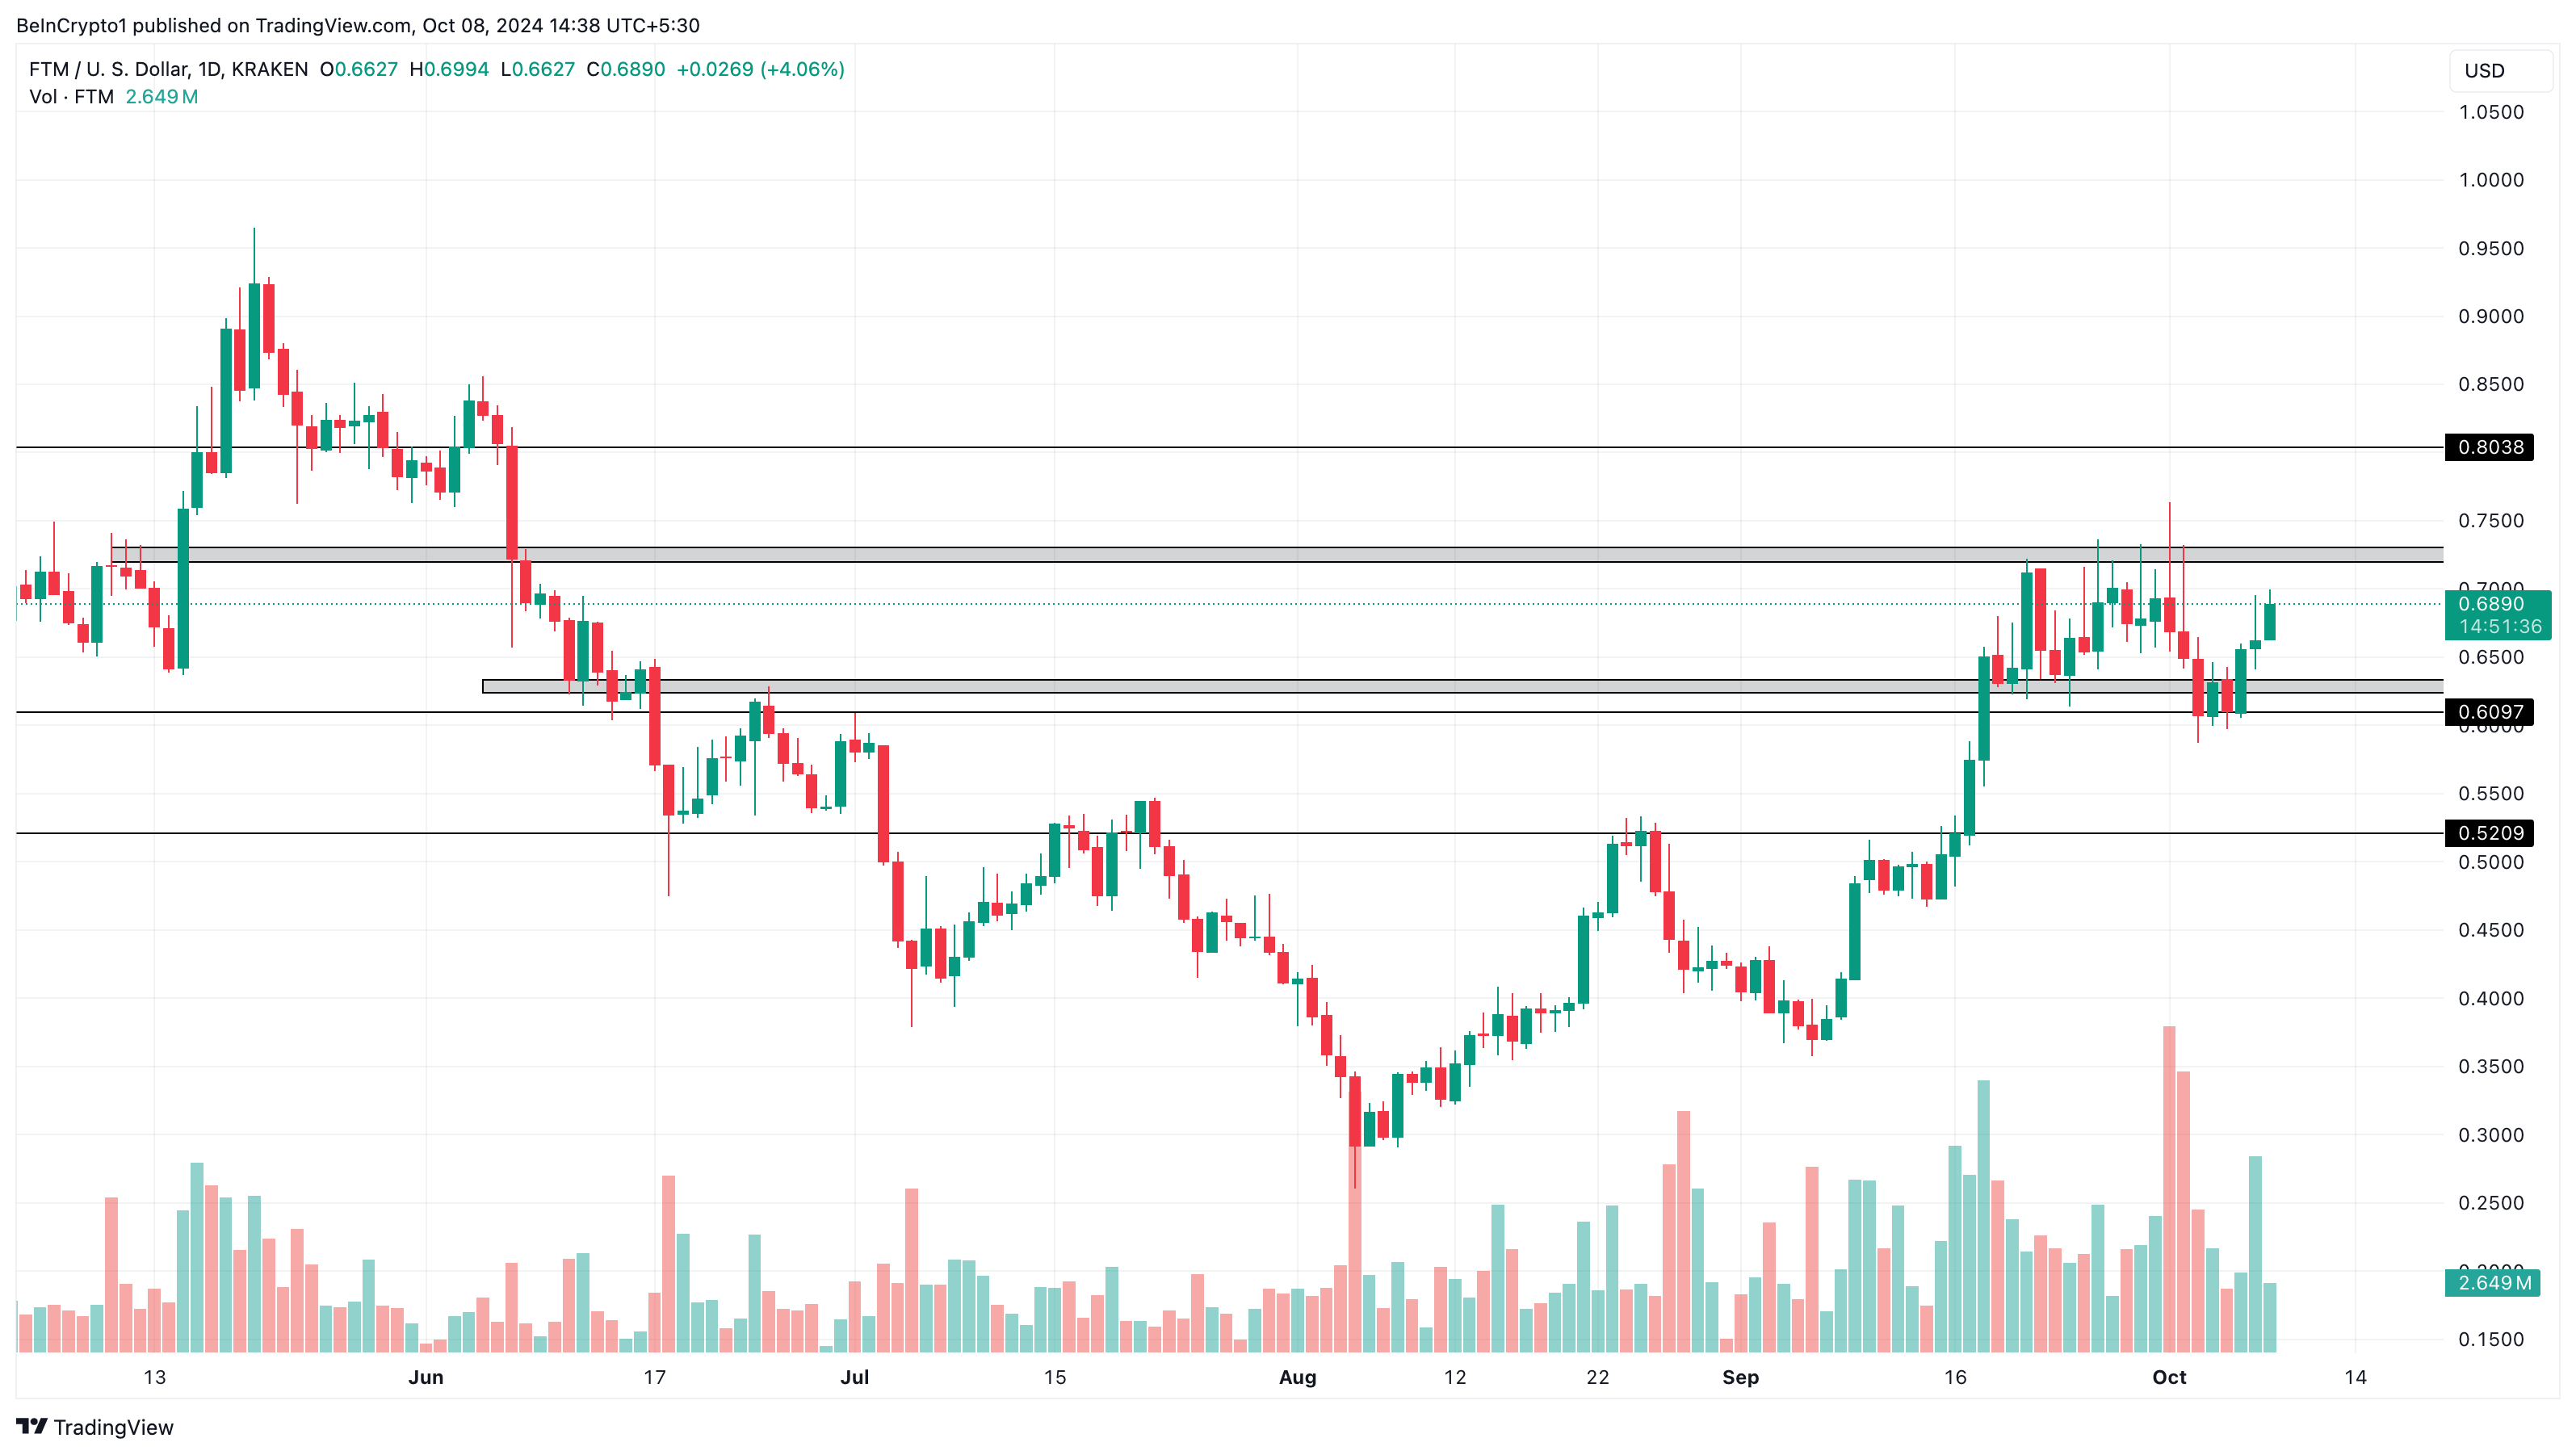
However, if bulls want to prevent the downside, they have to push the token well above the $0.73 resistance. If successful, the FTM/USD pair could rise to $0.80 and later toward $1 in the short term.
Disclaimer
In line with the Trust Project guidelines, this price analysis article is for informational purposes only and should not be considered financial or investment advice. BeInCrypto is committed to accurate, unbiased reporting, but market conditions are subject to change without notice. Always conduct your own research and consult with a professional before making any financial decisions. Please note that our Terms and Conditions, Privacy Policy, and Disclaimers have been updated.


Aayush Jindal, a luminary in the world of financial markets, whose expertise spans over 15 illustrious years in the realms of Forex and cryptocurrency trading. Renowned for his unparalleled proficiency in providing technical analysis, Aayush is a trusted advisor and senior market expert to investors worldwide, guiding them through the intricate landscapes of modern finance with his keen insights and astute chart analysis.
From a young age, Aayush exhibited a natural aptitude for deciphering complex systems and unraveling patterns. Fueled by an insatiable curiosity for understanding market dynamics, he embarked on a journey that would lead him to become one of the foremost authorities in the fields of Forex and crypto trading. With a meticulous eye for detail and an unwavering commitment to excellence, Aayush honed his craft over the years, mastering the art of technical analysis and chart interpretation.
As a software engineer, Aayush harnesses the power of technology to optimize trading strategies and develop innovative solutions for navigating the volatile waters of financial markets. His background in software engineering has equipped him with a unique skill set, enabling him to leverage cutting-edge tools and algorithms to gain a competitive edge in an ever-evolving landscape.
In addition to his roles in finance and technology, Aayush serves as the director of a prestigious IT company, where he spearheads initiatives aimed at driving digital innovation and transformation. Under his visionary leadership, the company has flourished, cementing its position as a leader in the tech industry and paving the way for groundbreaking advancements in software development and IT solutions.
Despite his demanding professional commitments, Aayush is a firm believer in the importance of work-life balance. An avid traveler and adventurer, he finds solace in exploring new destinations, immersing himself in different cultures, and forging lasting memories along the way. Whether he’s trekking through the Himalayas, diving in the azure waters of the Maldives, or experiencing the vibrant energy of bustling metropolises, Aayush embraces every opportunity to broaden his horizons and create unforgettable experiences.
Aayush’s journey to success is marked by a relentless pursuit of excellence and a steadfast commitment to continuous learning and growth. His academic achievements are a testament to his dedication and passion for excellence, having completed his software engineering with honors and excelling in every department.
At his core, Aayush is driven by a profound passion for analyzing markets and uncovering profitable opportunities amidst volatility. Whether he’s poring over price charts, identifying key support and resistance levels, or providing insightful analysis to his clients and followers, Aayush’s unwavering dedication to his craft sets him apart as a true industry leader and a beacon of inspiration to aspiring traders around the globe.
In a world where uncertainty reigns supreme, Aayush Jindal stands as a guiding light, illuminating the path to financial success with his unparalleled expertise, unwavering integrity, and boundless enthusiasm for the markets.

Ripple’s recently acquired Hidden Road has secured a broker-dealer license from the Financial Industry Regulatory Authority (FINRA). This marks a significant milestone in expanding its prime brokerage services for institutional investors.
Market watchers see it as a deliberate strategy by Ripple to build infrastructure and position itself for future growth. That being said, traders are expecting that XRP’s value will rise later.
Ripple Expands Institutional Presence with Hidden Road’s FINRA License
According to the latest press release, Hidden Road Partners CIV US LLC was granted approval. The license now enables the firm to provide a broader suite of regulatory-compliant services, including clearing, financing, and prime brokerage for fixed-income assets to institutions.
Noel Kimmel, President of Hidden Road, highlighted that the license was a pivotal development for the company. According to him, it enhances Hidden Road’s ability to operate in traditional financial (TradFi) markets.
“As a FINRA member, we will be able to bring our best-in-class, technology-driven fixed income service offering to an expanded universe of institutional clients. Our business has tremendous momentum, and we look forward to continuing to provide superior execution and support to our clients amidst today’s exceptionally dynamic market environment,” Kimmel said.
The FINRA approval follows Ripple’s $1.25 billion acquisition of Hidden Road. Announced on April 8, 2025, this was one of the largest deals in the digital assets sector.
The move positions Ripple as the first cryptocurrency company to own a global, multi-asset prime broker. Experts believe the acquisition and subsequent license are part of a broader strategy Ripple is employing.
“Hidden Road just secured a broker-dealer license right after Ripple’s acquisition. This isn’t a coincidence, it’s a statement. XRP is not playing checkers. It’s playing regulatory chess,” an analyst wrote on X (formerly Twitter).
Is Ripple Behind XRP’s Low Price? Analyst Thinks So
In fact, analysts also claim that XRP’s neutral reaction to recent milestones isn’t a sign of weakness but rather a strategic move. In a recent analysis, crypto analyst Levi argued that the current price of XRP, hovering around $2, is not coincidental, but rather a result of Ripple’s deliberate approach.
He suggested that the low price is designed to allow Ripple to operate under the radar while making key strategic moves, such as the Hidden Road acquisition.
“Hidden Road isn’t a flex. It’s infrastructure. It’s the final puzzle piece — giving Ripple a fully integrated, lightning-fast, global value settlement system,” he stated.
The analyst emphasized that while the public focused on Ripple’s legal battles with the SEC, the company quietly built its global value settlement system behind the scenes.
“XRP at $2 isn’t undervalued — it’s deliberately suppressed. When the switch flips, the revaluation won’t be gradual — it’ll be instant,” Levi noted.
In his view, those who have invested early will be positioned to benefit as the market shifts. Meanwhile, XRP, after hitting an all-time high earlier this year, has continued to decline.

At press time, the altcoin was trading at $2.0. According to BeInCrypto data, this represented a decline of 1.0% over the past day.
Disclaimer
In adherence to the Trust Project guidelines, BeInCrypto is committed to unbiased, transparent reporting. This news article aims to provide accurate, timely information. However, readers are advised to verify facts independently and consult with a professional before making any decisions based on this content. Please note that our Terms and Conditions, Privacy Policy, and Disclaimers have been updated.

Aayush Jindal, a luminary in the world of financial markets, whose expertise spans over 15 illustrious years in the realms of Forex and cryptocurrency trading. Renowned for his unparalleled proficiency in providing technical analysis, Aayush is a trusted advisor and senior market expert to investors worldwide, guiding them through the intricate landscapes of modern finance with his keen insights and astute chart analysis.
From a young age, Aayush exhibited a natural aptitude for deciphering complex systems and unraveling patterns. Fueled by an insatiable curiosity for understanding market dynamics, he embarked on a journey that would lead him to become one of the foremost authorities in the fields of Forex and crypto trading. With a meticulous eye for detail and an unwavering commitment to excellence, Aayush honed his craft over the years, mastering the art of technical analysis and chart interpretation.
As a software engineer, Aayush harnesses the power of technology to optimize trading strategies and develop innovative solutions for navigating the volatile waters of financial markets. His background in software engineering has equipped him with a unique skill set, enabling him to leverage cutting-edge tools and algorithms to gain a competitive edge in an ever-evolving landscape.
In addition to his roles in finance and technology, Aayush serves as the director of a prestigious IT company, where he spearheads initiatives aimed at driving digital innovation and transformation. Under his visionary leadership, the company has flourished, cementing its position as a leader in the tech industry and paving the way for groundbreaking advancements in software development and IT solutions.
Despite his demanding professional commitments, Aayush is a firm believer in the importance of work-life balance. An avid traveler and adventurer, he finds solace in exploring new destinations, immersing himself in different cultures, and forging lasting memories along the way. Whether he’s trekking through the Himalayas, diving in the azure waters of the Maldives, or experiencing the vibrant energy of bustling metropolises, Aayush embraces every opportunity to broaden his horizons and create unforgettable experiences.
Aayush’s journey to success is marked by a relentless pursuit of excellence and a steadfast commitment to continuous learning and growth. His academic achievements are a testament to his dedication and passion for excellence, having completed his software engineering with honors and excelling in every department.
At his core, Aayush is driven by a profound passion for analyzing markets and uncovering profitable opportunities amidst volatility. Whether he’s poring over price charts, identifying key support and resistance levels, or providing insightful analysis to his clients and followers, Aayush’s unwavering dedication to his craft sets him apart as a true industry leader and a beacon of inspiration to aspiring traders around the globe.
In a world where uncertainty reigns supreme, Aayush Jindal stands as a guiding light, illuminating the path to financial success with his unparalleled expertise, unwavering integrity, and boundless enthusiasm for the markets.

Ethereum Fee Plunges To 5-Year Low—Is This A Bottom Signal?

Dogecoin (DOGE) Under Pressure—Bearish Setup Could Trigger Sell-Off

Quantum Researchers Offer 1 Bitcoin To Break ‘Toy Version’

Shiba Inu Follows Crypto Market Trend With “Shib Is For Everyone” Post, What’s Happening?

Is XRP’s Low Price Part of Ripple’s Long-Term Growth Strategy?

XRP Price Weakens—Further Losses on The Table?

2.52 Million Altcoins Are Ruining Crypto’s Future

Animoca Brands Valuation Tanks 75% In Two Years, Here’s Why

Crypto exchange BingX hacked for $43 million

Are The Big Players Losing Interest?

Hong Kong’s Securities Association Tips Authorities On Crypto Self-Regulation

Coinbase cbBTC Set to go Live on Solana
2.52 Million Altcoins Are Ruining Crypto’s Future
Animoca Brands Valuation Tanks 75% In Two Years, Here’s Why
Crypto exchange BingX hacked for $43 million
Are The Big Players Losing Interest?
Hong Kong’s Securities Association Tips Authorities On Crypto Self-Regulation
Coinbase cbBTC Set to go Live on Solana
-
 Altcoin22 hours ago
How Rising Solana Network Inflows Could Drive SOL Price to $150?
-
 Bitcoin21 hours ago
Gary Gensler Explains Why Bitcoin Will Outlast Altcoins
-

 Market21 hours ago
Bitcoin Whales Withdraw $280 Million: Bullish Signal?
-

 Altcoin14 hours ago
CZ Honors Nearly $1 Billion Token Burn Promise
-
 Market17 hours ago
Bitcoin Price Poised for $90,000 Surge
-
 Market22 hours ago
XRP’s $2.00 Pivot Point—A Launchpad or Breakdown Zone?
-

 Market14 hours ago
Over $700 Million In XRP Moved In April, What Are Crypto Whales Up To?
-
 Altcoin21 hours ago
How Crypto Traders Made $666K from $4.5K in One Trade?