
Market
Will XRP Price Climb To $0.66?

XRP’s value has dropped by 17% over the past week, fueled by the broader market downturn and further impacted by the US SEC’s decision to file an appeal against Ripple.
Although buying pressure has weakened significantly over the past few days, traders in the XRP derivatives market remain optimistic. This analysis explores whether or not the bets of these traders will produce favorable results in the near term.
Ripple Long Traders Double Down
Despite the broader market downturn and the ongoing legal battle between the US SEC and Ripple, XRP derivatives traders maintain a bullish outlook. Long positions continue to dominate, reflecting investor optimism about XRP’s price potential.
This sentiment is supported by the token’s funding rate, which has consistently stayed positive. As of now, the funding rate is at 0.004%, indicating sustained confidence in XRP’s future growth.
Read more: XRP ETF Explained: What It Is and How It Works
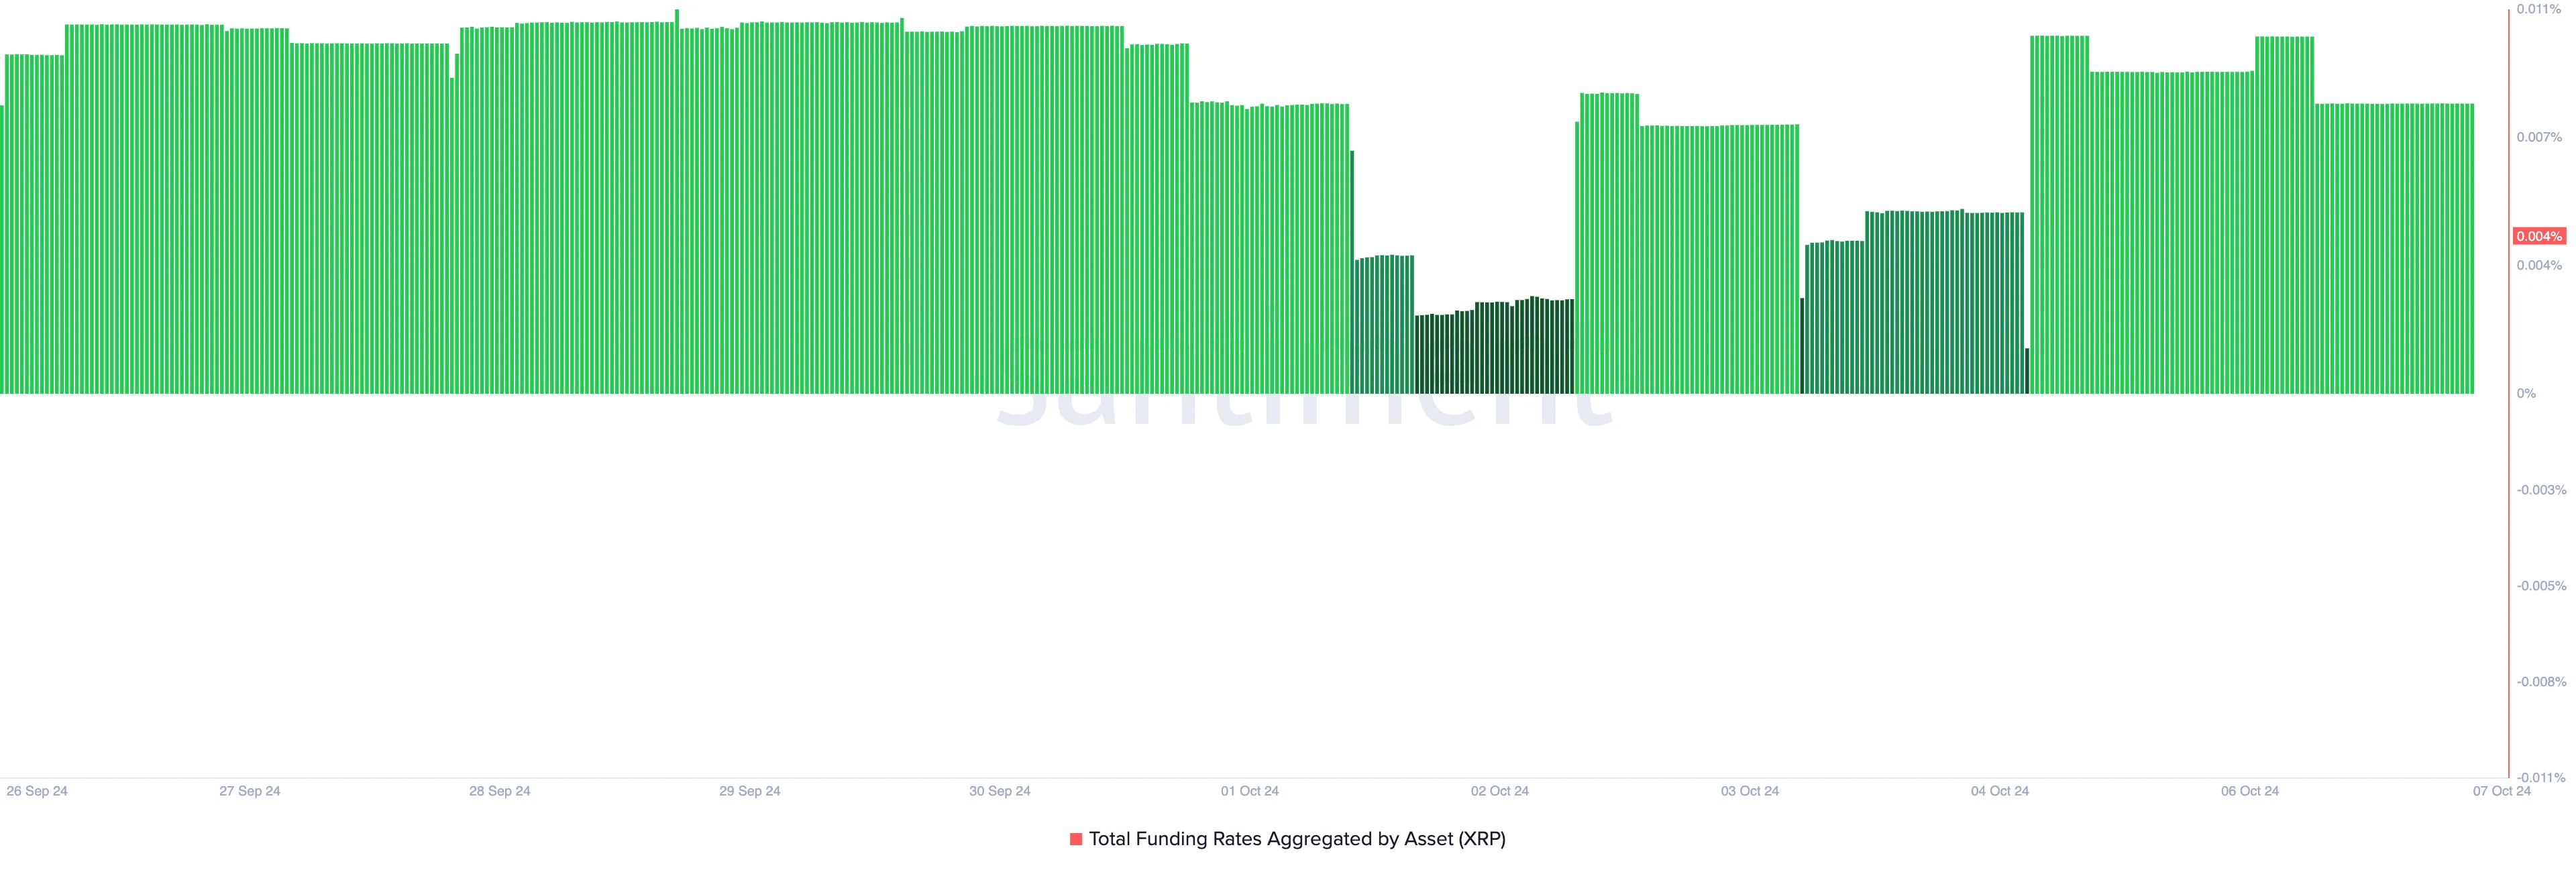
A positive funding rate suggests a higher demand for long positions than short ones in the market. It occurs when traders are optimistic about an asset’s future price increases and, as a result, are willing to pay a premium to maintain their long positions.
However, XRP spot traders do not share this stance. They continue to sell their holdings amid fear of a significant price decline once the hearing of the US SEC appeal commences. The token’s negative Chaikin Money Flow (CMF) confirms the strengthening selling pressure.
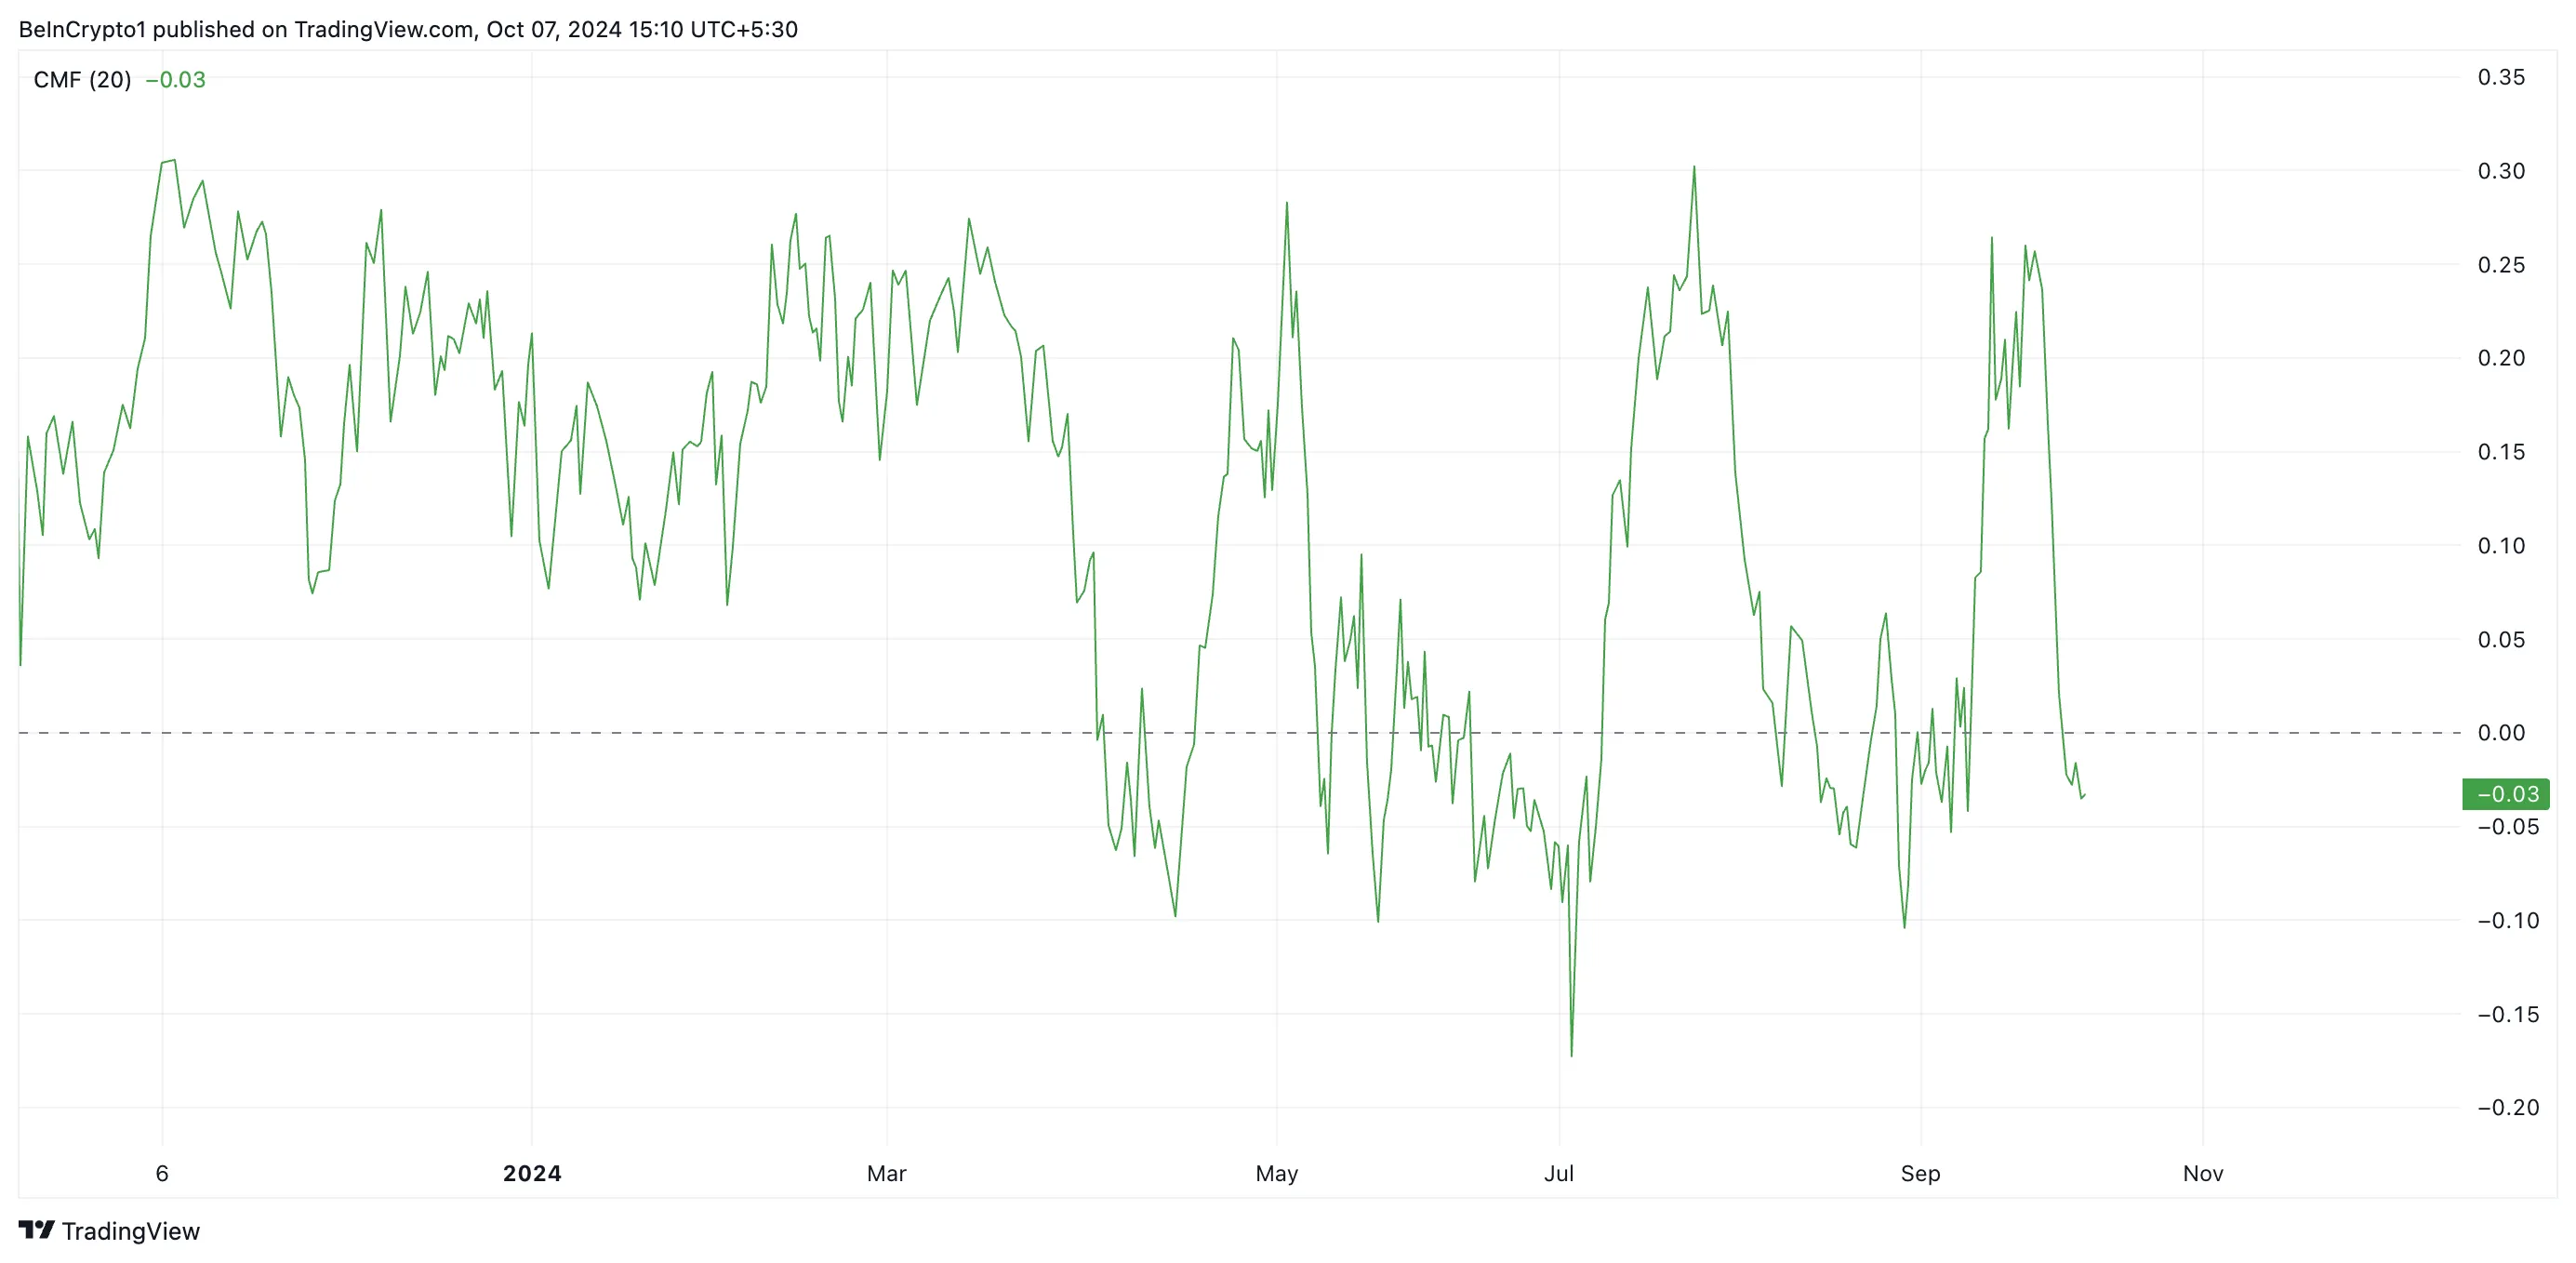
As of this writing, XRP’s CMF is below the zero line at -0.03. This indicator measures money flows into and out of an asset. When its value is below zero, selling pressure is high as traders remove liquidity from the market to prevent further investment losses.
XRP Price Prediction: Token Trades Below Key Moving Averages
XRP is currently trading below its 20-day exponential moving average (EMA) and its 50-day simple moving average (SMA). The 20-day EMA is a short-term indicator that quickly responds to price changes by averaging an asset’s closing price over the past 20 days. In contrast, the 50-day SMA provides a longer-term perspective by tracking the average closing price over 50 days.
These moving averages are key indicators for traders, often marking support and resistance levels. When an asset’s price drops below the 20-day EMA, it suggests a potential shift in momentum, possibly leading to further declines. A drop below the 50-day SMA typically confirms a bearish trend.
Read more: Ripple (XRP) Price Prediction 2024/2025/2030
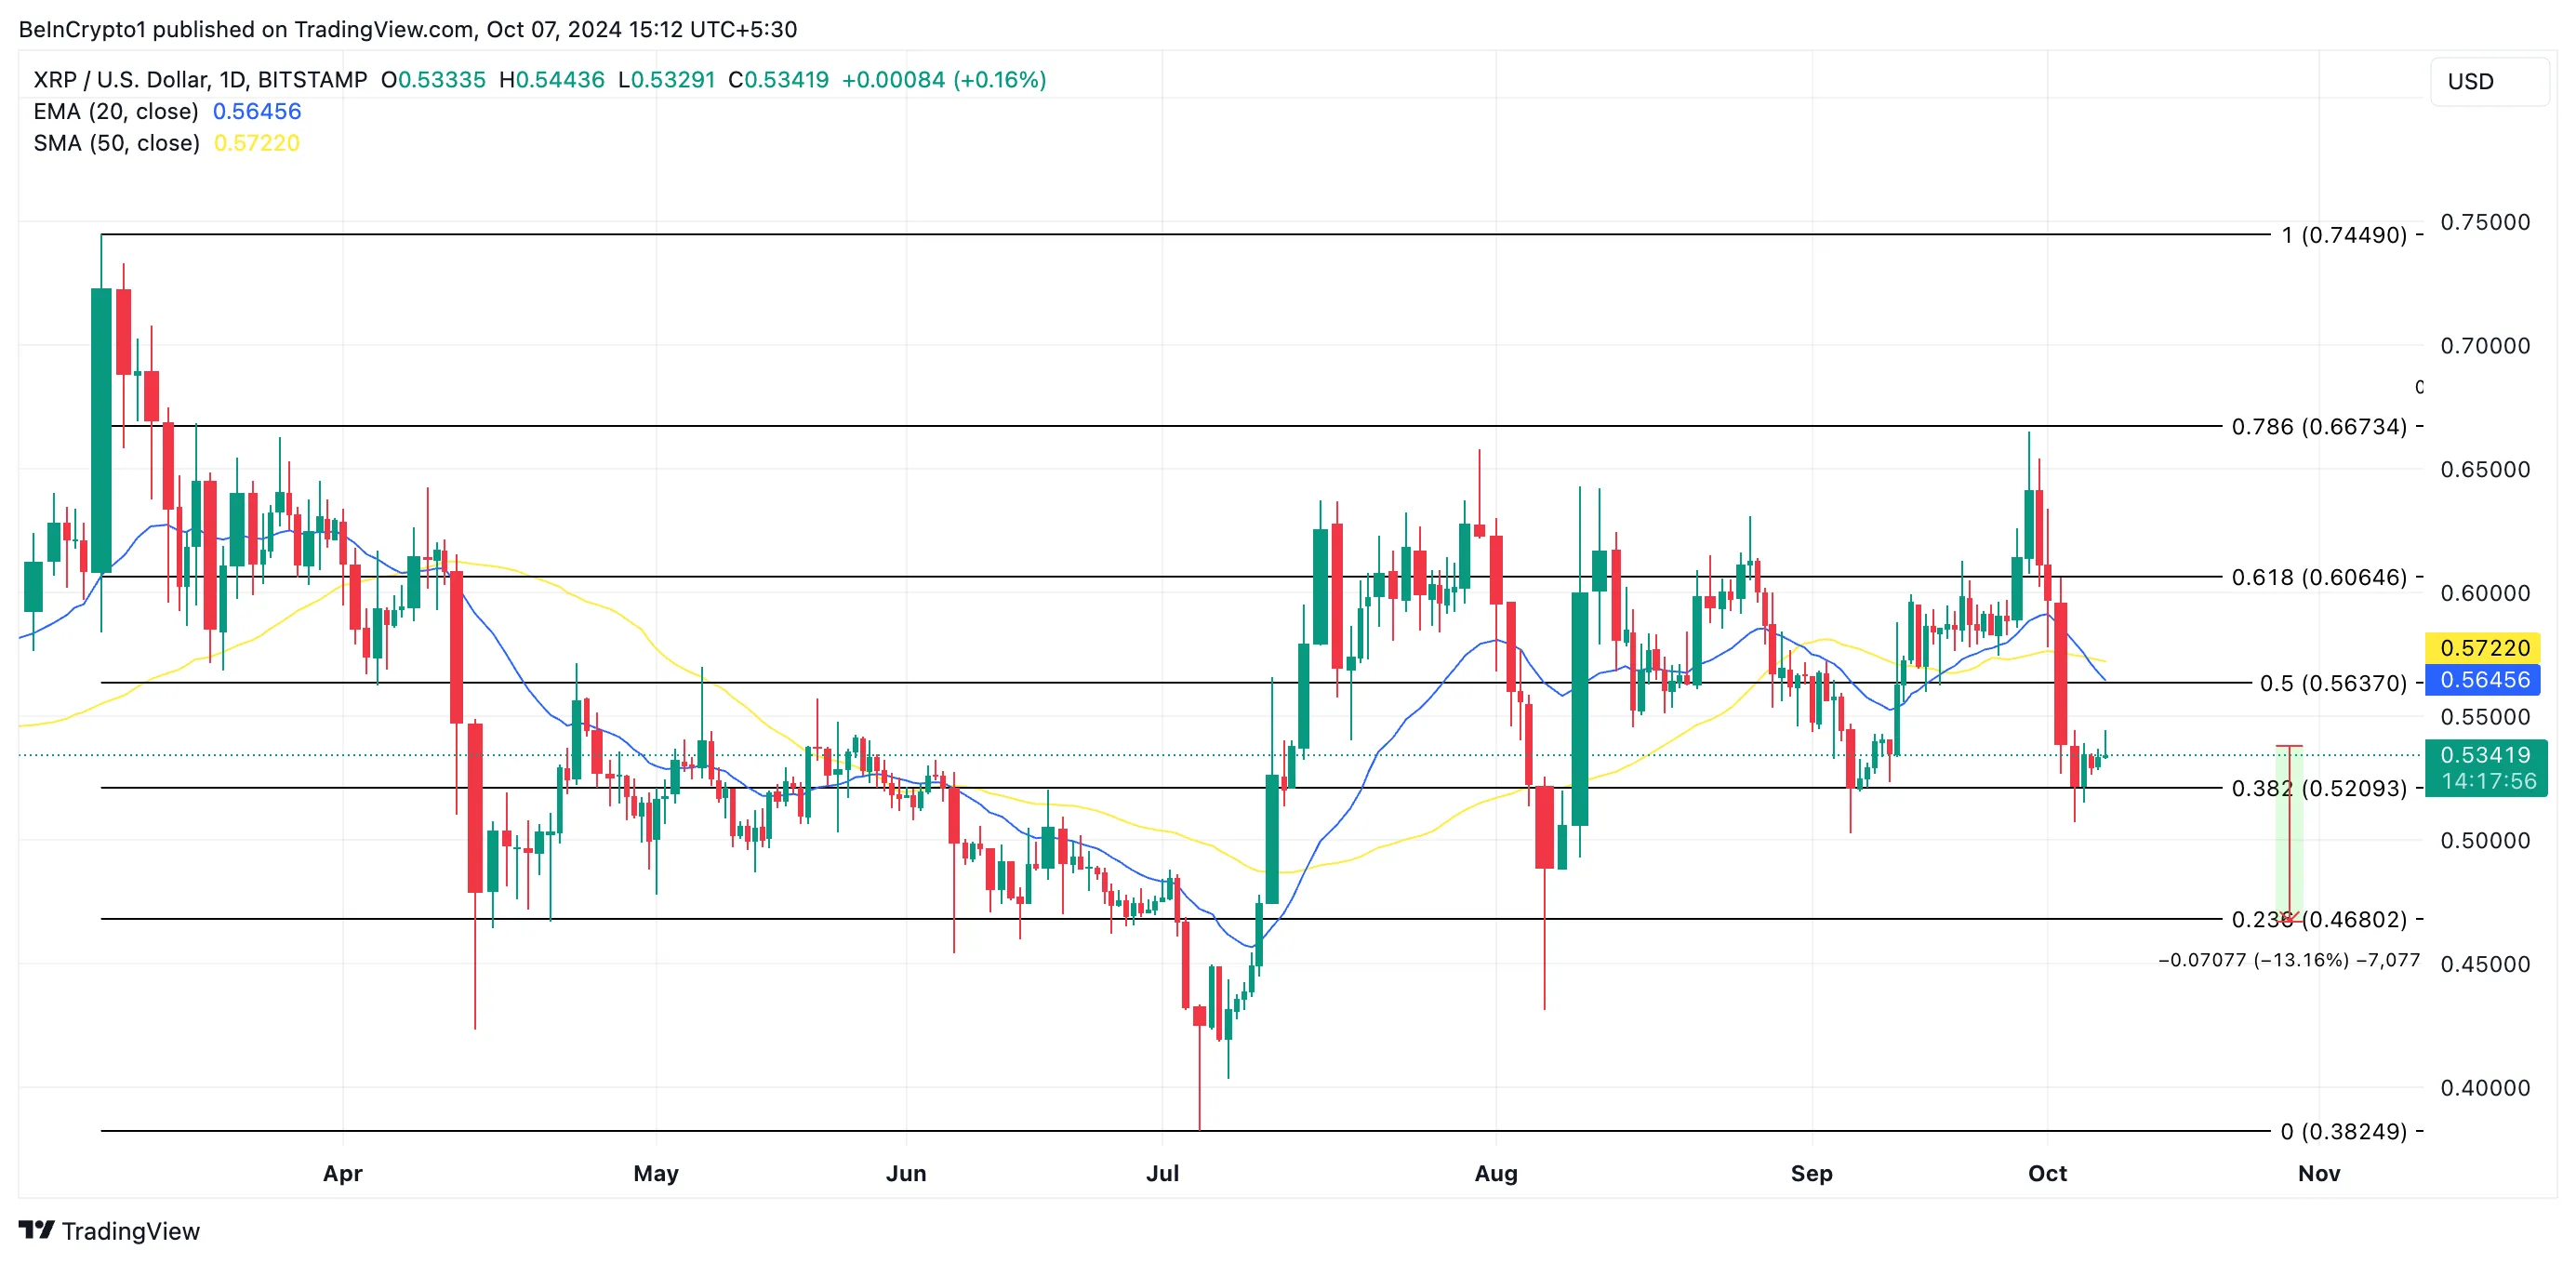
XRP is facing a potential 13% decline, which could see it drop to $0.46 if it continues to distance itself from these crucial averages. However, if sentiment in the spot market turns positive and demand rises, XRP’s price could rally by 25%, pushing it to $0.66.
Disclaimer
In line with the Trust Project guidelines, this price analysis article is for informational purposes only and should not be considered financial or investment advice. BeInCrypto is committed to accurate, unbiased reporting, but market conditions are subject to change without notice. Always conduct your own research and consult with a professional before making any financial decisions. Please note that our Terms and Conditions, Privacy Policy, and Disclaimers have been updated.


Reason to trust
![]()
Strict editorial policy that focuses on accuracy, relevance, and impartiality
Created by industry experts and meticulously reviewed
The highest standards in reporting and publishing
Strict editorial policy that focuses on accuracy, relevance, and impartiality
Morbi pretium leo et nisl aliquam mollis. Quisque arcu lorem, ultricies quis pellentesque nec, ullamcorper eu odio.
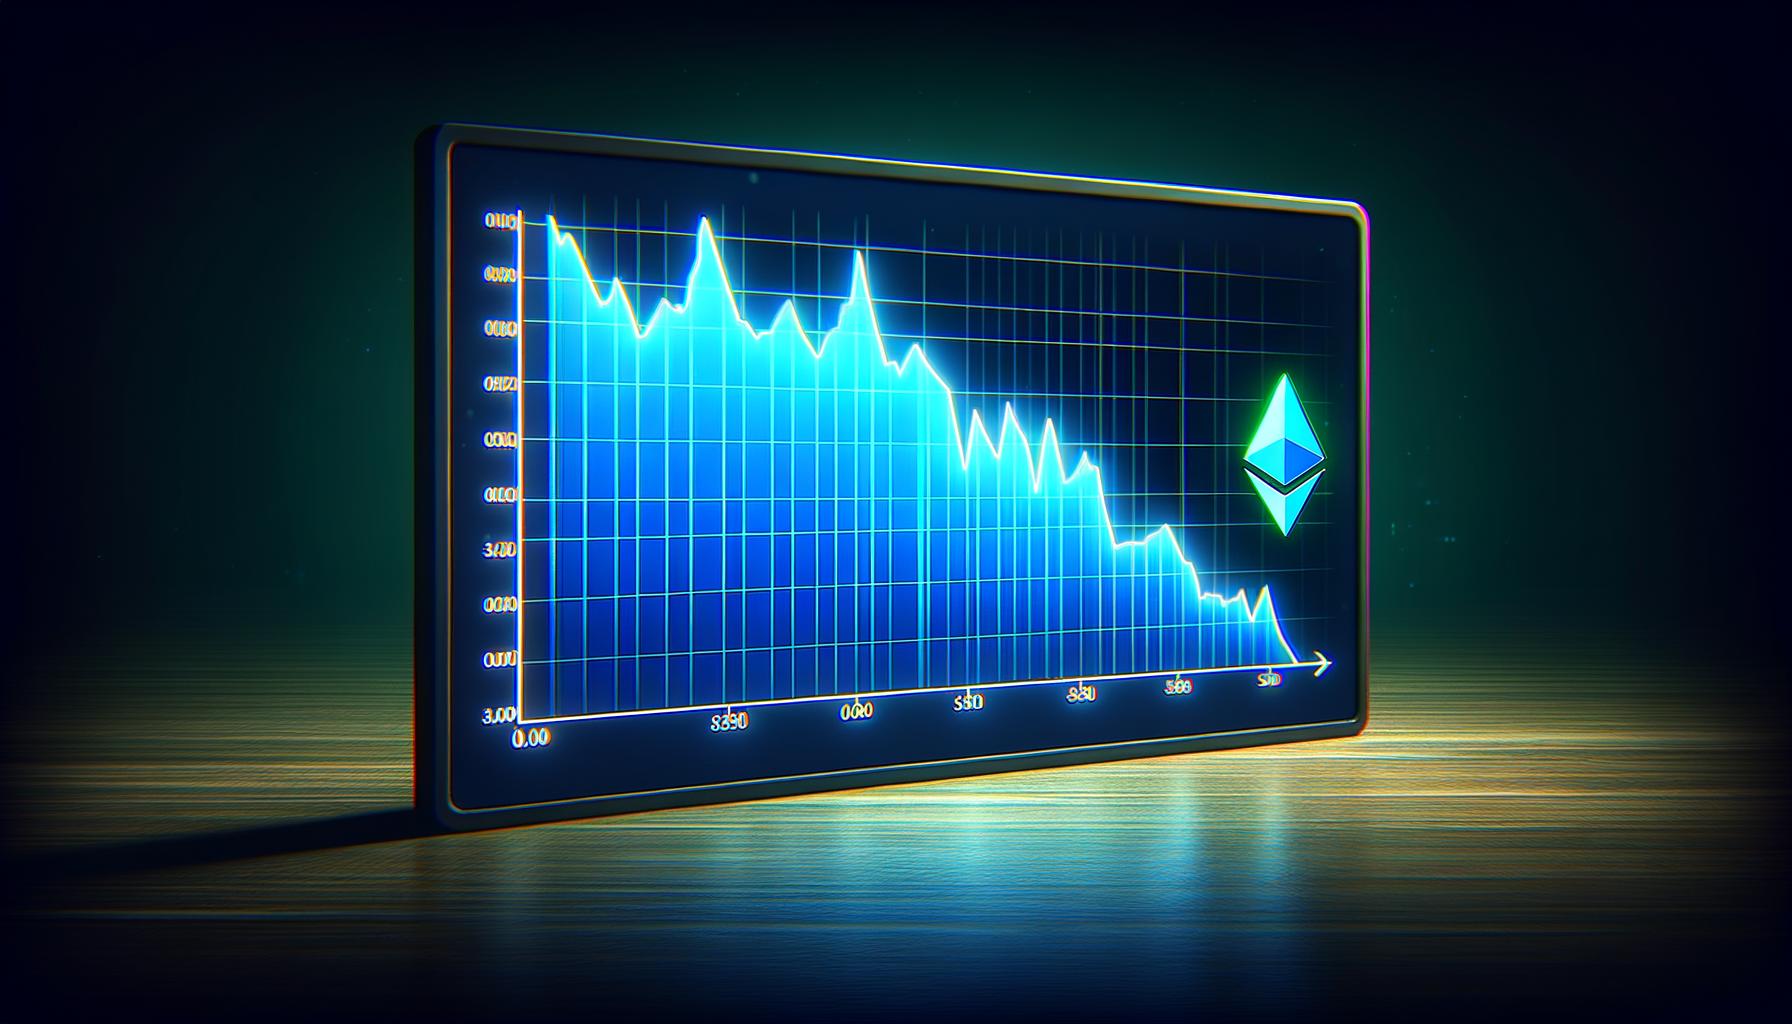
Ethereum price started another decline and traded below the $1,880 level. ETH is now consolidating and remains at risk of more losses.
- Ethereum struggled to continue higher above the $2,000 resistance level.
- The price is trading below $1,880 and the 100-hourly Simple Moving Average.
- There is a connecting bearish trend line forming with resistance at $1,820 on the hourly chart of ETH/USD (data feed via Kraken).
- The pair must clear the $1,820 and $1,880 resistance levels to start a decent increase.
Ethereum Price Dips Again
Ethereum price failed to continue higher above $2,100 and started another decline, like Bitcoin. ETH declined below the $1,920 and $1,880 support levels.
It tested the $1,765 zone. A low was formed at $1,767 and the price recently attempted a fresh upward move. There was a move above the $1,800 level but the price is still below the 23.6% Fib retracement level of the recent decline from the $2,033 swing high to the $1,767 low.
Ethereum price is now trading below $1,880 and the 100-hourly Simple Moving Average. There is also a connecting bearish trend line forming with resistance at $1,820 on the hourly chart of ETH/USD.
On the upside, the price seems to be facing hurdles near the $1,820 level. The next key resistance is near the $1,880 level and the 50% Fib retracement level of the recent decline from the $2,033 swing high to the $1,767 low. The first major resistance is near the $1,920 level.

A clear move above the $1,920 resistance might send the price toward the $2,000 resistance. An upside break above the $2,000 resistance might call for more gains in the coming sessions. In the stated case, Ether could rise toward the $2,050 resistance zone or even $2,120 in the near term.
More Losses In ETH?
If Ethereum fails to clear the $1,880 resistance, it could start another decline. Initial support on the downside is near the $1,780 level. The first major support sits near the $1,765 zone.
A clear move below the $1,765 support might push the price toward the $1,720 support. Any more losses might send the price toward the $1,680 support level in the near term. The next key support sits at $1,650.
Technical Indicators
Hourly MACD – The MACD for ETH/USD is losing momentum in the bearish zone.
Hourly RSI – The RSI for ETH/USD is now below the 50 zone.
Major Support Level – $1,765
Major Resistance Level – $1,880

Reason to trust
![]()
Strict editorial policy that focuses on accuracy, relevance, and impartiality
Created by industry experts and meticulously reviewed
The highest standards in reporting and publishing
Strict editorial policy that focuses on accuracy, relevance, and impartiality
Morbi pretium leo et nisl aliquam mollis. Quisque arcu lorem, ultricies quis pellentesque nec, ullamcorper eu odio.
Bitcoin price started another decline below the $85,000 zone. BTC is now consolidating and might struggle to recover above the $83,500 zone.
- Bitcoin started a fresh decline below the $83,500 support zone.
- The price is trading below $83,200 and the 100 hourly Simple moving average.
- There is a connecting bearish trend line forming with resistance at $82,750 on the hourly chart of the BTC/USD pair (data feed from Kraken).
- The pair could start another decline if it stays below the $83,500 resistance zone.
Bitcoin Price Dips Further
Bitcoin price failed to remain above the $85,500 level. BTC started another decline and traded below the support area at $85,000. The bears gained strength for a move below the $83,500 support zone.
The price even declined below the $82,000 level. A low was formed at $81,586 and the price is now consolidating losses below the 23.6% Fib retracement level of the downward move from the $83,500 swing high to the $81,586 swing low.
Bitcoin price is now trading below $82,500 and the 100 hourly Simple moving average. On the upside, immediate resistance is near the $82,000 level. The first key resistance is near the $82,750 level. There is also a connecting bearish trend line forming with resistance at $82,750 on the hourly chart of the BTC/USD pair.

The trend line is near the 61.8% Fib retracement level of the downward move from the $83,500 swing high to the $81,586 swing low. The next key resistance could be $83,500. A close above the $83,500 resistance might send the price further higher. In the stated case, the price could rise and test the $84,200 resistance level. Any more gains might send the price toward the $84,800 level or even $85,000.
Another Decline In BTC?
If Bitcoin fails to rise above the $83,500 resistance zone, it could start a fresh decline. Immediate support on the downside is near the $81,800 level. The first major support is near the $81,500 level.
The next support is now near the $80,650 zone. Any more losses might send the price toward the $80,000 support in the near term. The main support sits at $78,500.
Technical indicators:
Hourly MACD – The MACD is now gaining pace in the bearish zone.
Hourly RSI (Relative Strength Index) – The RSI for BTC/USD is now below the 50 level.
Major Support Levels – $81,500, followed by $80,650.
Major Resistance Levels – $82,750 and $83,500.

Solana (SOL) has dropped over 6% in the past seven days and has been trading below $150 since March 6. The current trend shows clear bearish signals across multiple indicators.
From a death cross to a rising ADX and a red Ichimoku Cloud, technicals suggest growing downside pressure. With SOL nearing key support, the next few days could be critical for its price direction.
SOL Ichimoku Cloud Paints A Bearish Picture
The Ichimoku Cloud chart for Solana shows a clear bearish structure, with price action trading below both the Kijun-sen (red line) and Tenkan-sen (blue line).
The Lagging Span (green line) is also positioned below the price candles and the cloud, reinforcing the negative outlook. The Kumo ahead is red and descending, suggesting that resistance remains strong in the near term.

Solana has struggled to break above short-term resistance levels and remains stuck in a downward channel. The thin nature of the current cloud suggests weak support, making the price vulnerable to further downside if bearish momentum continues.
For a reversal, Solana would need to break above the Kijun-sen and push decisively toward the cloud, but for now, the trend remains tilted to the downside.
Solana DMI Shows Sellers Are In Control
Solana’s DMI chart shows a sharp rise in the ADX, now at 40.87—up from 19.74 just three days ago.
The ADX (Average Directional Index) measures the strength of a trend, with values above 25 indicating a strong trend and values above 40 signaling a very strong one.
This surge confirms that the current downtrend in SOL is gaining momentum.

At the same time, the +DI has dropped from 17.32 to 8.82, while the -DI has climbed to 31.09, where it has held steady for the past two days.
This setup suggests that the sellers are firmly in control, and the downtrend is strong and also strengthening.
As long as the -DI remains dominant and ADX stays elevated, SOL is likely to remain under pressure in the short term.
Can Solana Drop Below $110 Soon?
Solana recently formed a death cross, a bearish signal where short-term moving averages cross below long-term ones.
It’s now approaching key support at $120—if that level breaks, Solana price could drop to $112, and possibly below $110 for the first time since February 2024.

If bulls step in and buying pressure returns, SOL could rebound toward resistance at $136.
A breakout above that level may lead to a push toward $147, which acted as strong resistance just five days ago.
Disclaimer
In line with the Trust Project guidelines, this price analysis article is for informational purposes only and should not be considered financial or investment advice. BeInCrypto is committed to accurate, unbiased reporting, but market conditions are subject to change without notice. Always conduct your own research and consult with a professional before making any financial decisions. Please note that our Terms and Conditions, Privacy Policy, and Disclaimers have been updated.

Ethereum Price Weakens—Can Bulls Prevent a Major Breakdown?

Bitcoin Bears Tighten Grip—Where’s the Next Support?

Cardano Price Eyes Massive Pump In May Following Cyclical Patern From 2024

Solana (SOL) Price Risks Dip Below $110 as Bears Gain Control

Top 3 Made in USA Coins to Watch This Week

Japan Set To Classify Cryptocurrencies As Financial Products, Here’s All

2.52 Million Altcoins Are Ruining Crypto’s Future

Animoca Brands Valuation Tanks 75% In Two Years, Here’s Why

Crypto exchange BingX hacked for $43 million

Are The Big Players Losing Interest?

Hong Kong’s Securities Association Tips Authorities On Crypto Self-Regulation

Coinbase cbBTC Set to go Live on Solana
2.52 Million Altcoins Are Ruining Crypto’s Future
Animoca Brands Valuation Tanks 75% In Two Years, Here’s Why
Crypto exchange BingX hacked for $43 million
Are The Big Players Losing Interest?
Hong Kong’s Securities Association Tips Authorities On Crypto Self-Regulation
Coinbase cbBTC Set to go Live on Solana
-

 Ethereum16 hours ago
Ethereum Analyst Eyes $1,200-$1,300 Level As Potential Acquisition Zone – Details
-
 Market19 hours ago
Whale Leverages $27.5 Million PEPE Long on Hyperliquid
-

 Ethereum17 hours ago
Ethereum May Have Hit Cycle Bottom, But Pricing Bands Signal Strong Resistance At $2,300
-

 Market17 hours ago
Bitcoin (BTC) Whales Accumulate as Market Faces Uncertainty
-

 Bitcoin16 hours ago
Gold Keeps Outperforming Bitcoin Amid Trump’s Trade War Chaos
-

 Regulation23 hours ago
Kentucky Governor Signs Off On ‘Bitcoin Rights’ Bill, Strengthening Crypto Protections
-
 Altcoin15 hours ago
Analyst Reveals Why The XRP Price Can Hit ATH In The Next 90 To 120 Days
-

 Bitcoin22 hours ago
Why Bitcoin Seasoned Investors Are Accumulating — Analyst Evaluates BTC’s Current Phase