
Market
Dogecoin (DOGE) Leaps Higher: Can The Momentum Last?

Dogecoin is recovering losses from the $0.1020 zone against the US Dollar. DOGE is now showing positive signs and might clear the $0.1165 resistance.
- DOGE price started a fresh increase above the $0.1100 resistance level.
- The price is trading above the $0.1120 level and the 100-hourly simple moving average.
- There was a break above a major bearish trend line with resistance at $0.1100 on the hourly chart of the DOGE/USD pair (data source from Kraken).
- The price could gain bullish momentum if it clears the $0.1165 and $0.1180 resistance levels.
Dogecoin Price Starts Recovery
Dogecoin price declined toward the $0.100 support. DOGE traded as low as $0.1012 and recently started a fresh increase like Bitcoin and Ethereum. There was a move above the $0.1060 and $0.1080 resistance levels.
The price surpassed the $0.1120 resistance level. There was a break above a major bearish trend line with resistance at $0.1100 on the hourly chart of the DOGE/USD pair. It traded above the 23.6% Fib retracement level of the downward wave from the $0.1320 swing high to the $0.1012 low.
Dogecoin price is now trading above the $0.1120 level and the 100-hourly simple moving average. Immediate resistance on the upside is near the $0.1165 level. It is close to the 50% Fib retracement level of the downward wave from the $0.1320 swing high to the $0.1012 low.

The next major resistance is near the $0.1180 level. A close above the $0.1180 resistance might send the price toward the $0.1240 resistance. Any more gains might send the price toward the $0.1265 level. The next major stop for the bulls might be $0.1320.
Another Decline In DOGE?
If DOGE’s price fails to climb above the $0.1165 level, it could start another decline. Initial support on the downside is near the $0.1120 level. The next major support is near the $0.1100 level.
The main support sits at $0.1080. If there is a downside break below the $0.1080 support, the price could decline further. In the stated case, the price might decline toward the $0.1020 level or even $0.0980 in the near term.
Technical Indicators
Hourly MACD – The MACD for DOGE/USD is now gaining momentum in the bullish zone.
Hourly RSI (Relative Strength Index) – The RSI for DOGE/USD is now above the 50 level.
Major Support Levels – $0.1120 and $0.1080.
Major Resistance Levels – $0.1165 and $0.1240.


Story’s IP is today’s top-performing asset. Its price has surged 5% to trade at $$4.37 at press time, defying the broader market’s lackluster performance.
However, despite the price uptick, the weakening demand for the altcoin raises concerns about its rally’s sustainability.
IP Price Rises, But Falling Volume Signals Weak Buying Momentum
IP’s daily trading volume has plummeted by 7% over the past 24 hours despite the token’s price surge. This forms a negative divergence that hints at the likelihood of a price correction.
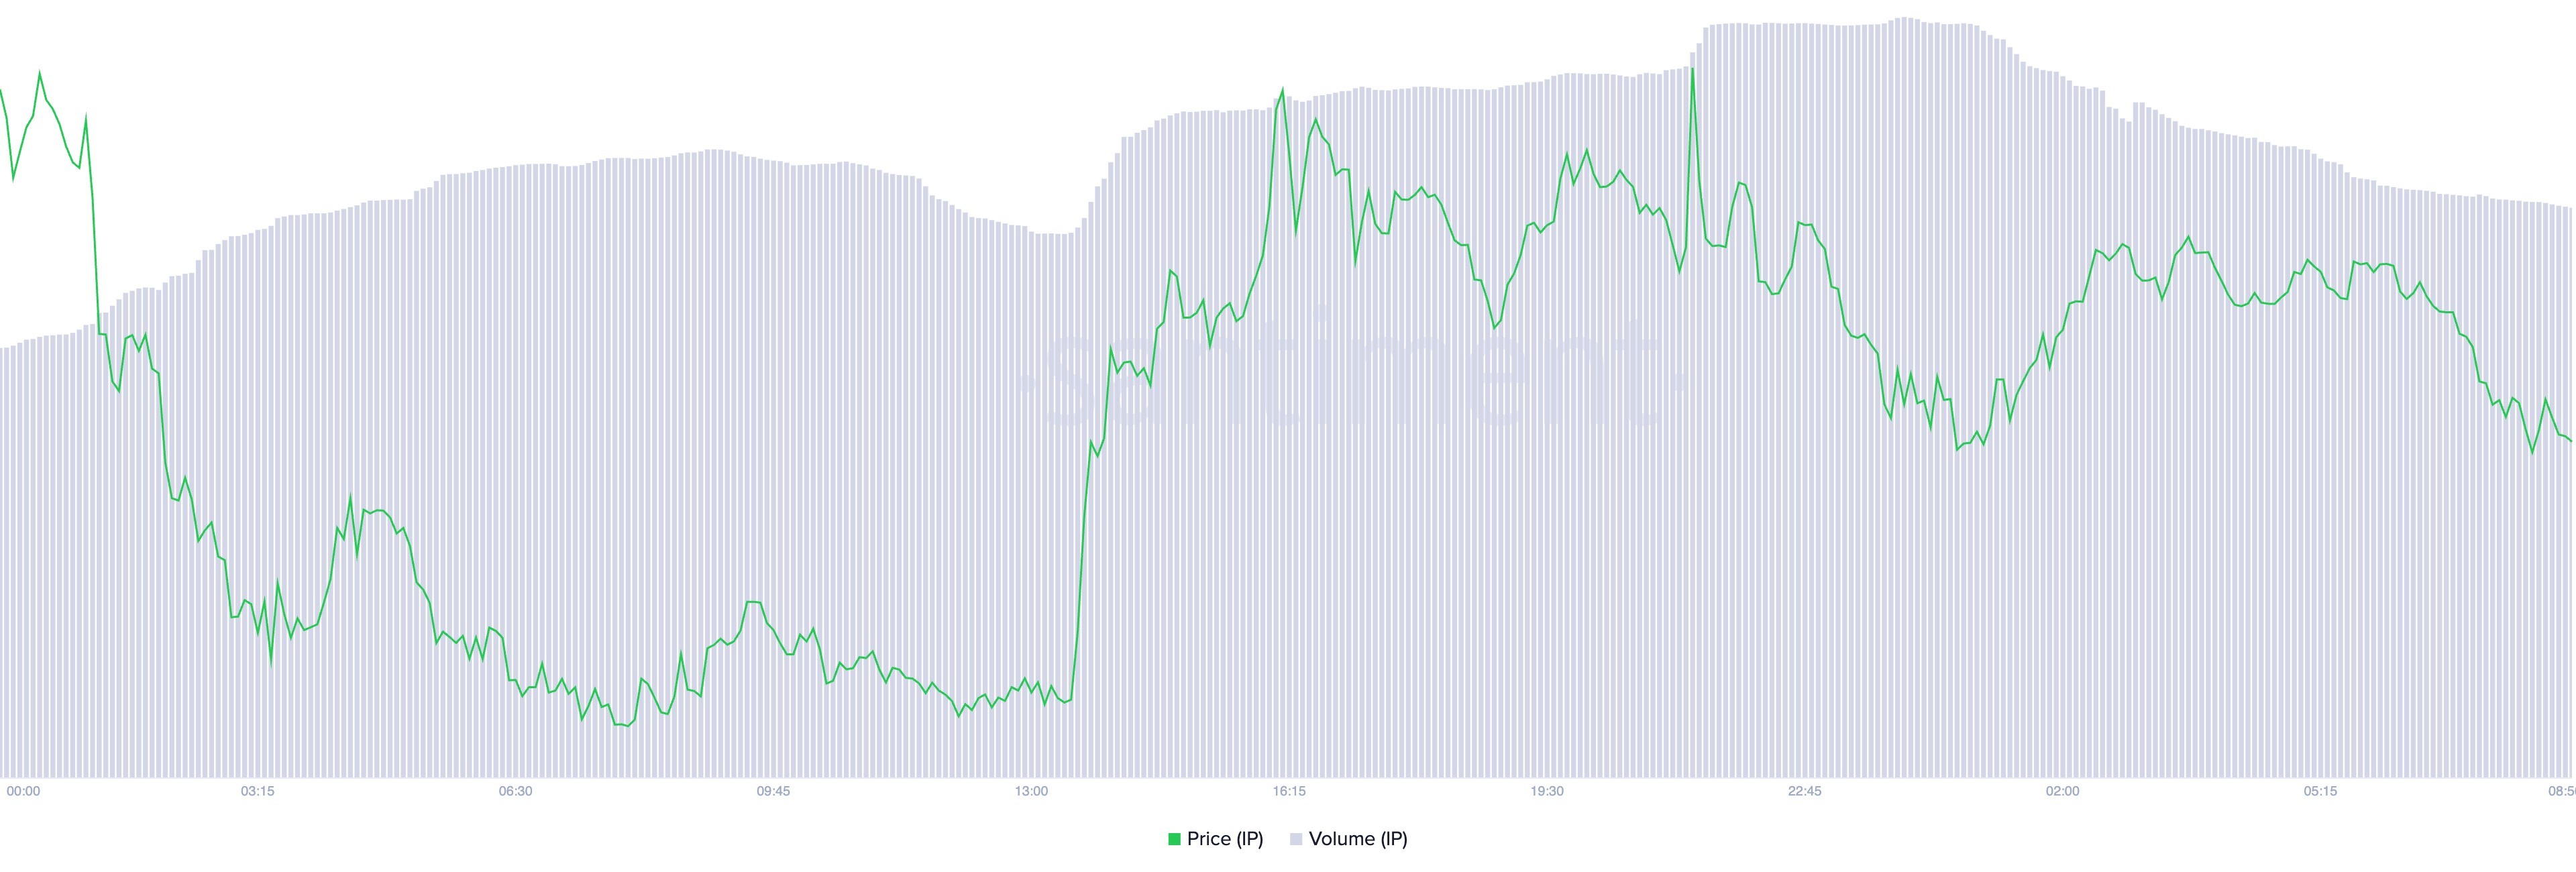
A negative divergence emerges when an asset’s price rises while trading volume falls. It suggests weak buying momentum and a lack of strong market participation.
This indicates that the IP rally may not be sustainable, as fewer traders are backing its upward move. Without sufficient volume to reinforce the price increase, the altcoin is at risk of a potential reversal or correction.
Further, IP’s Moving Average Convergence Divergence (MACD) setup supports this bearish outlook. As of this writing, the token’s MACD line (blue) rests below its signal line (orange), reflecting the selling pressure among IP spot market participants.
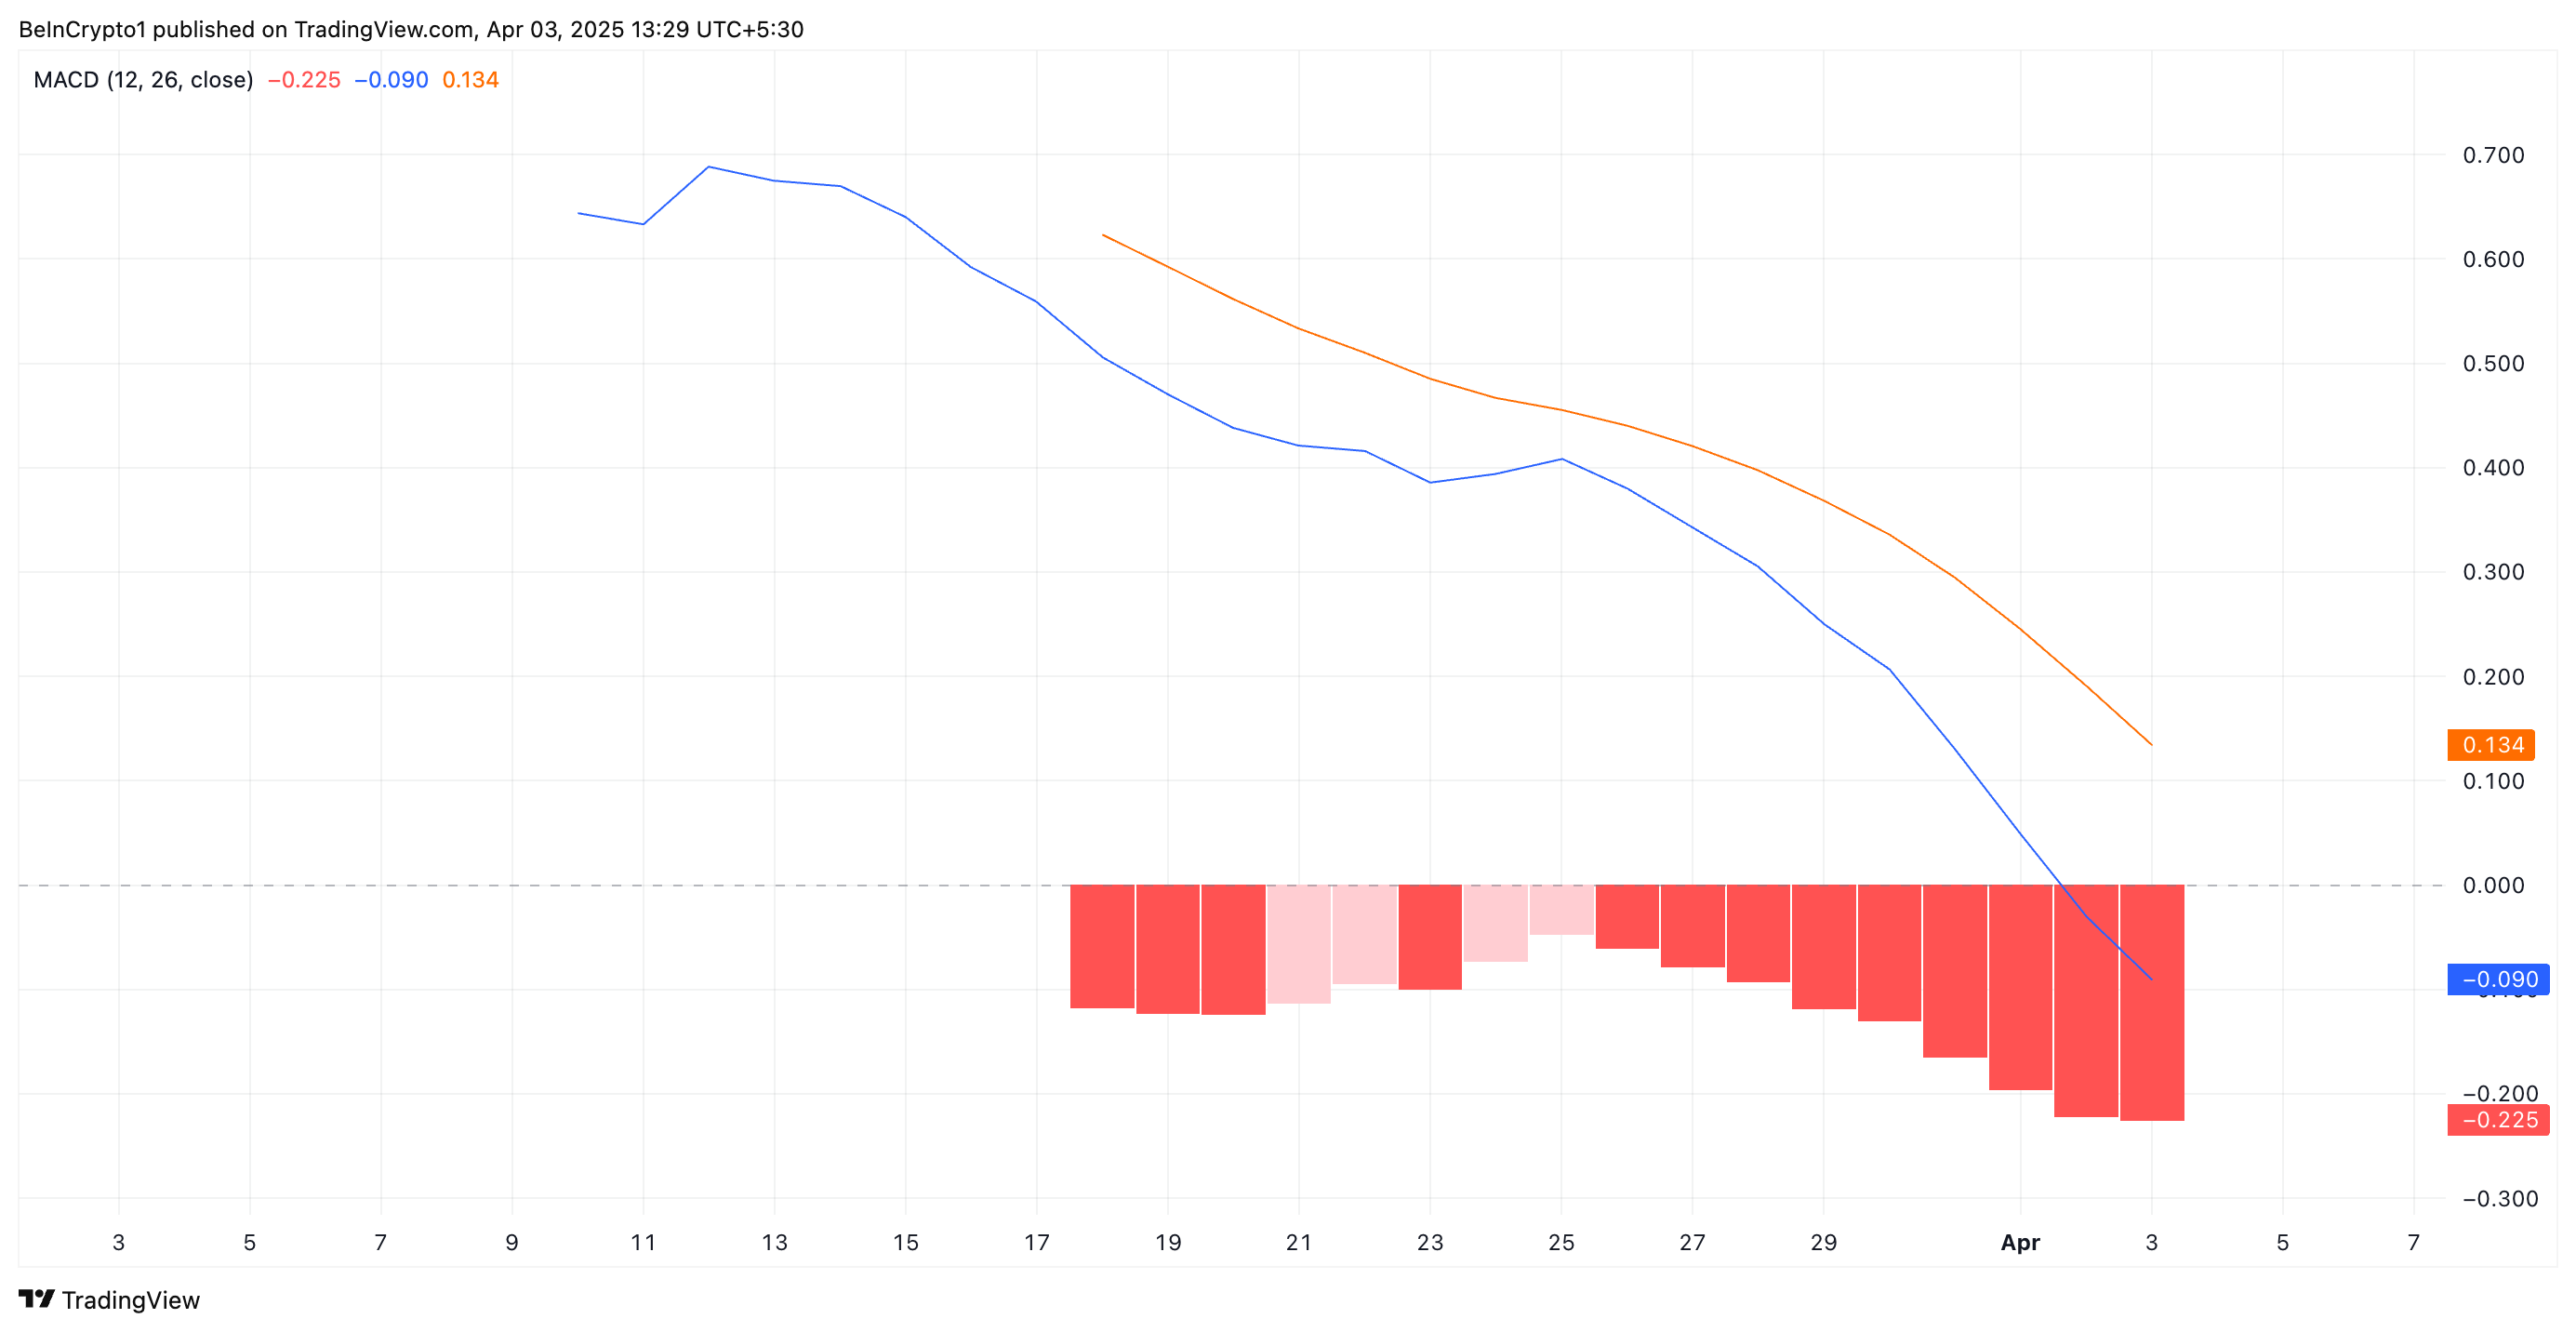
The MACD indicator measures an asset’s trend direction and momentum by comparing two moving averages of an asset’s price. When the MACD line is below the signal line, it indicates bearish momentum, suggesting a potential downtrend or continued selling pressure.
If this trend persists, IP’s recent 5% price surge may lose steam, increasing the likelihood of a short-term correction.
IP’s Bearish Structure Remains Intact – How Low Can It Go?
On the daily chart, IP has traded within a descending parallel channel since March 25. This bearish pattern emerges when an asset’s price moves within two downward-sloping parallel trendlines, indicating a consistent pattern of lower highs and lower lows.
This pattern confirm’s IP prevailing downtrend, suggesting continued bearish pressure unless a breakout above resistance occurs.
If the downtrend strengthens, IP’s price could break below the lower trend line of the descending parallel channel and fall to $3.68.
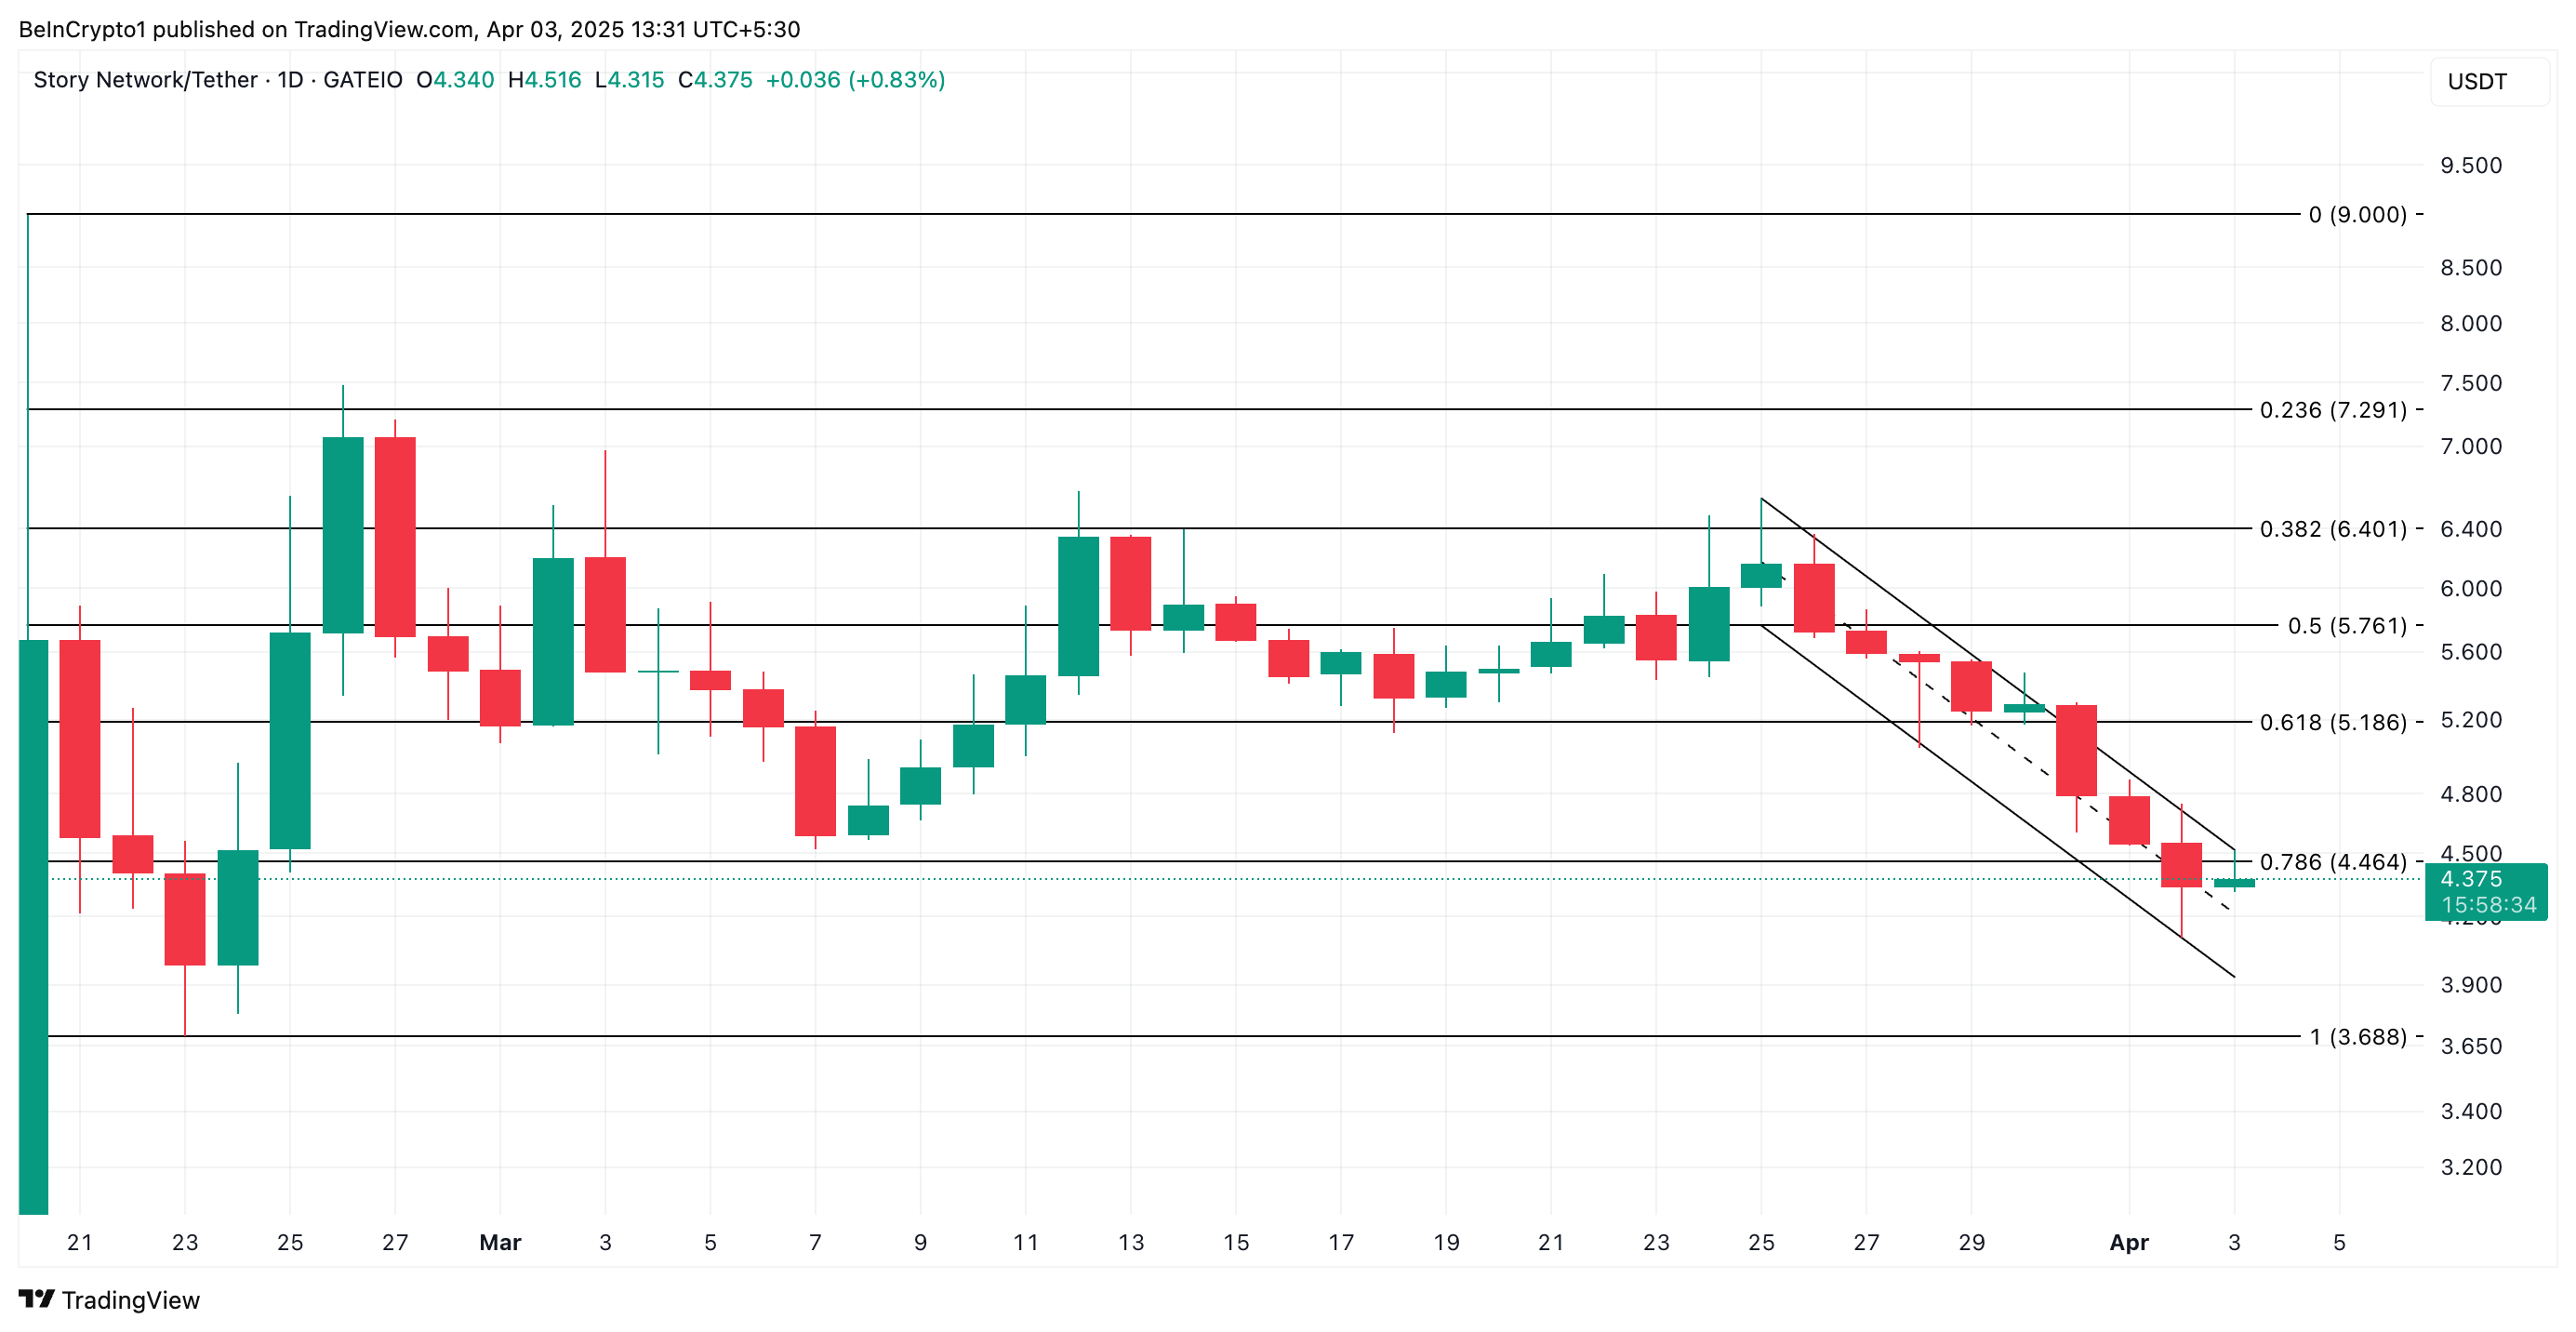
On the other hand, if the altcoin witnesses a spike in new demand, it could break above the bearish channel and rally toward $5.18.
Disclaimer
In line with the Trust Project guidelines, this price analysis article is for informational purposes only and should not be considered financial or investment advice. BeInCrypto is committed to accurate, unbiased reporting, but market conditions are subject to change without notice. Always conduct your own research and consult with a professional before making any financial decisions. Please note that our Terms and Conditions, Privacy Policy, and Disclaimers have been updated.

Pi Network recently celebrated a milestone with its first PiFest in the Open Network, showcasing impressive participation numbers.
However, despite the event’s success, the value of Pi Coin (PI) continues to plummet, sparking concerns among its community of Pioneers.
PiFest Fails to Bolster Pi Coin’s Value
Pi Network’s team announced the results of its first PiFest, a community-driven event designed to integrate PI into local commerce. According to the post, over 125,000 registered and 58,000 active sellers participated in the event. In addition, 1.8 million Pioneers utilized the Map of Pi app for transactions.
The event facilitated a wide range of purchases, from groceries and clothing to professional services like design and automotive repairs, showcasing PI’s growing utility in the real world.
“PiFest is more than a celebration—it exemplifies and demonstrates Pi’s real-world utility. With Open Network fully live, PiFest shows how Pi can support genuine commerce and empower local economies worldwide,” the blog read.
Despite these achievements, the event failed to bolster PI’s market performance. According to data from CoinGecko, PI has fallen to the 31st position in the rankings. Currently, Pi Coin is trading 78.7% below its peak value. Meanwhile, it’s just 3.1% above its lowest recorded price.
As of press time, Pi Coin’s trading price was $0.6, a decline of 8.2% over the past day. Additionally, over the past 30 days, the token has experienced a significant drop of 64.5%.

This sharp downturn has fueled negative sentiment within the community.
“The comments are getting more and more negative from this accounts tweets. Finally looks like “some people” are waking up to this being a failure in terms of what promises were sold of what this would be, and obviously is not,” a user posted on X.
Meanwhile, users are increasingly considering converting their PI holdings to other assets amid the altcoin’s ongoing struggles to maintain its value. In fact, a Pioneer openly debated trading their PI for 1 Ethereum (ETH).
“Shortly after Pi launched, my holdings were worth around €7,000. I decided to hold onto them, expecting a potential Binance listing or a major announcement from the team—something that never happened. Now, my Pi is worth around €1,700, and I feel extremely disappointed,” a user wrote on Reddit.
The post sparked a heated discussion, with some users encouraging the trade, citing Ethereum’s more established market position. Despite this, many still continue to advocate for PI, believing in its long-term potential.
“Be patient. Trust the process. Believe in the Pi core team, developers, ecosystem and the community. Do not spread FUD. Hold your Pi. Never sell cheap. You will be rewarded big time in the future,” a Pioneer posted.
As the community grapples with the token’s underperformance, opinions remain divided. The outcome of this ongoing debate will likely depend on future developments and the Pi Network’s ability to regain investor confidence.
Disclaimer
In adherence to the Trust Project guidelines, BeInCrypto is committed to unbiased, transparent reporting. This news article aims to provide accurate, timely information. However, readers are advised to verify facts independently and consult with a professional before making any decisions based on this content. Please note that our Terms and Conditions, Privacy Policy, and Disclaimers have been updated.

The US House Financial Services Committee voted 32-17 to pass the Stablecoin Transparency and Accountability for a Better Ledger Economy (STABLE) Act of 2025, aimed at stablecoin regulation.
This legislative milestone comes amid growing activity in the stablecoin market. Competition is heating up as major traditional financial institutions prepare to enter the space.
STABLE Act Passes Committee Vote
Chairman French Hill and Representative Bryan Steil spearheaded the legislation (H.R. 2392). It seeks to establish a robust framework for stablecoin issuance, mandating 1:1 reserve backing, monthly audits, and AML requirements.
“This legislation is a foundational step toward securing the future of financial payments in the United States and solidifying the dollar’s continued dominance as a world reserve currency,” Representative Steil remarked.
The bill’s passage saw bipartisan support, with six Democrats voting in favor. Notably, this comes shortly after the US Senate Committee on Banking, Housing, and Urban Affairs greenlit the GENIUS Act. The bill passed in a bipartisan 18-6 vote.
“The bills await debate time on the floor and a vote in their respective chambers,” Journalist and Host of Crypto In America, Eleanor Terrett, noted.
According to Terrett, efforts are underway to align the two bills closely over the next few weeks. The aim is to address differences between the bills. Aligning them will make it easier to proceed without creating additional complications.
“If they can get them to be in relatively the same place on their own, it will avoid having to set up a so-called conference committee which is formed so members from both chambers can negotiate to create a final version of the bill everyone agrees on,” she added.
Stablecoin Competition Heats Up, but Are There Signs of a Purge?
The drive for legislation occurs alongside rising activity in the stablecoin market. Global players are joining the fray.
For instance, in Japan, Sumitomo Mitsui Banking Corporation (SMBC) and major entities have signed a Memorandum of Understanding (MoU). The MoU initiates joint discussions on the potential use of stablecoins for future commercialization.
“This Agreement will see SMBC, Fireblocks, Ava Labs, and TIS collaborate to develop a framework for stablecoin issuance and circulation, including exploring key technical, regulatory, and market infrastructure requirements both in Japan and further afield. This Joint Discussion will not only focus on pilot projects but will aim to concretely define use cases for ongoing business applications,” the notice read.
In addition, Bank of America’s CEO previously revealed plans to launch a stablecoin once proper regulation is in place. Notably, BeInCrypto reported last month that the Office of the Comptroller of the Currency (OCC) had granted national banks and federal savings associations permission to provide crypto custody and certain stablecoin services.
That’s not all. The state of Wyoming is set to launch its own stablecoin, WYST, in July. Fidelity has also announced similar plans. Moreover, President Trump-backed World Liberty Financial officially launched its USD1 stablecoin in late March. This highlights continued interest in stablecoin adoption across both private and public sectors.
Meanwhile, Ripple announced the integration of its Ripple USD (RLUSD) into Ripple Payments. Changpeng Zhao (CZ), former CEO of Binance, reacted to the development on X.
“Stablecoin war, I mean healthy competition, just getting started,” CZ said.
As competition intensifies, the stablecoin market is also facing growing pains. Despite new entrants gaining traction, some players face heightened scrutiny.
Justin Sun, founder of Tron (TRX), recently accused First Digital Trust of insolvency. Following Sun’s allegations, First Digital USD (FDUSD) temporarily depegged.
The market’s future may hinge on the survival of only the most compliant and resilient stablecoins. This leads to a potential “purge” where weaker players fail to meet the increasing regulatory and market demands.
Disclaimer
In adherence to the Trust Project guidelines, BeInCrypto is committed to unbiased, transparent reporting. This news article aims to provide accurate, timely information. However, readers are advised to verify facts independently and consult with a professional before making any decisions based on this content. Please note that our Terms and Conditions, Privacy Policy, and Disclaimers have been updated.

Movimiento millonario de Solana, SOLX es la mejor opción

IP Token Price Surges, but Weak Demand Hints at Reversal

What It Means for Bitcoin

Binance Issues Key Announcement On StakeStone TGE; Here’s All
PiFest Celebrates Success – But Pi Coin Value Keeps Falling

Bitcoin to $250K? Hayes Links Price Surge to Fed’s QE Move

2.52 Million Altcoins Are Ruining Crypto’s Future

Animoca Brands Valuation Tanks 75% In Two Years, Here’s Why

Crypto exchange BingX hacked for $43 million

Are The Big Players Losing Interest?

Hong Kong’s Securities Association Tips Authorities On Crypto Self-Regulation

Coinbase cbBTC Set to go Live on Solana
2.52 Million Altcoins Are Ruining Crypto’s Future
Animoca Brands Valuation Tanks 75% In Two Years, Here’s Why
Crypto exchange BingX hacked for $43 million
Are The Big Players Losing Interest?
Hong Kong’s Securities Association Tips Authorities On Crypto Self-Regulation
Coinbase cbBTC Set to go Live on Solana
-

 Regulation20 hours ago
Kraken Obtains Restricted Dealer Registration in Canada
-
 Altcoin16 hours ago
Here’s Why This Analyst Believes XRP Price Could Surge 44x
-

 Altcoin23 hours ago
Franklin Templeton Eyes Crypto ETP Launch In Europe After BlackRock & 21Shares
-

 Bitcoin22 hours ago
Lummis Confirms Treasury Probes Direct Buys
-
 Altcoin12 hours ago
First Digital Trust Denies Justin Sun’s Allegations, Claims Full Solvency
-
 Altcoin15 hours ago
How Will Elon Musk Leaving DOGE Impact Dogecoin Price?
-
 Altcoin13 hours ago
Will Cardano Price Bounce Back to $0.70 or Crash to $0.60?
-

 Ethereum14 hours ago
Why A Massive Drop To $1,400 Could Rock The Underperformer