
Market
Why Bitcoin Buy Signal Poses Risks

Amid the general market decline, 97,602 traders have liquidated in the past 24 hours, with the combined liquidation value reaching $274.73 million. The leading coin, Bitcoin (BTC), has extended its decline, slipping by 1%, while its trading volume plummeted by 20% during the same period.
Interestingly, a key on-chain metric has flashed a buy signal, suggesting an opportunity for BTC contrarian traders. However, caution is advised, as the market still faces potential downside risks.
Bitcoin Flashes Buy Signal
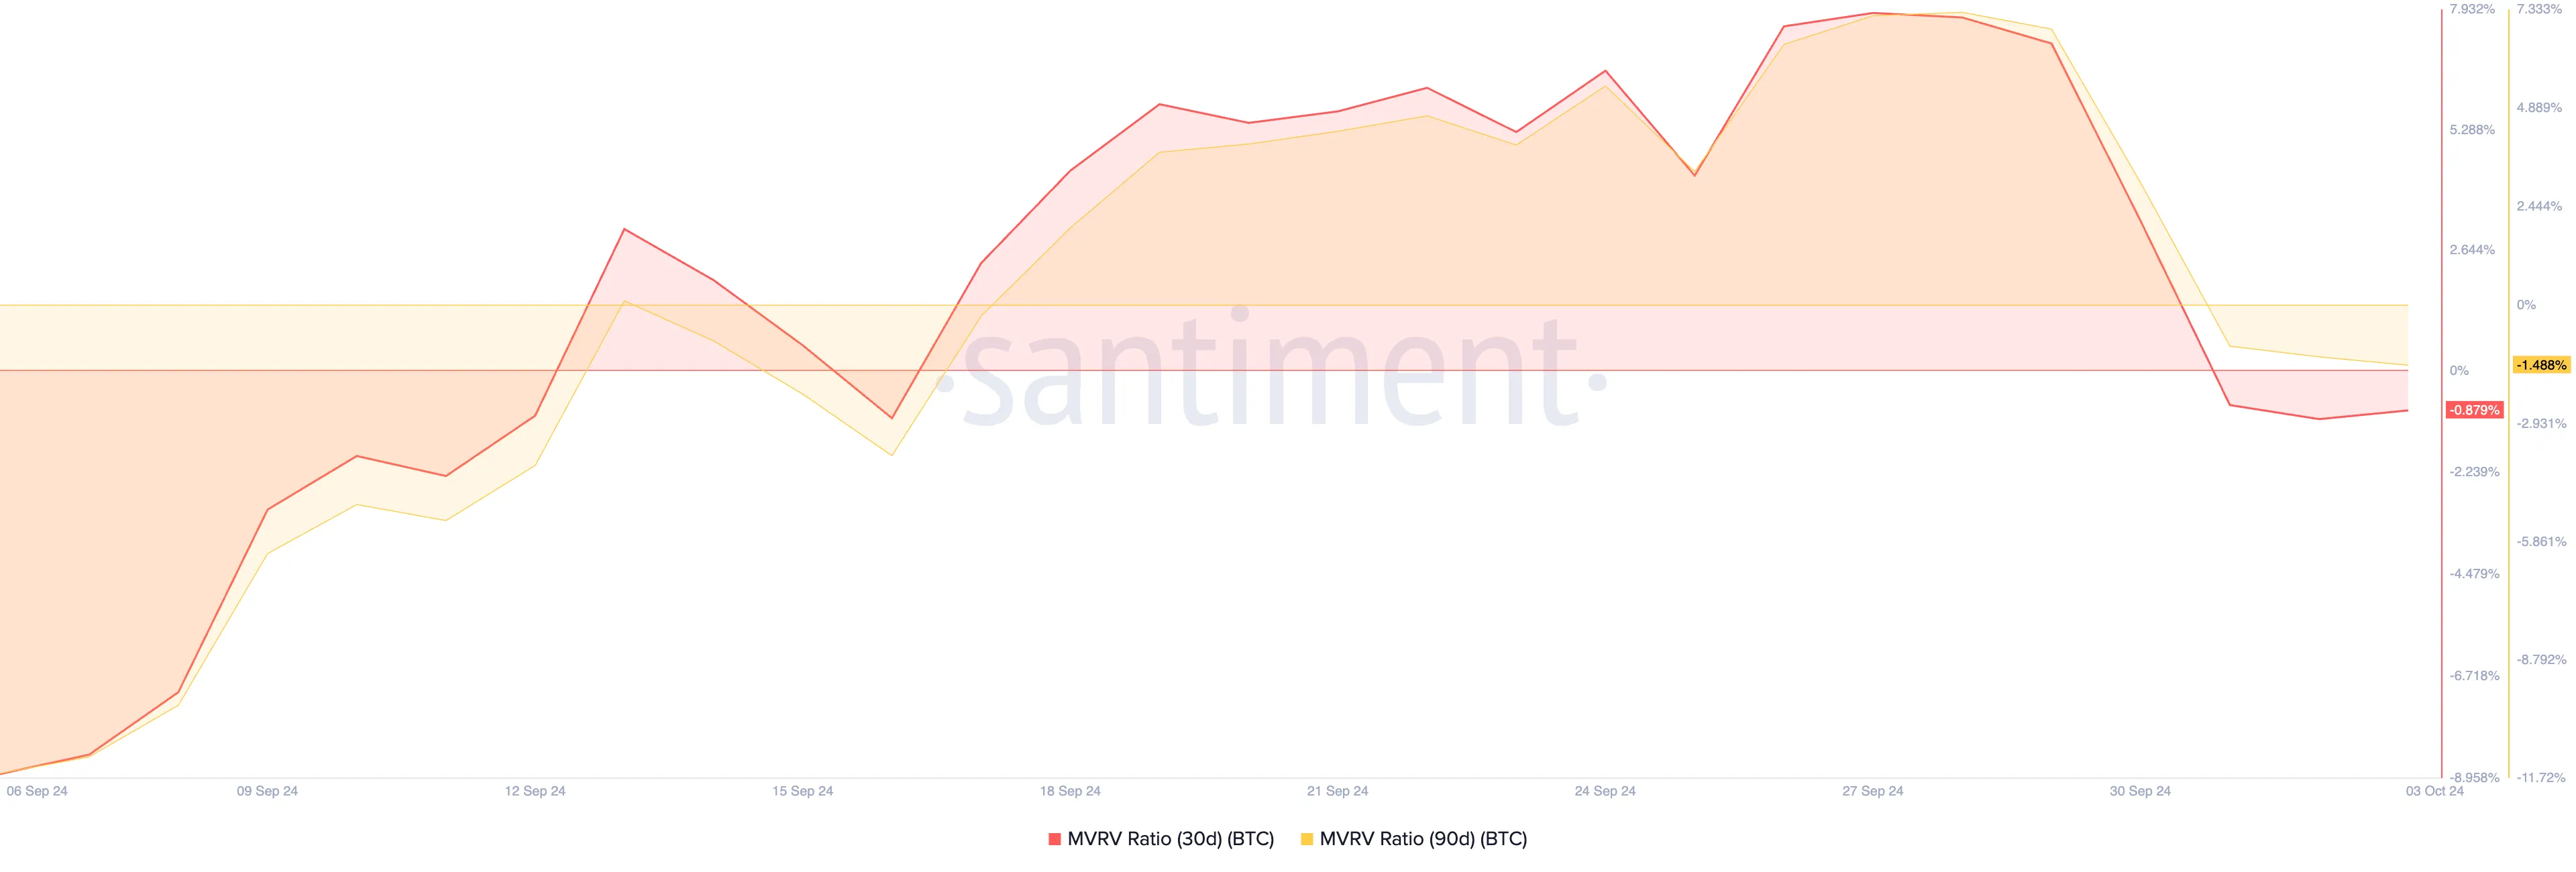
Bitcoin’s market value to realized value (MVRV) ratio, which measures the overall profitability of all its holders, is the on-chain metric of interest here. As of this writing, the coin’s 30-day and 90-day MVRV ratios are -0.89 and -1.48, respectively.
Generally, a negative MVRV indicates that the current market price is below the average price at which most investors acquired the asset. Therefore, if all holders were to sell their coins at the current market price, they would collectively realize a loss.
However, the metric also offers some respite. Historically, negative MVRV ratios represent a buying signal. They indicate that the market is oversold, and a potential buying opportunity could exist. A negative MVRV shows that the asset is being traded below its historical acquisition cost and may be due for a rebound.
Read more: Top 7 Platforms To Earn Bitcoin Sign-Up Bonuses in 2024
Some traders are already heeding the buy signal and have begun to accumulate the leading coin. Recently, there has been an unprecedented surge in new whale activity, marking levels of involvement never seen before.
“ Look at how fiercely the new whales are stacking Bitcoin; this market has never seen such accumulation,” Ki Young Ju, CryptoQuant’s founder, said in a post on X.
While this buy signal may encourage some traders to increase their BTC holdings, it’s important to note that the risk of further decline remains. The market’s buying pressure continues its downward trend, as reflected in BTC’s falling Relative Strength Index (RSI), which currently stands at 44.88.
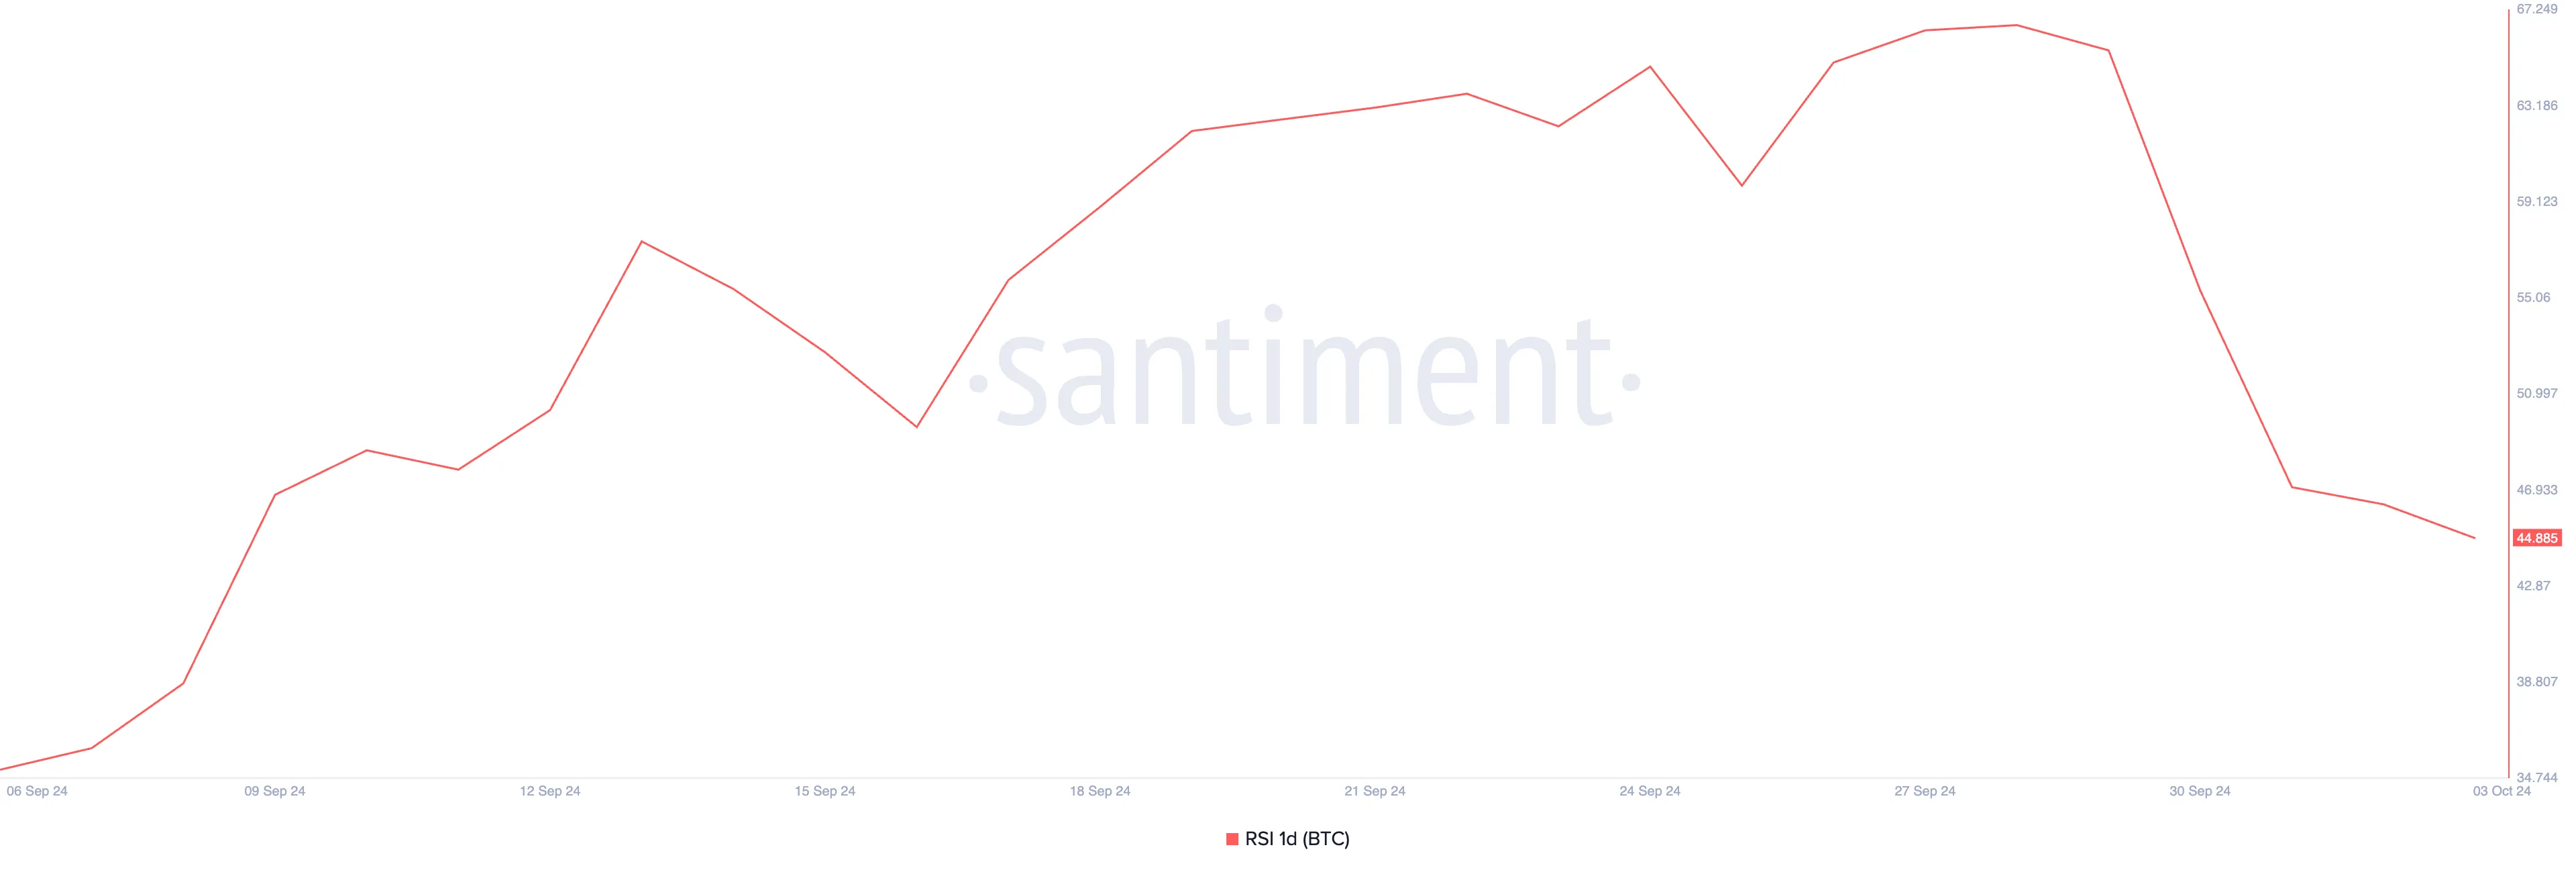
The RSI is a key indicator of overbought or oversold market conditions. At its current level of 44.88, selling activity outweighs buying pressure among BTC holders.
BTC Price Prediction: Key Support Levels to Hold
Should selling pressure intensify, Bitcoin could approach the critical support level at $58,518. A failure by bulls to defend this price may trigger a further drop, with the next support target at $54,899.
Read more: Bitcoin (BTC) Price Prediction 2024/2025/2030
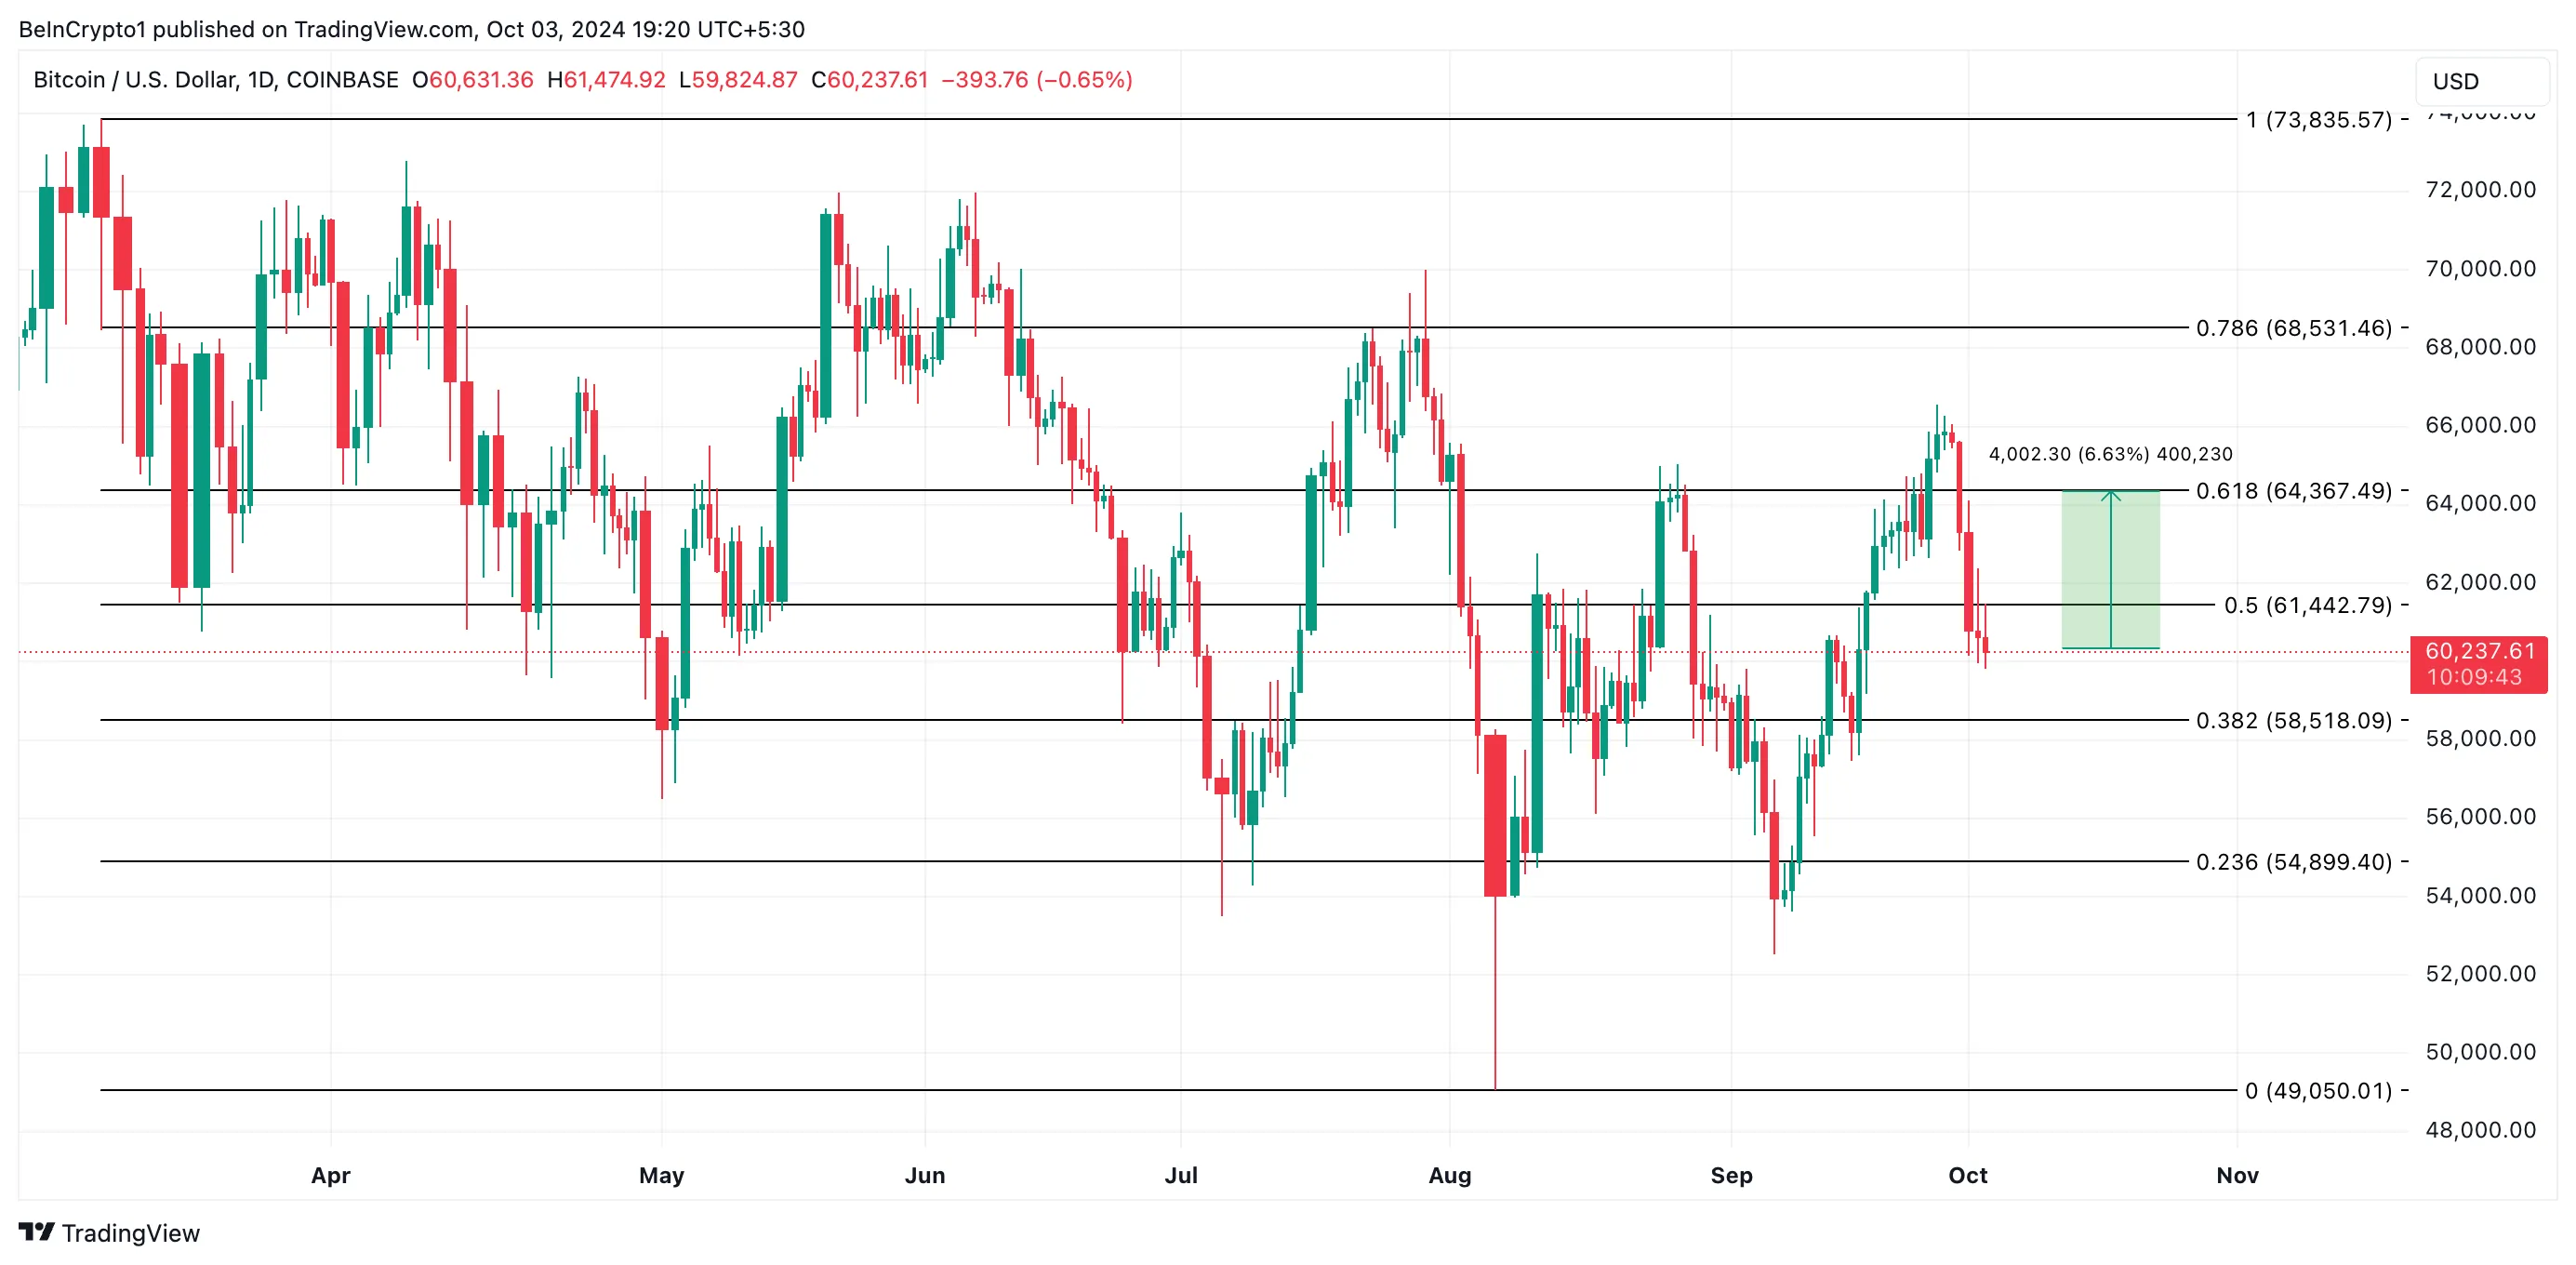
However, if market sentiment shifts from bearish to bullish, Bitcoin may reverse its trajectory, invalidating the bearish outlook. In this case, BTC could rally toward $64,367 in the near term.
Disclaimer
In line with the Trust Project guidelines, this price analysis article is for informational purposes only and should not be considered financial or investment advice. BeInCrypto is committed to accurate, unbiased reporting, but market conditions are subject to change without notice. Always conduct your own research and consult with a professional before making any financial decisions. Please note that our Terms and Conditions, Privacy Policy, and Disclaimers have been updated.


Ethereum (ETH) enters the week with mixed signals as traders brace for tomorrow’s “Liberation Day” tariff announcement, a potential macro catalyst that could impact risk assets. While the BBTrend indicator remains deeply negative, it’s beginning to ease, hinting at a possible slowdown in bearish momentum.
On-chain data shows a slight uptick in whale accumulation, suggesting cautious optimism from large holders. Meanwhile, Ethereum’s EMA setup shows early signs of a trend reversal, but the price still needs to break key resistance levels to confirm a shift in direction.
ETH BBTrend Is Easing, But Still Very Negative
Ethereum’s BBTrend indicator is currently reading -11.66, slightly improved from -12.54 the day before, but still in negative territory for the second consecutive day.
The Bollinger Band Trend (BBTrend) measures the strength and direction of a trend based on how price interacts with the upper and lower Bollinger Bands.
A positive BBTrend suggests bullish momentum, with the price expanding toward the upper band, while a negative BBTrend indicates bearish momentum, with the price leaning toward the lower band. Typically, a value beyond 10 is considered a strong trend signal, making the current -11.66 reading a sign of continued downside pressure.
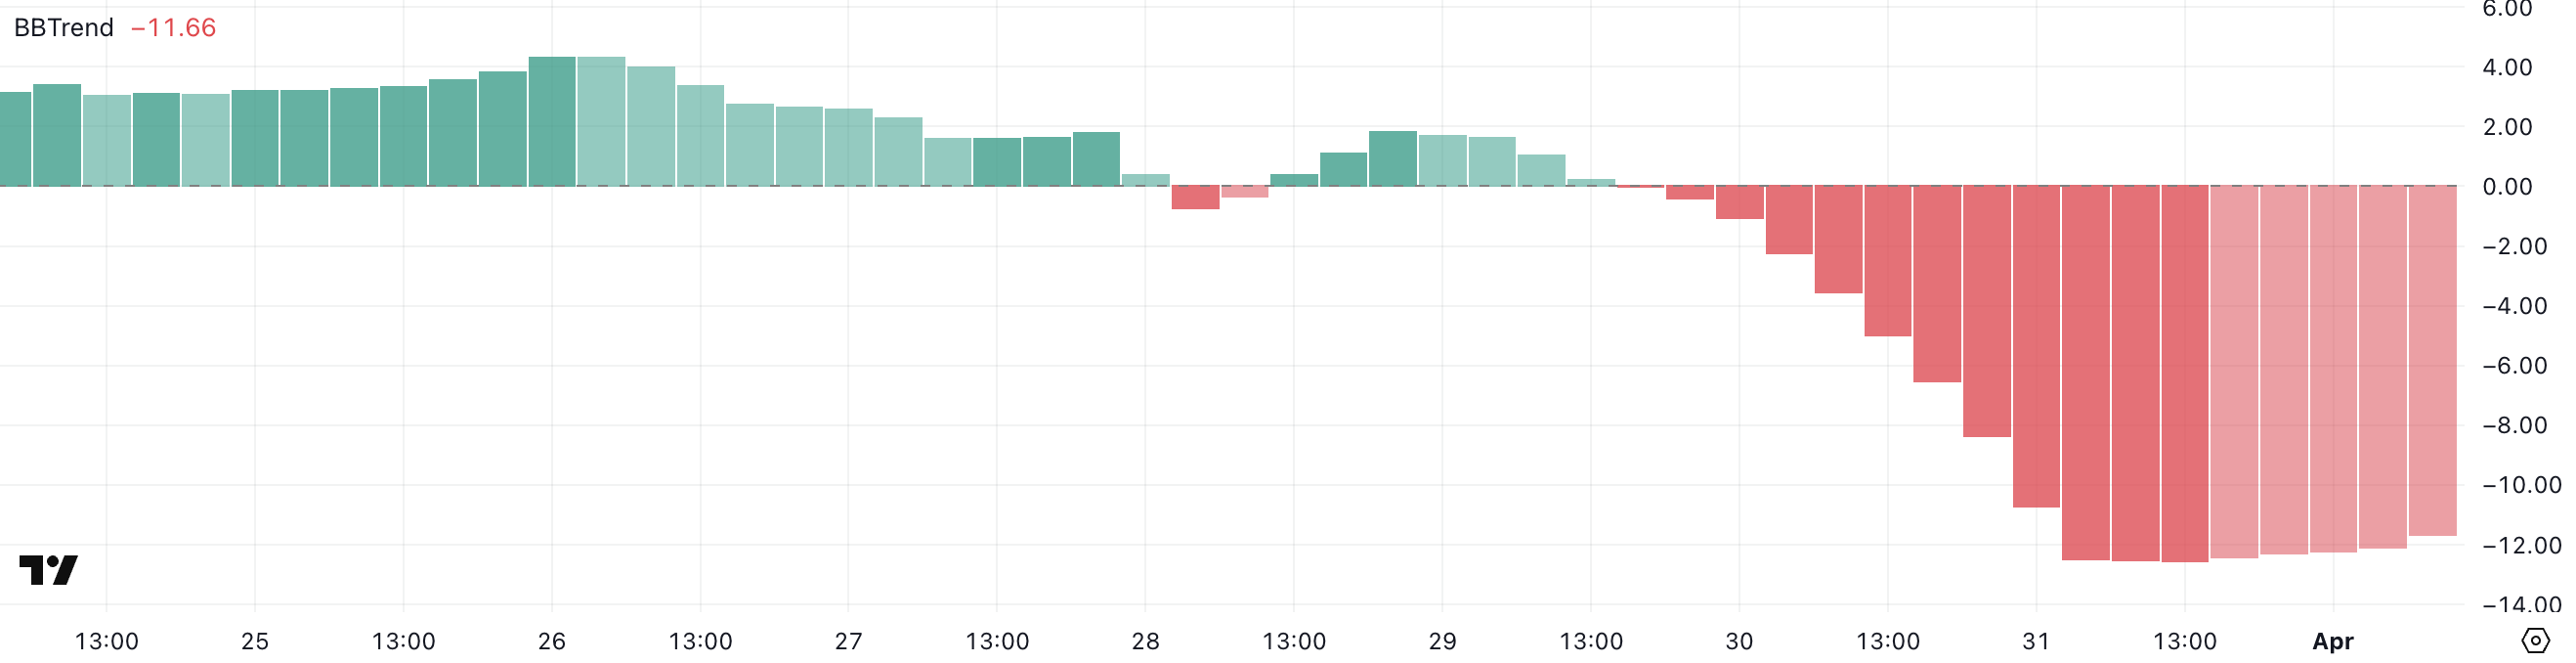
The persistent negative BBTrend suggests that Ethereum remains in a short-term bearish phase, with sellers still dominating the price action.
While yesterday’s slight uptick hints at a potential slowing of downward momentum, the indicator remains well below the neutral zone, meaning any reversal is still unconfirmed, despite Ethereum flipping Solana in DEX trading volume for the first time in 6 months.
Traders may interpret this as a warning to stay cautious, especially if ETH continues hugging the lower Bollinger Band. For now, price action remains fragile, and any bounce will need to be supported by a decisive shift in volume and sentiment to signal a meaningful reversal.
Ethereum Whales Are Accumulating Again
The number of Ethereum whales—wallets holding between 1,000 and 10,000 ETH—has ticked up slightly, rising from 5,322 to 5,330 in the past 24 hours.
While this is a modest increase, whale activity remains one of the most closely watched on-chain metrics, as these large holders often influence market direction. Whales’ accumulation can signal growing confidence in Ethereum’s medium—to long-term prospects, especially during periods of price uncertainty or consolidation.
Conversely, a decline in whale addresses typically suggests weakening conviction or profit-taking.
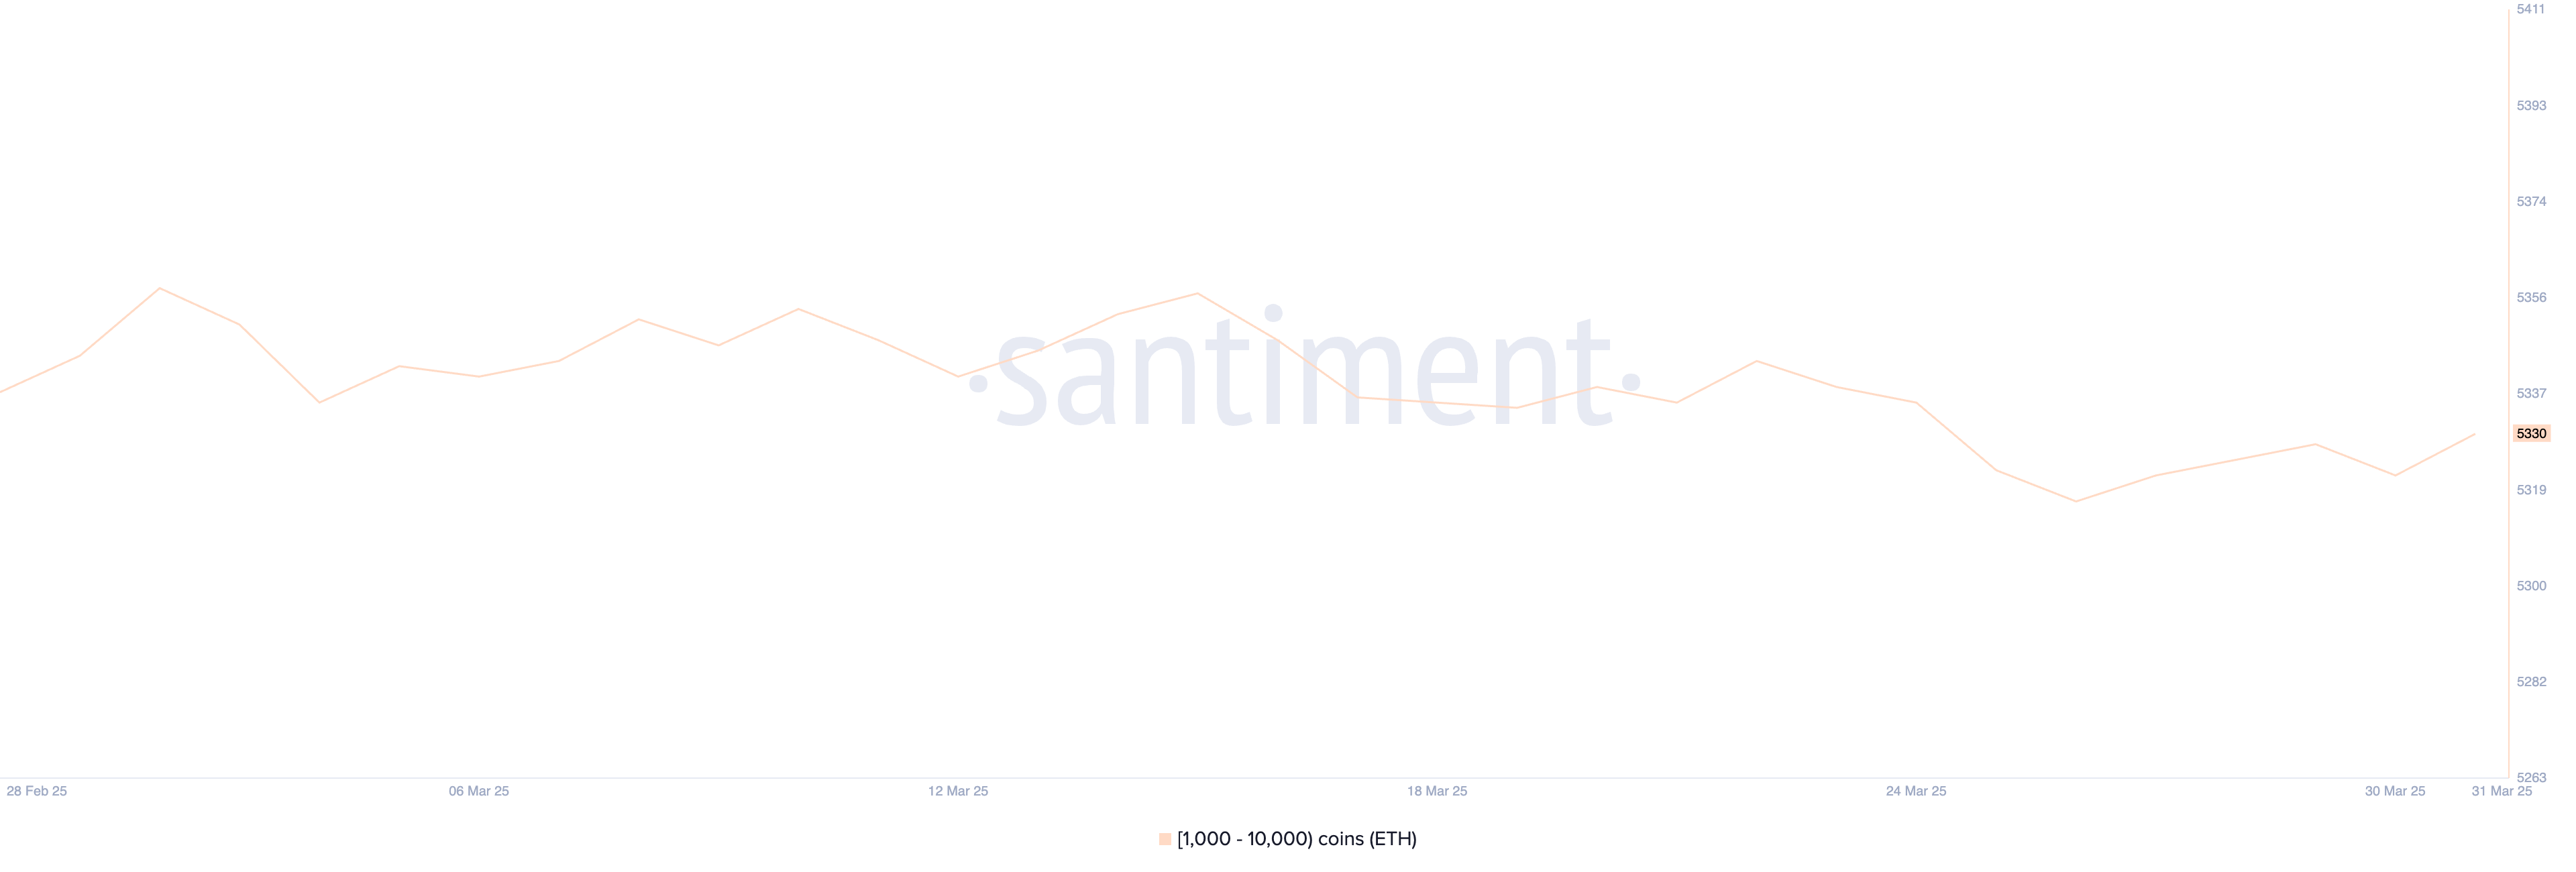
Although the recent uptick is a positive sign, it’s important to note that the current number of Ethereum whales is still below the levels observed in prior weeks.
This means that while some large holders may be re-entering the market, the broader whale cohort has yet to fully commit to an accumulation phase.
If the upward trend in whale numbers continues, it could support a bullish shift in sentiment and price. However, for now, the data points to cautious optimism rather than a decisive reversal.
Will Ethereum Break Above $2,100 Soon?
Ethereum’s EMA lines are showing early signs of a potential trend reversal, with price action attempting to break above key short-term averages.
If Ethereum price can push through the resistance at $1,938, it may signal the start of a broader recovery, potentially targeting the next resistance levels at $2,104, and if momentum builds—especially with supportive macro catalysts—increasing toward $2,320 and even $2,546.
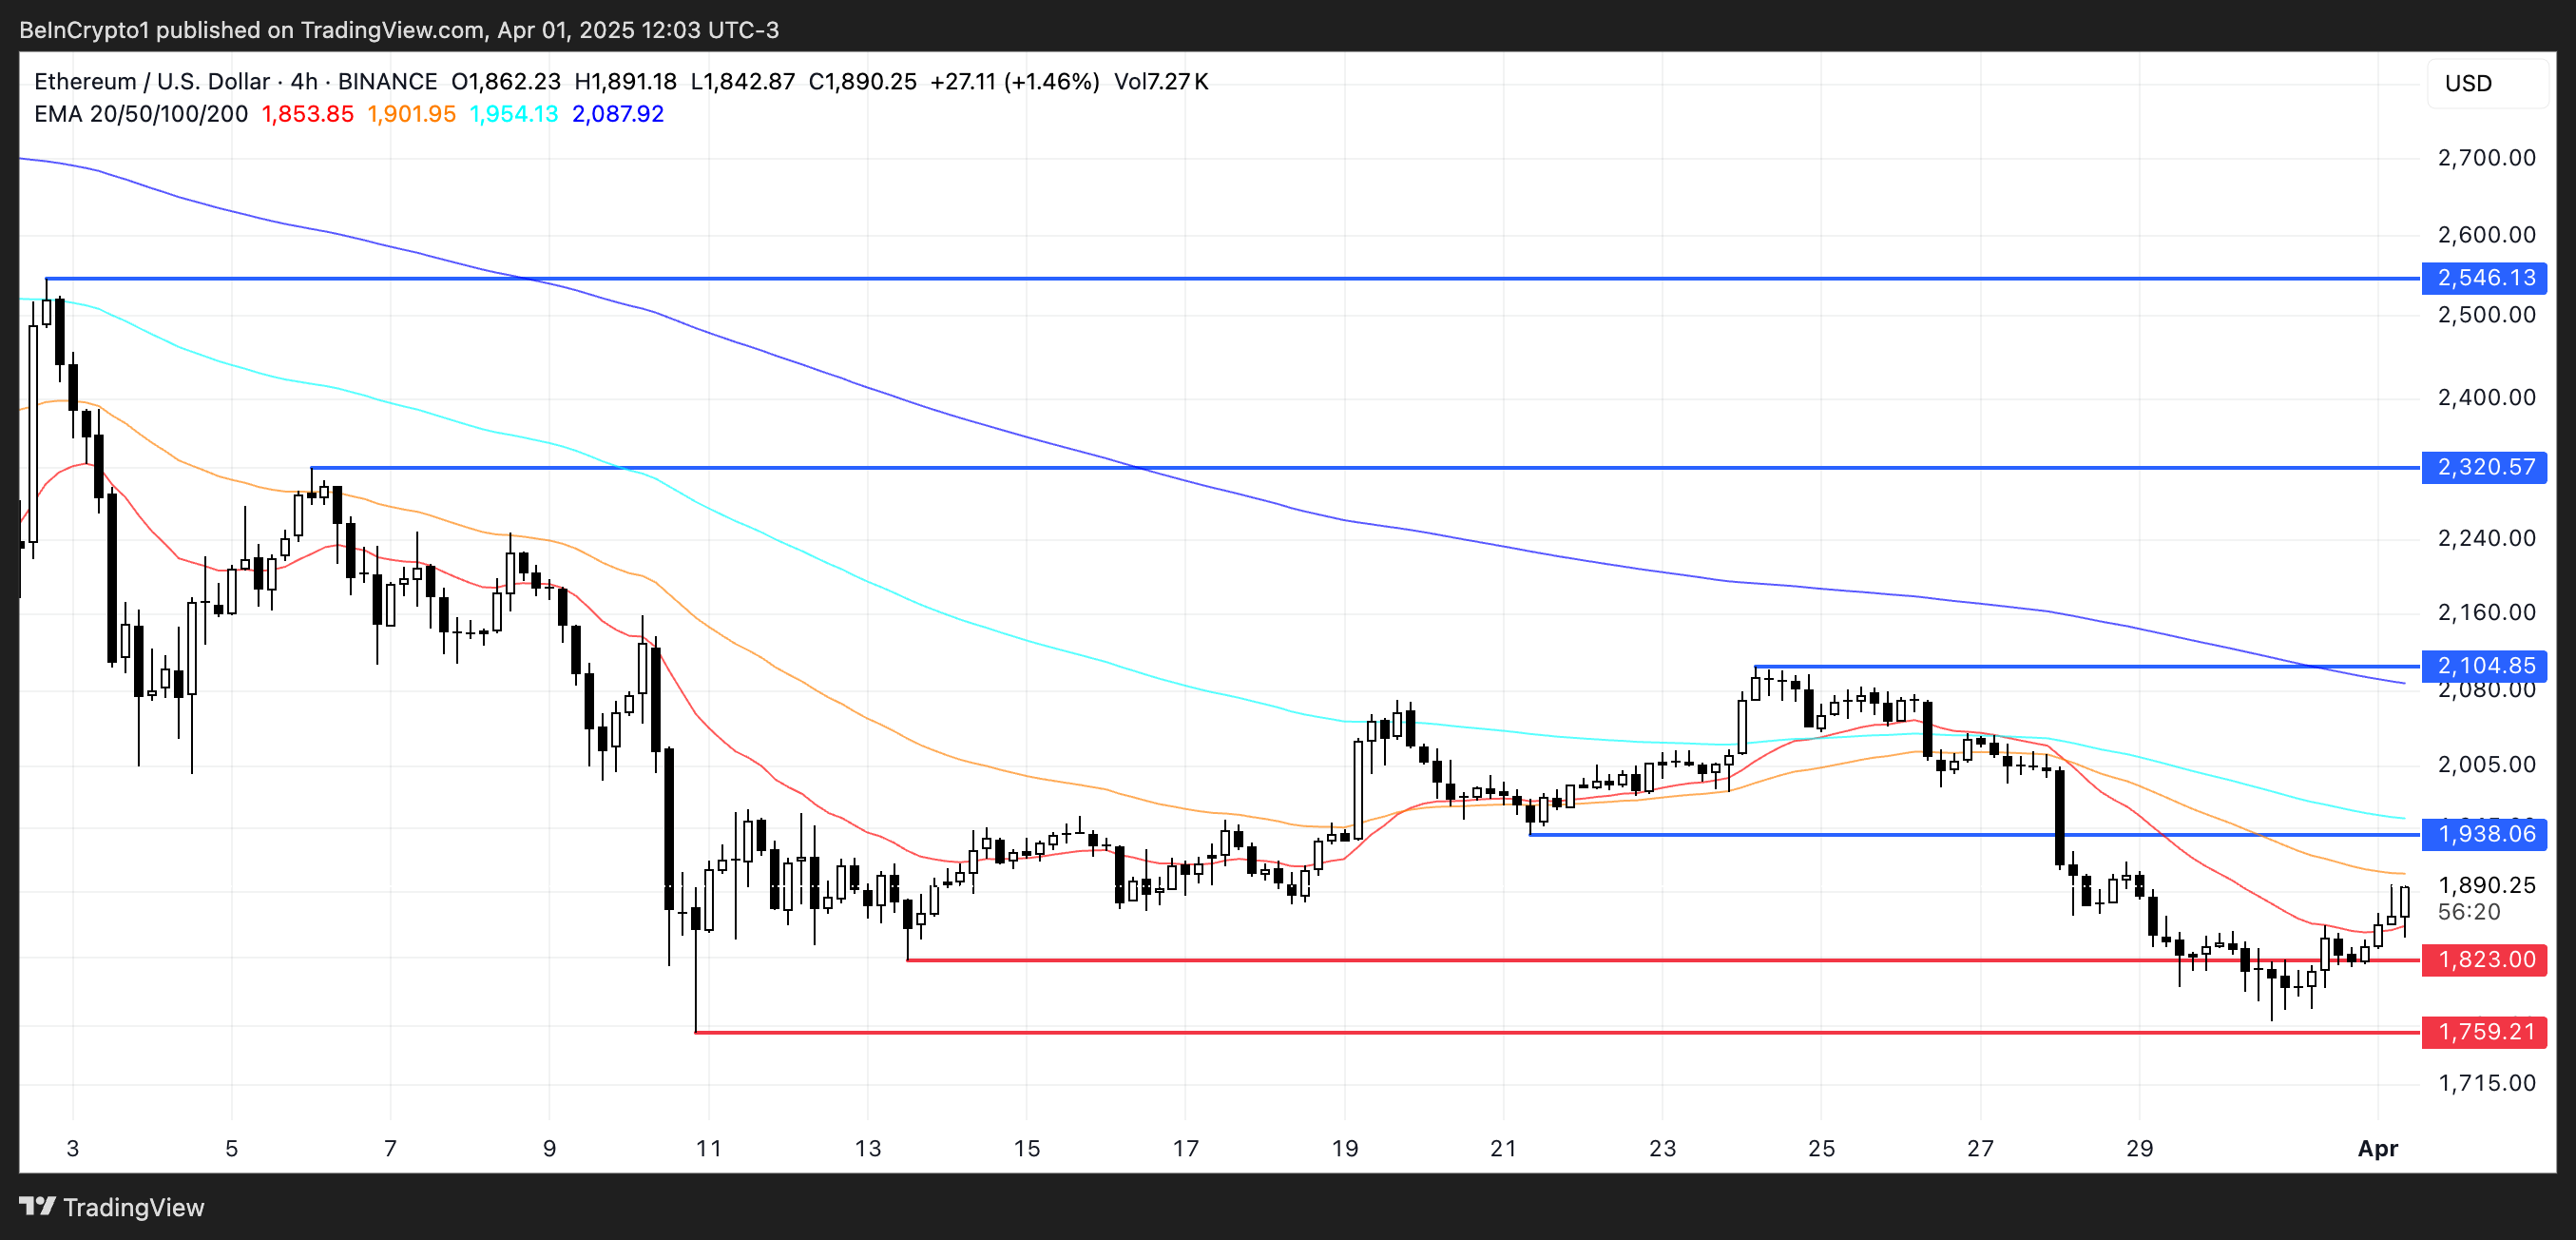
On the flip side, if Ethereum fails to maintain its upward push and bearish momentum resumes, the focus will shift back to downside levels.
The first key support sits at $1,823; a break below that could expose Ethereum to further losses toward $1,759.
Disclaimer
In line with the Trust Project guidelines, this price analysis article is for informational purposes only and should not be considered financial or investment advice. BeInCrypto is committed to accurate, unbiased reporting, but market conditions are subject to change without notice. Always conduct your own research and consult with a professional before making any financial decisions. Please note that our Terms and Conditions, Privacy Policy, and Disclaimers have been updated.

Binance Megadrop has announced its fourth project – KernelDAO (KERNEL), a restaking protocol supporting three key tokens Kernel, Kelp, and Gain.
Introduced in 2024, Binance Megadrop is a token launch platform that provides users with early access to promising crypto projects before their official listing.
KernelDAO and Binance Megadrop: Overview
KernelDAO is a restaking protocol that allows users to repurpose staked assets (such as ETH or BNB) to participate in other protocols, maximizing yield. The protocol launched its mainnet in December 2024.
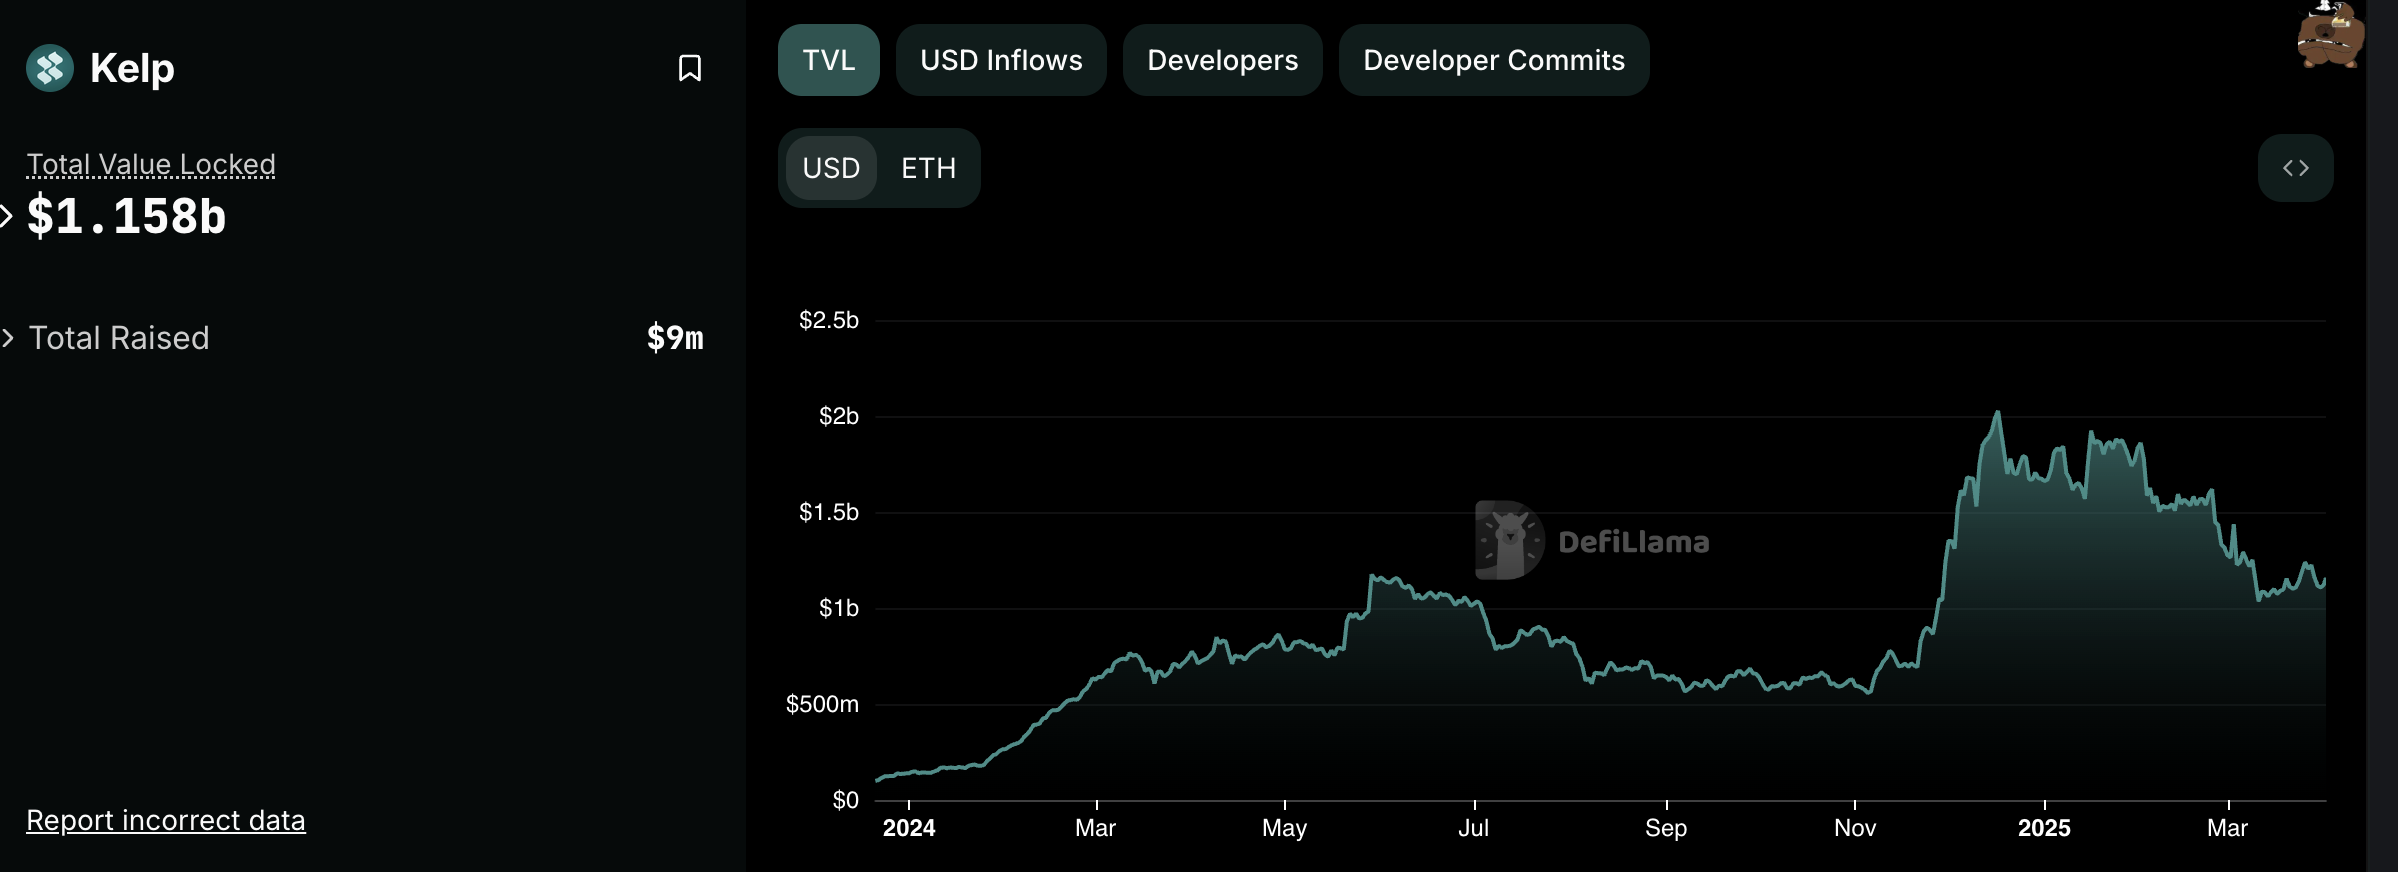
The KernelDAO Megadrop event kicks off on April 1, 2025, and lasts for 20 days, rewarding participants with KERNEL tokens. Kelp, a KernelDAO component, manages over $1.15 billion in Total Value Locked (TVL) across 10 blockchains, including Ethereum and BNB Chain.
KernelDAO has a maximum supply of 10 billion KERNEL tokens. Binance has allocated 40 million KERNEL (4% of the total supply) for participants. Upon listing on Binance, the initial circulating supply will be 162,317,496 KERNEL (16.23% of the total supply).
After the Megadrop event, KERNEL will be listed on Binance Spot with trading pairs such as KERNEL/BTC, KERNEL/USDT, and KERNEL/BNB.
KernelDAO is the fourth project on Binance Megadrop, following Lista (LISTA) and Xai (XAI). Previously, Binance Labs invested in Kernel to build recovery infrastructure on the BNB Chain.
Binance’s inclusion of KernelDAO could contribute to the growth of the restaking sector. According to DeFiLlama, the total TVL of restaking protocols surpassed $15 billion in early 2025, with EigenLayer and Kelp leading the market.
With 40 million KERNEL tokens distributed through Megadrop, many participants may sell immediately after receiving their tokens, potentially creating downward price pressure. Additionally, increasing competition from protocols like EigenLayer could pose challenges for KernelDAO.
Additionally, not all projects listed on Binance have performed impressively. In 2024, Binance-listed tokens all fell, with 29 out of 30 tokens posting significant losses.
Disclaimer
In adherence to the Trust Project guidelines, BeInCrypto is committed to unbiased, transparent reporting. This news article aims to provide accurate, timely information. However, readers are advised to verify facts independently and consult with a professional before making any decisions based on this content. Please note that our Terms and Conditions, Privacy Policy, and Disclaimers have been updated.

Market maker Wintermute sold off huge quantities of ACT and other BNB meme coins on April 1, tanking their prices by as much as 50%. Wintermute CEO denied intentionally selling these assets and started re-buying them.
Community sleuths believe that Binance is to blame, quietly lowering the leverage position limit for ACT and other tokens. This incident may cause further mistrust and uncertainty in a shaky meme coin market.
Why Did Wintermute Sell ACT?
A chaotic incident is currently unfolding in the meme coin sector. At the center of the story is Wintermute, a market maker that recently made headlines by interacting with World Liberty’s USD1 stablecoin before the official announcement.
Today, Wintermute has sold off large quantities of BNB meme coins, especially ACT.
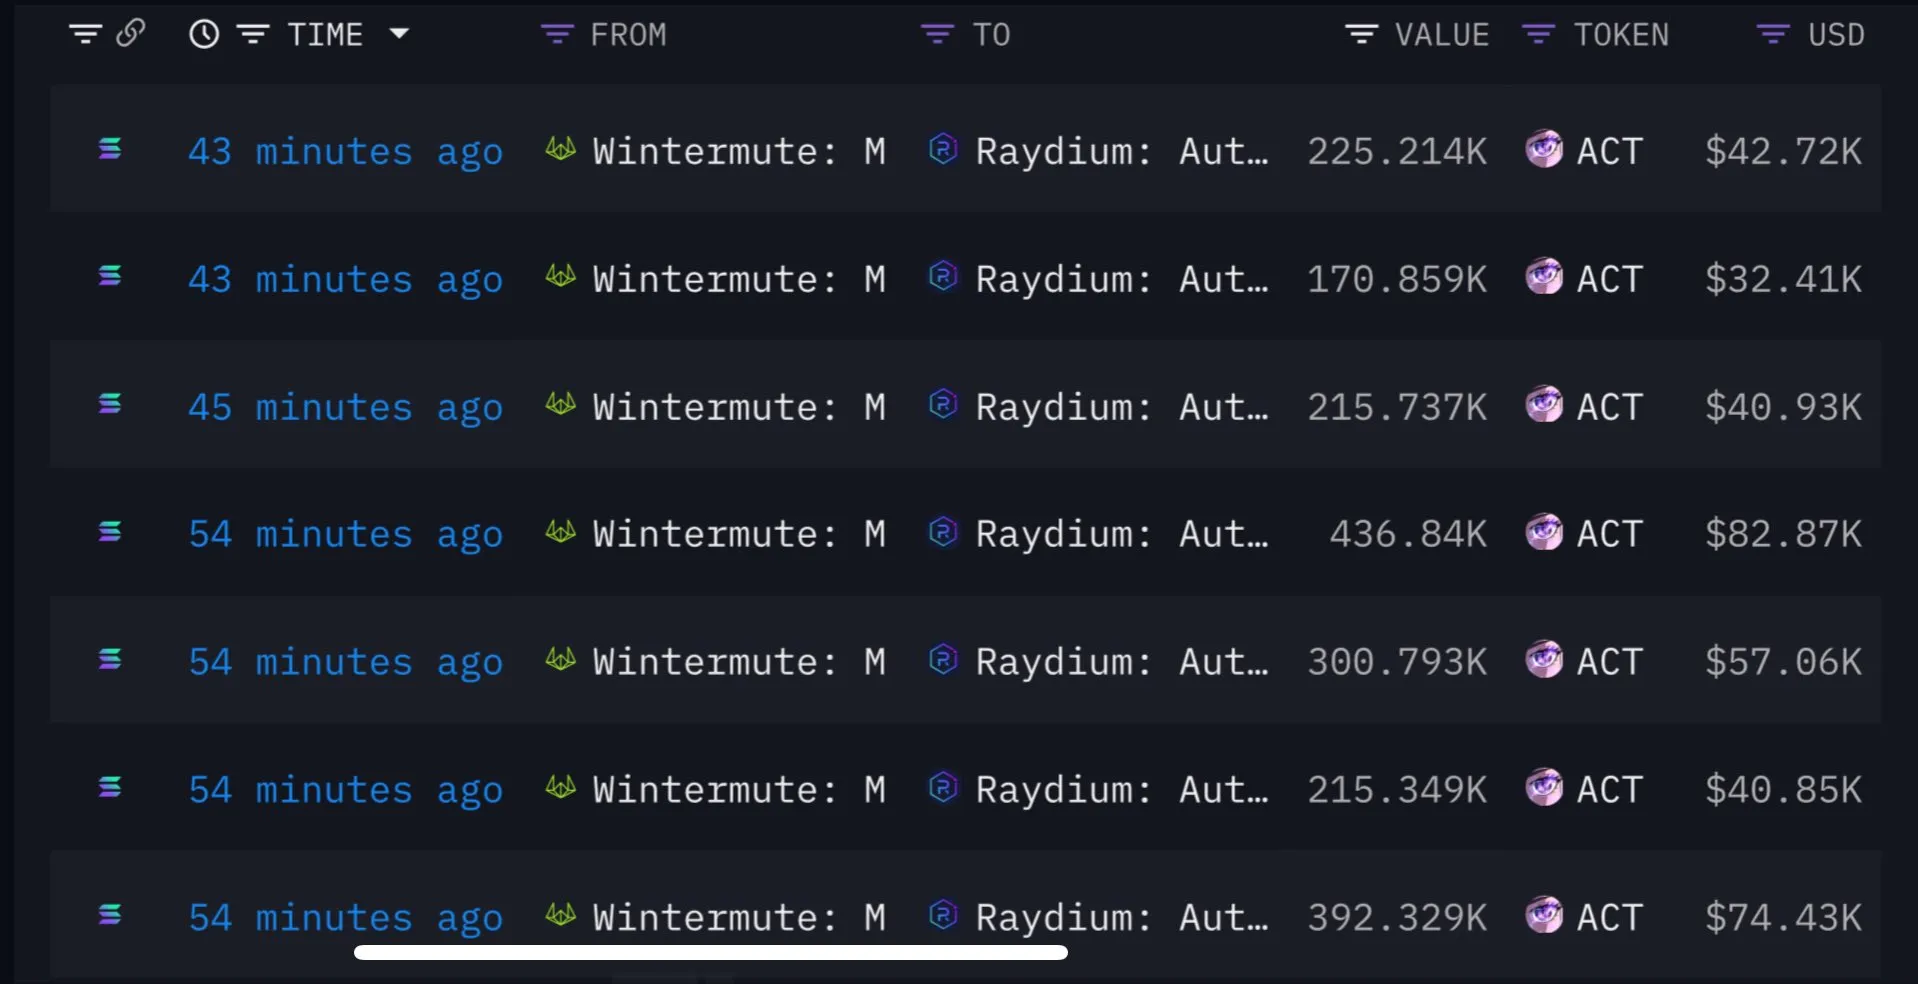
After Wintermute’s massive sell-off, the price of ACT subsequently fell 50%. This caused a stampede in other BNB meme coins, erasing millions of dollars and generating a lot of market chaos.
However, in a strange development, Wintermute’s CEO Evgeny Gaevoy denied deliberately causing the sale.
“Not us, for what it’s worth! [I’m] also curious about that postmortem. If I were to guess, we reacted post move, arbitraged the Automated Market Maker (AMM) Pool,” Gaevoy claimed in a social media thread.
This raised more questions than it answered. If Wintermute didn’t intend to sell off these ACT tokens and other meme coins, what triggered them? The firm even began buying ACT again after the sale. Subsequently, crypto sleuths started suspecting a quiet rule change from Binance, the world’s largest crypto exchange.
Both data from Lookonchain and analysis from 0xwizard, an important community leader for ACT, alleged that Binance was involved in the Wintermute debacle. Specifically, they claimed that the exchange quietly lowered the leverage position limit for ACT. This meant that market makers who held more positions than this limit were automatically liquidated at market price.
Naturally, these allegations caused a lot of outrage. Yi He, co-founder of Binance, responded, claiming that the relevant team is “collecting details and preparing a reply.” She further said that there might be another player involved but didn’t elaborate on this. This is not her first time responding to major criticism about Binance’s meme coin policies.
Ultimately, the dust is far from settled on this issue. Most of the impacted tokens are still substantially down from their positions yesterday, which is unfortunate in this fearful market. Between HyperLiquid’s short squeeze last week and this incident with Wintermute and ACT, overreach from crypto exchanges could damage market confidence.
Disclaimer
In adherence to the Trust Project guidelines, BeInCrypto is committed to unbiased, transparent reporting. This news article aims to provide accurate, timely information. However, readers are advised to verify facts independently and consult with a professional before making any decisions based on this content. Please note that our Terms and Conditions, Privacy Policy, and Disclaimers have been updated.

Ethereum Struggles to Break Out as Bear Trend Fades

XRP Price to $27? Expert Predicts Exact Timeline for the Next Massive Surge

Binance Megadrop Launches KernelDAO
Wintermute Sells ACT Tokens Due To Binance Limit Changes

Ethereum Founder Buterin Funds Swiss Project With 274 ETH—What’s The Agenda?

Binance Update Sparks 50% Decline For Solana Meme Coin ACT: Details

2.52 Million Altcoins Are Ruining Crypto’s Future

Animoca Brands Valuation Tanks 75% In Two Years, Here’s Why

Crypto exchange BingX hacked for $43 million

Are The Big Players Losing Interest?

Hong Kong’s Securities Association Tips Authorities On Crypto Self-Regulation

Coinbase cbBTC Set to go Live on Solana
2.52 Million Altcoins Are Ruining Crypto’s Future
Animoca Brands Valuation Tanks 75% In Two Years, Here’s Why
Crypto exchange BingX hacked for $43 million
Are The Big Players Losing Interest?
Hong Kong’s Securities Association Tips Authorities On Crypto Self-Regulation
Coinbase cbBTC Set to go Live on Solana
-
 Altcoin24 hours ago
Elon Musk Rules Out The Use Of Dogecoin By The US Government
-

 Ethereum23 hours ago
Ethereum May Have To Undo This Death Cross For Bull’s Return
-

 Market22 hours ago
BlackRock’s Larry Fink Thinks Crypto Could Harm The Dollar
-

 Market21 hours ago
Coinbase Tries to Resume Lawsuit Against the FDIC
-
 Altcoin21 hours ago
Charles Hoskinson Reveals How Cardano Will Boost Bitcoin’s Adoption
-

 Market20 hours ago
Hedera (HBAR) Bears Dominate, HBAR Eyes Key $0.15 Level
-

 Market19 hours ago
This is Why PumpSwap Brings Pump.fun To the Next Level
-

 Market18 hours ago
Cardano (ADA) Whales Hit 2-Year Low as Key Support Retested