
Market
Is the Bullish Momentum Fading?

Ethereum price extended its decline below the $2,450 level. ETH is now consolidating and might struggle to recover above the $2,425 level.
- Ethereum declined further and traded below the $2,400 zone.
- The price is trading below $2,420 and the 100-hourly Simple Moving Average.
- There is a connecting bearish trend line forming with resistance at $2,425 on the hourly chart of ETH/USD (data feed via Kraken).
- The pair must stay above the $2,350 support to start a fresh increase in the near term.
Ethereum Price Holds Support
Ethereum price remained in a bearish zone and extended losses below the $2,550 level. ETH traded below the $2,450 support to enter a bearish zone like Bitcoin. There was also a move below the $2,400 level.
A low was formed near $2,352 and the price is now consolidating losses. There was a minor increase above the $2,365 level. The price is still below the 23.6% Fib retracement level of the downward move from the $2,655 swing high to the $2,352 low.
Ethereum price is now trading below $2,420 and the 100-hourly Simple Moving Average. On the upside, the price seems to be facing hurdles near the $2,420 level. There is also a connecting bearish trend line forming with resistance at $2,425 on the hourly chart of ETH/USD.
The first major resistance is near the $2,500 level or the 50% Fib retracement level of the downward move from the $2,655 swing high to the $2,352 low. The next key resistance is near $2,535.

An upside break above the $2,535 resistance might call for more gains in the coming sessions. In the stated case, Ether could rise toward the $2,650 resistance zone in the near term. The next hurdle sits near the $2,680 level or $2,665.
More Losses In ETH?
If Ethereum fails to clear the $2,420 resistance, it could continue to move down. Initial support on the downside is near the $2,350 level. The first major support sits near the $2,320 zone.
A clear move below the $2,320 support might push the price toward $2,250. Any more losses might send the price toward the $2,150 support level in the near term. The next key support sits at $2,120.
Technical Indicators
Hourly MACD – The MACD for ETH/USD is gaining momentum in the bearish zone.
Hourly RSI – The RSI for ETH/USD is now below the 50 zone.
Major Support Level – $2,350
Major Resistance Level – $2,420


Solana (SOL) is under heavy pressure, with its price down more than 10% in the last 24 hours as bearish momentum intensifies across key indicators. The Ichimoku Cloud, BBTrend, and price structure all point to continued downside risk, with SOL now hovering dangerously close to critical support levels.
Technical signals show sellers firmly in control, while the widening gap from resistance zones makes a near-term recovery increasingly difficult.
Solana’s Ichimoku Cloud chart is currently flashing strong bearish signals. The price has sharply broken below both the Tenkan-sen (blue line) and Kijun-sen (red line), confirming a clear rejection of short-term support levels.
Both of these lines are now angled downward, reinforcing the view that bearish momentum is gaining strength.
The sharp distance between the latest candles and the cloud further suggests that any recovery would face significant resistance ahead.
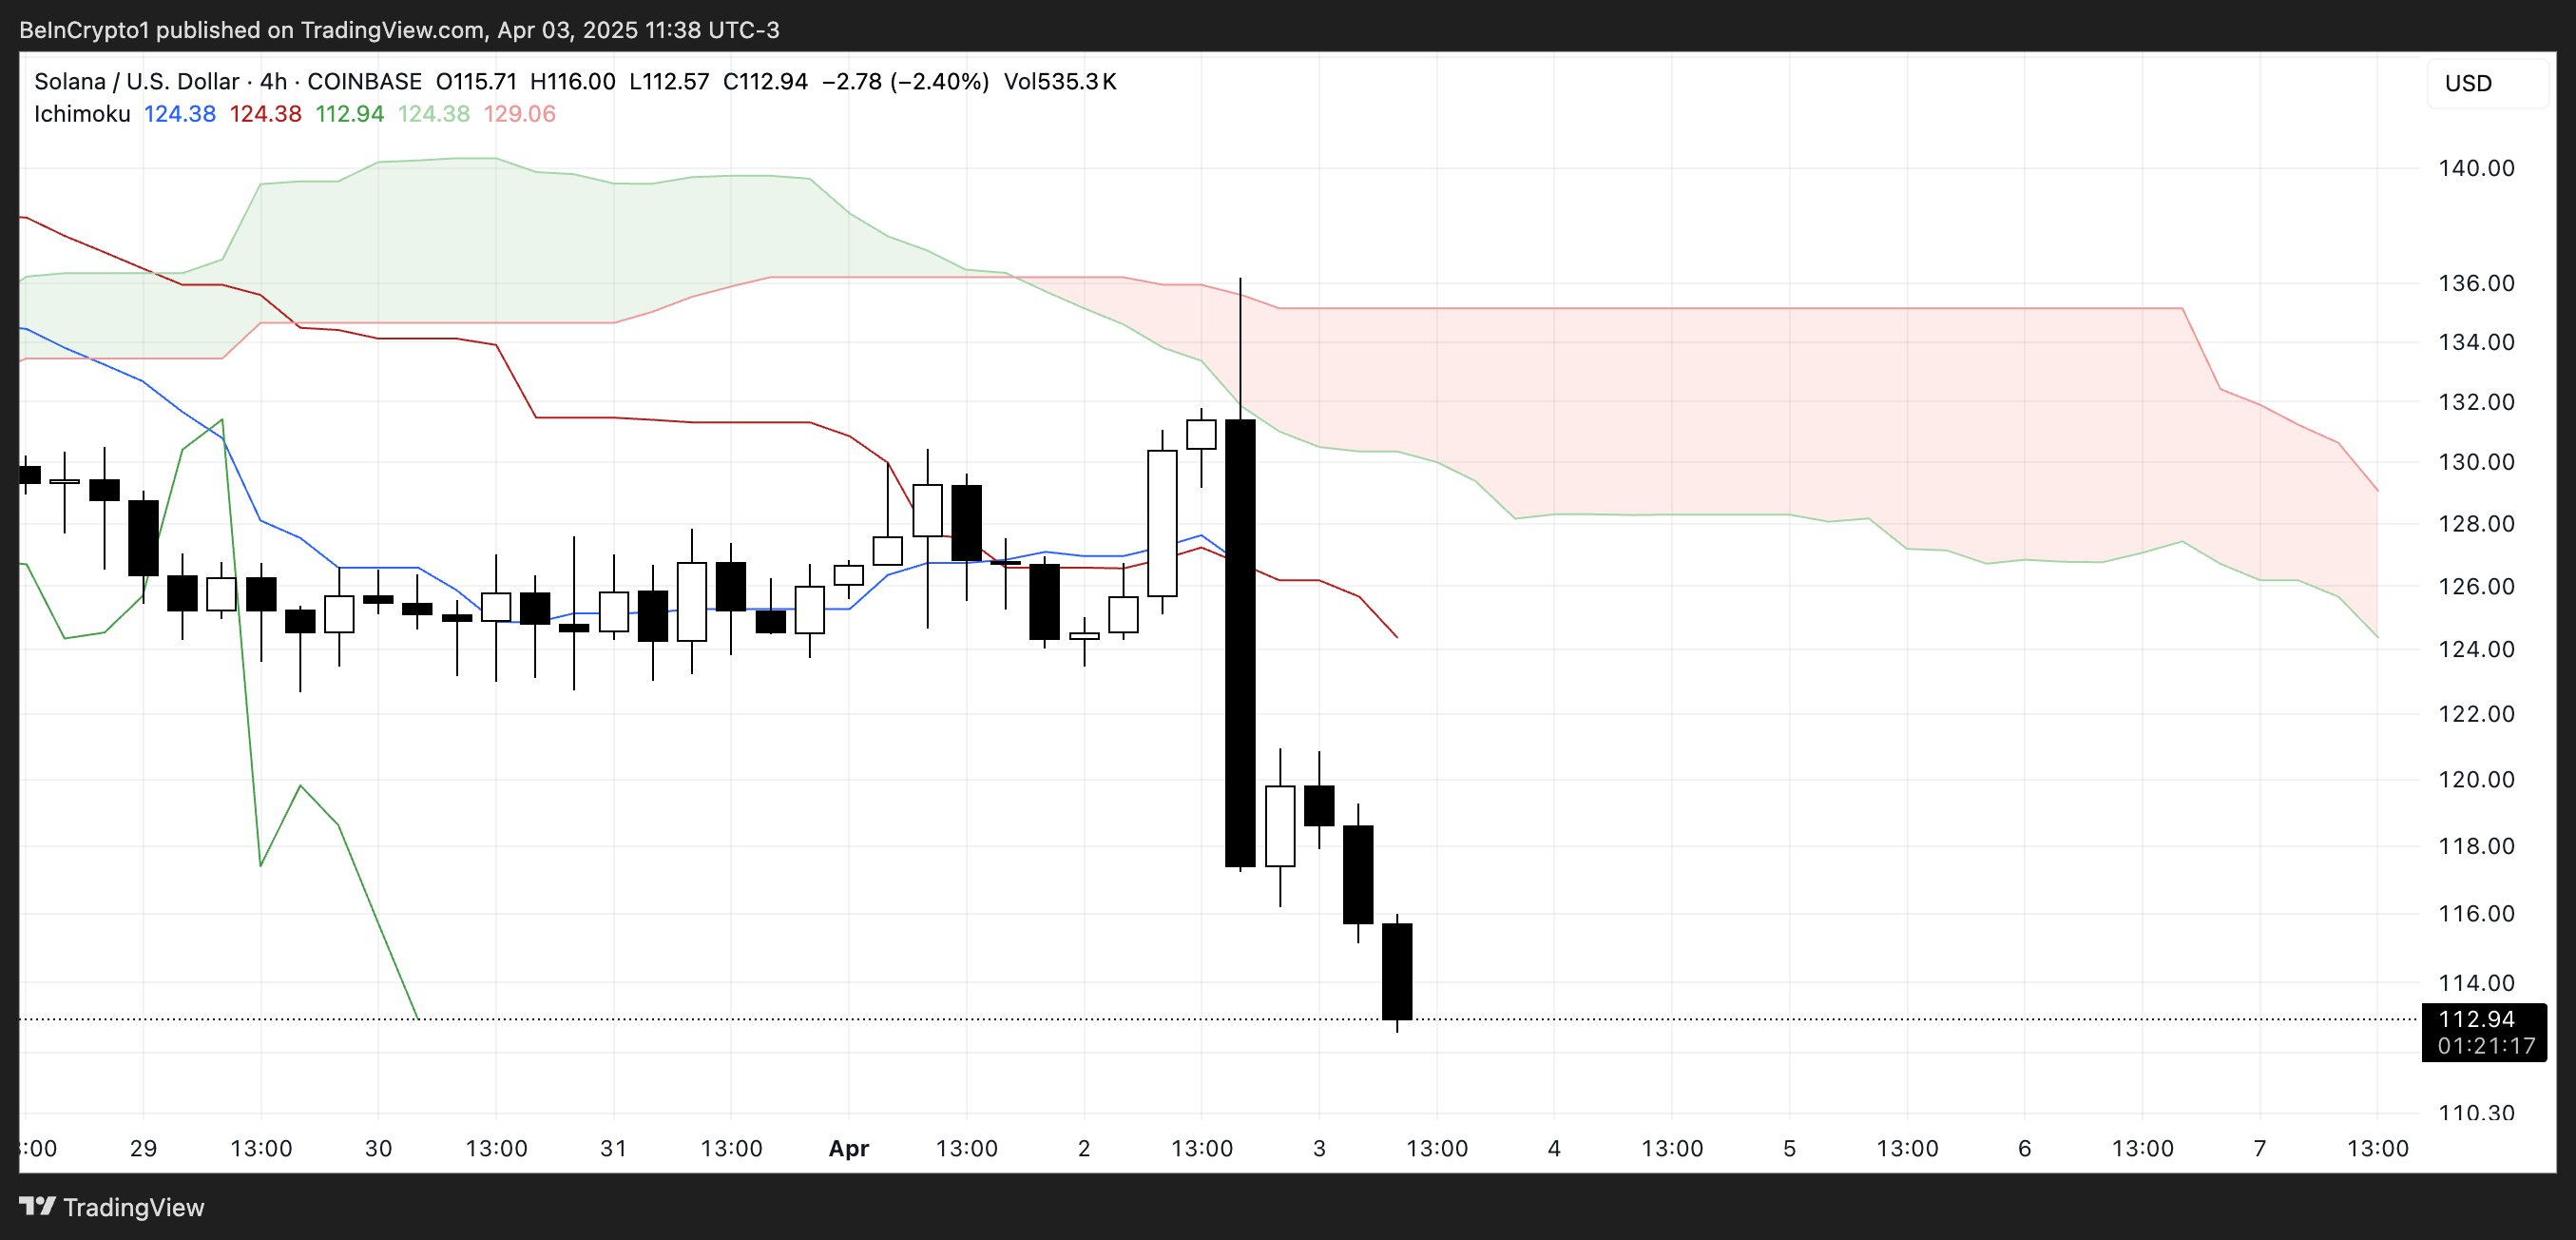
Looking at the Kumo (cloud) itself, the red cloud projected forward is thick and sloping downward, indicating that bearish pressure is expected to persist in the coming sessions.
The price is well below the cloud, which typically means the asset is in a strong downtrend.
For Solana to reverse this trend, it would need to reclaim the Tenkan-sen and Kijun-sen and push decisively through the entire cloud structure—an outcome that looks unlikely in the short term, given the current momentum and cloud formation.
Solana’s BBTrend Signals Prolonged Bearish Momentum
Solana’s BBTrend indicator currently sits at -6, having remained in negative territory for over five consecutive days. Just two days ago, it hit a bearish peak of -12.72, showing the strength of the recent downtrend.
Although it has slightly recovered from that low, the sustained negative reading signals that selling pressure remains firmly in control and that the bearish momentum hasn’t yet been reversed.
The BBTrend (Bollinger Band Trend) measures the strength and direction of a trend using Bollinger Bands. Positive values suggest bullish conditions and upward momentum, while negative values indicate bearish trends.
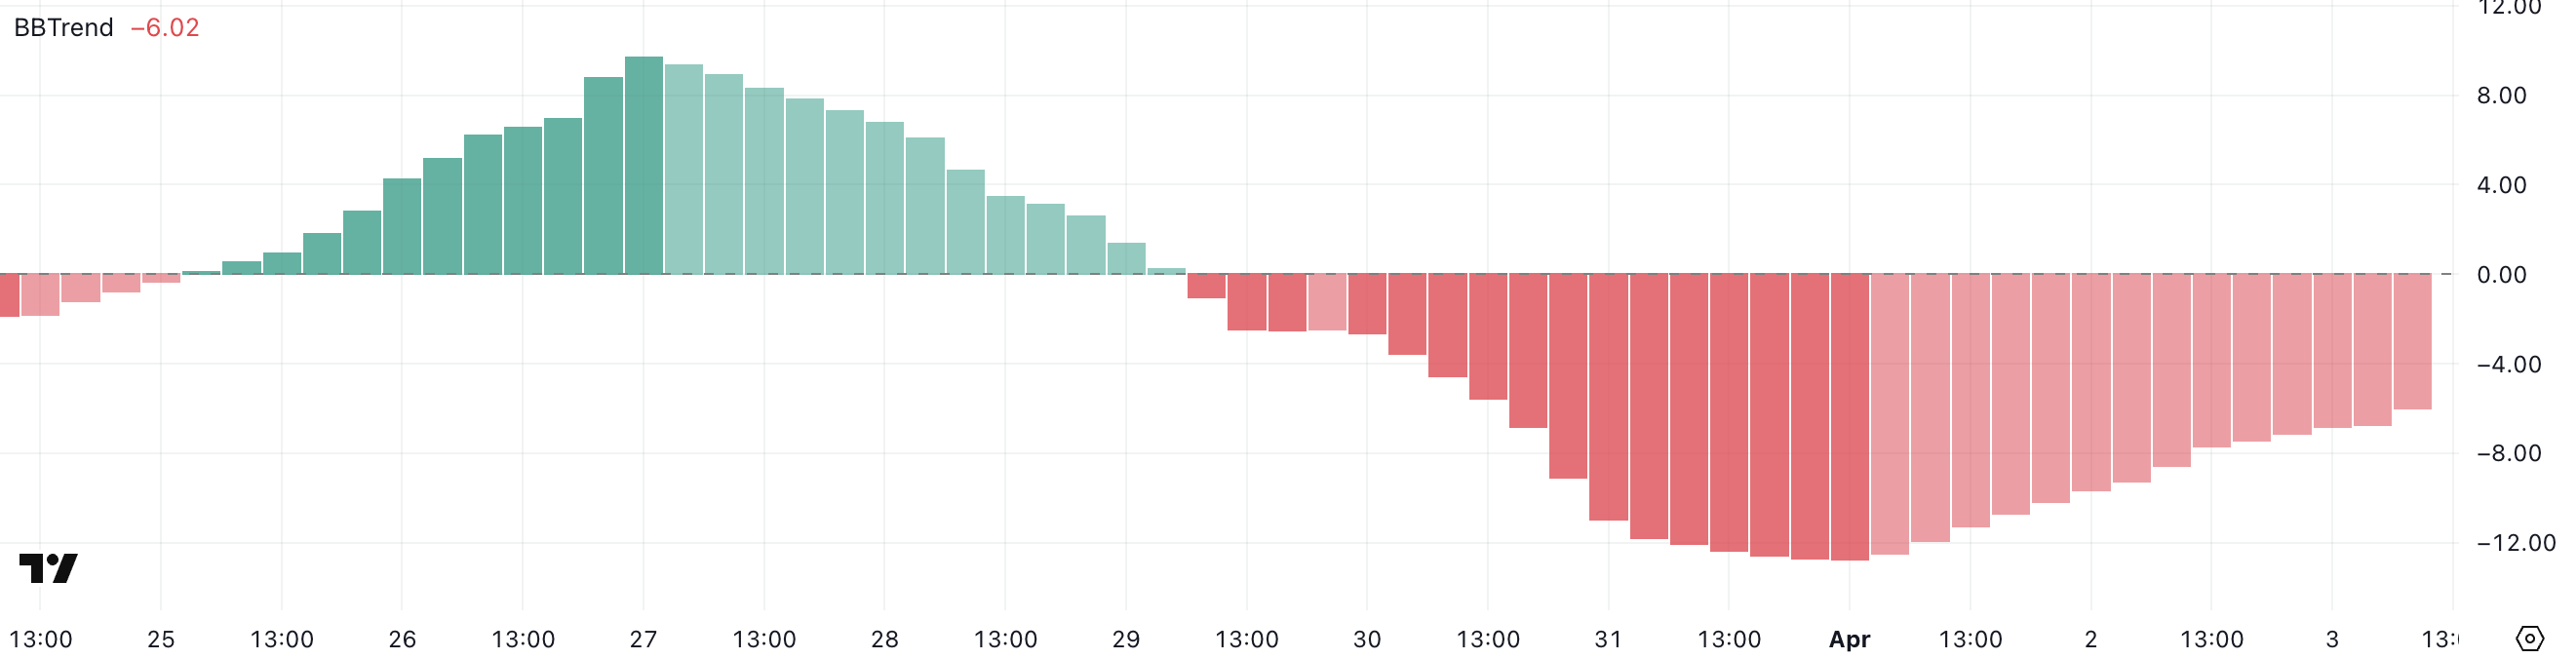
Generally, values beyond 5 are considered strong trend signals. With Solana’s BBTrend still well below -5, it implies that downside risk remains elevated.
Unless a sharp shift in momentum occurs, this persistent bearish reading may continue to weigh on SOL’s price in the near term.
Solana Eyes $112 Support as Bears Test February Lows
Solana’s price has broken below the key $115 level, and the next major support lies around $112. A confirmed move below this threshold could trigger further downside. That could potentially push the price under $110 for the first time since February 2024.
The recent momentum and strong bearish indicators suggest sellers remain in control, increasing the likelihood of testing these lower support levels in the near term.
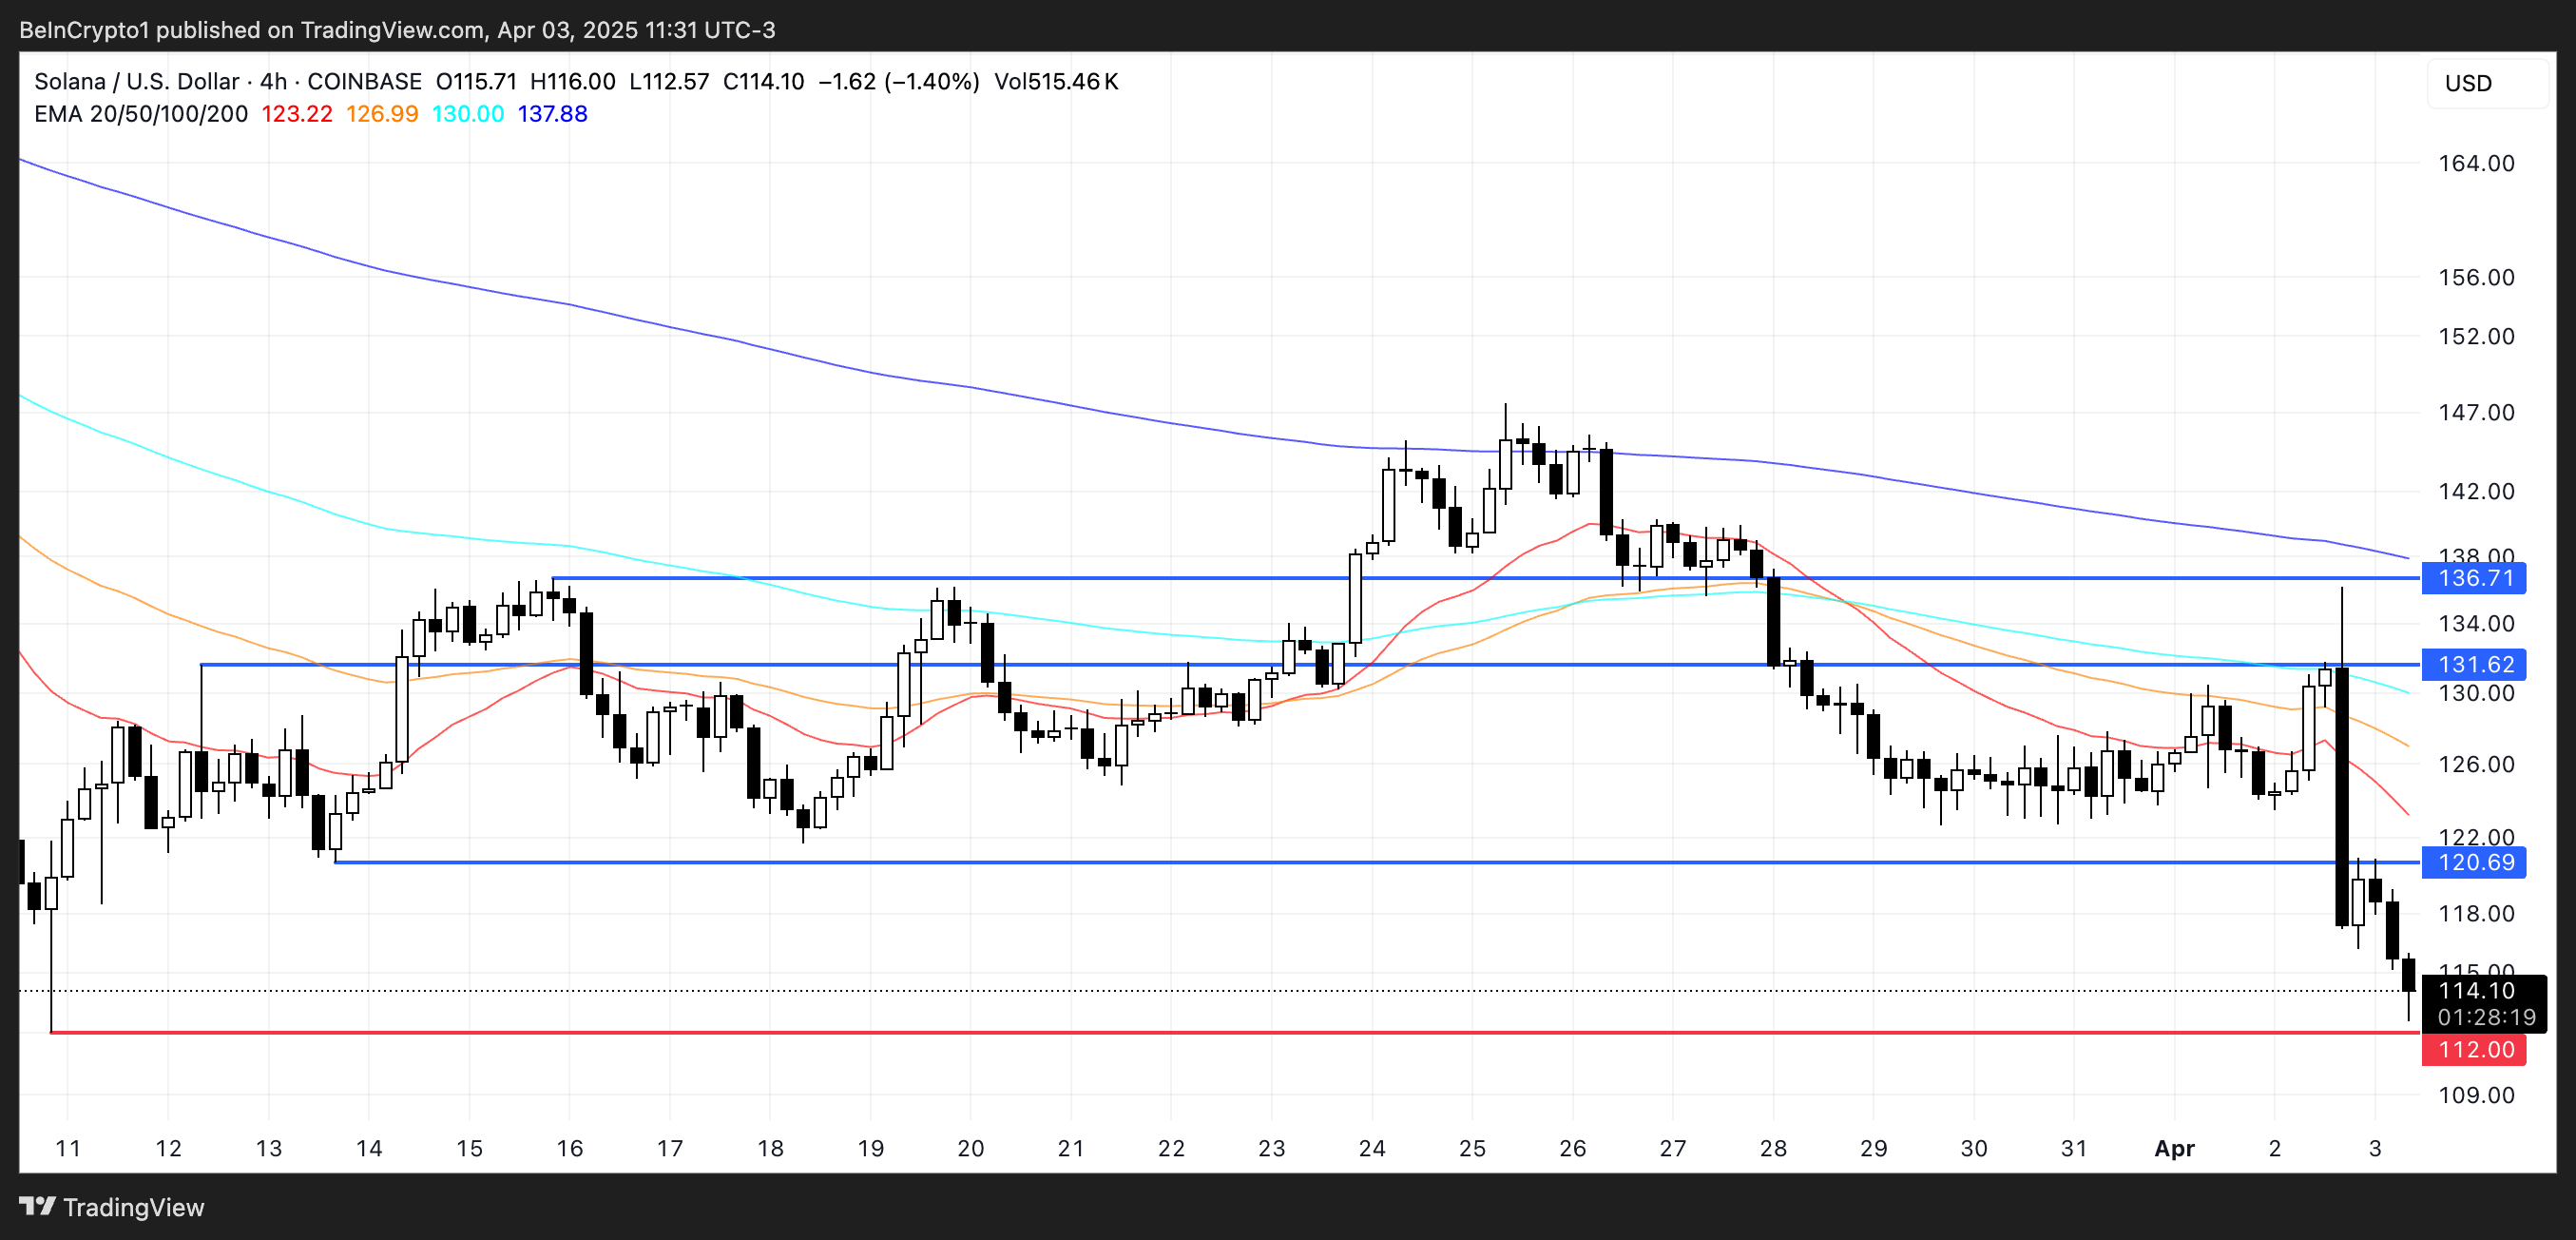
However, if Solana manages to stabilize and reverse its current trajectory, a rebound toward the $120 resistance level could follow.
Breaking above that would be the first sign of recovery, and if bullish momentum accelerates, SOL price could aim for higher targets at $131 and $136.
Disclaimer
In line with the Trust Project guidelines, this price analysis article is for informational purposes only and should not be considered financial or investment advice. BeInCrypto is committed to accurate, unbiased reporting, but market conditions are subject to change without notice. Always conduct your own research and consult with a professional before making any financial decisions. Please note that our Terms and Conditions, Privacy Policy, and Disclaimers have been updated.
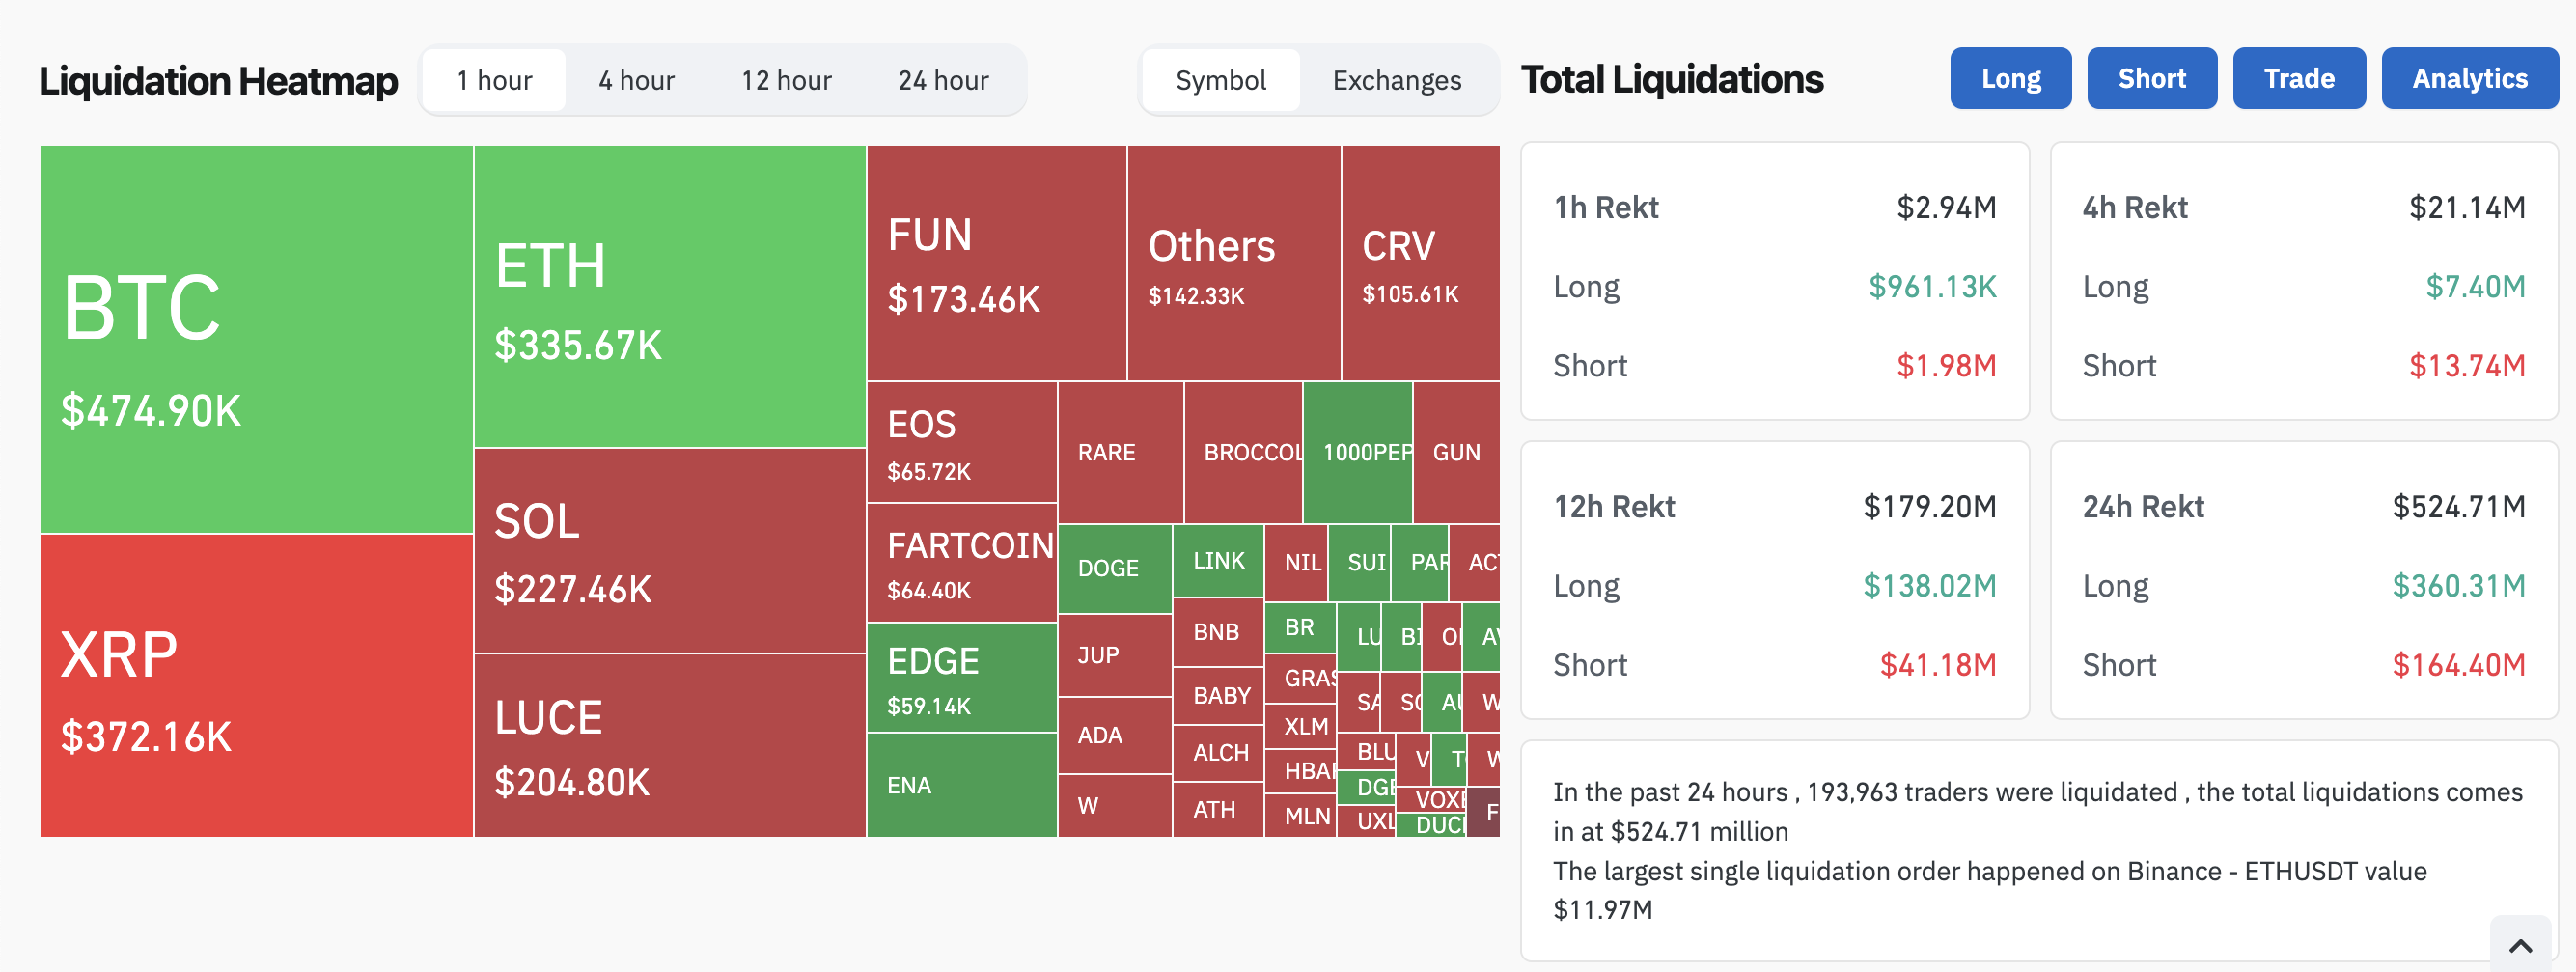
As traditional markets show clear signs of an impending recession, the crypto space is not immune from damage. Liquidations are surging as the overall crypto market cap mirrors declines in the stock market.
Even though the source of these problems is localized to the US, the damage will have global implications. Traders are advised to prepare for a sustained period of trouble.
How Will A Recession Impact Crypto?
Several economic experts have warned that the US market is poised for an impending recession. For all we know, it’s already here.
Since Donald Trump announced his Liberation Day tariffs, all financial markets have taken a real hit. The overall crypto market cap is down nearly 8%, and liquidations in the last 24 hours exceeded $500 million.
A few other key indicators show a similar trend. In late February, the Crypto Fear and Greed Index was at “Extreme Fear.” It recovered in March but fell back down to this category today.
Similarly, checkers adjacent to crypto, such as Polymarket, began predicting that a recession is more likely than not.
Although the crypto industry is closely tied to President Trump’s administration, it is not the driving force behind these recession fears. Indeed, crypto actually seems to be tailing TradFi markets at the moment.
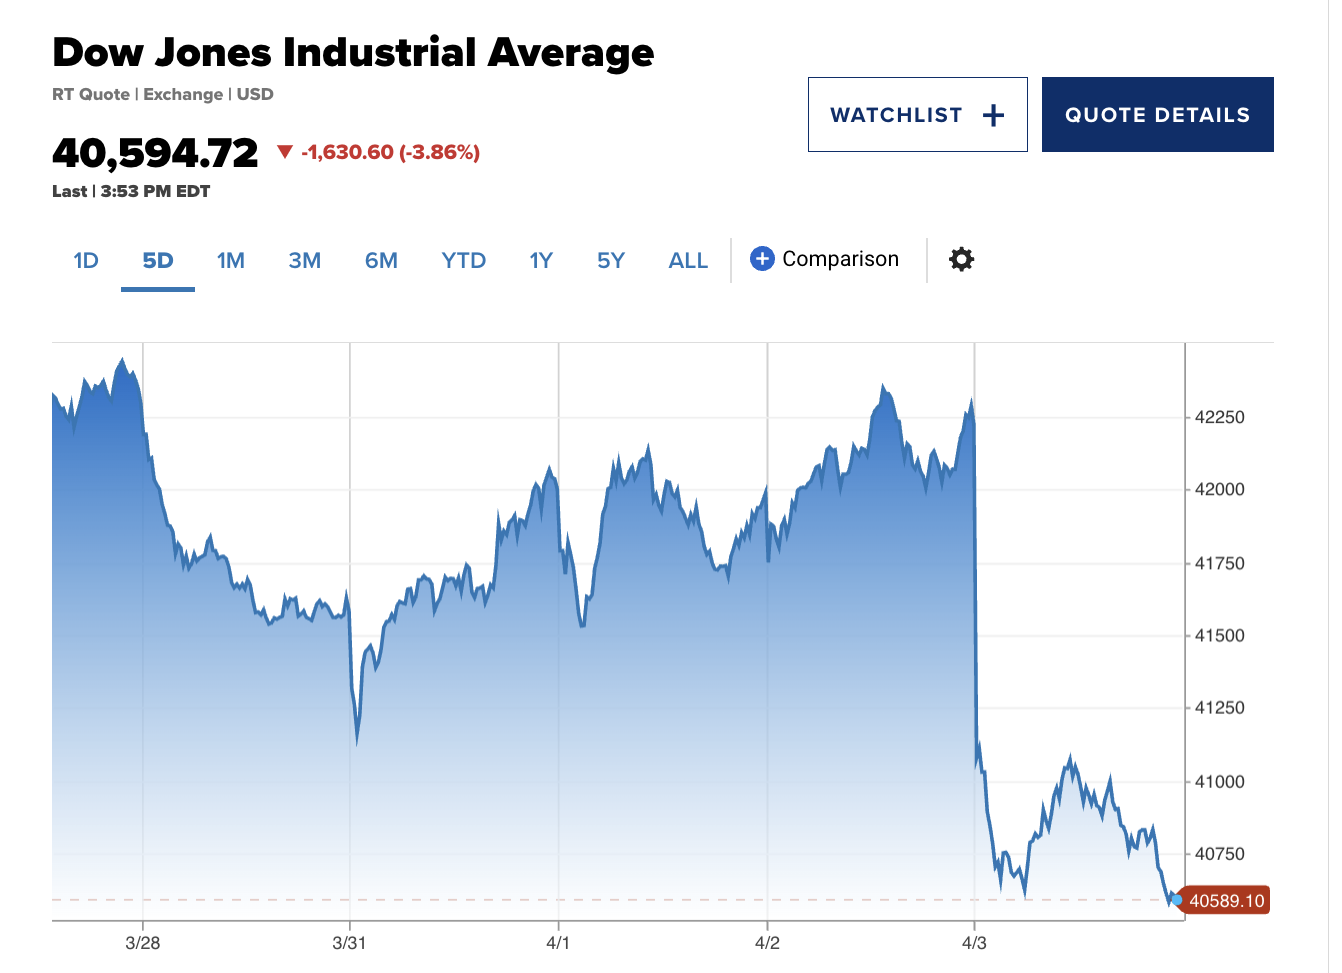
The Dow dropped 1600 points today, and the NASDAQ and S&P 500 both had their worst single-day drops since at least 2020.
Amidst all these recession fears, it’s been hard to identify an upside for crypto. Bitcoin briefly looked steady, but it fell more than 5% in the last 24 hours.
This doesn’t necessarily reflect its status as a secure store of value, as gold also looked steady before crumbling. To be fair, though, gold has only fallen 1.2% today.
In this environment, crypto enthusiasts worldwide should consider preparing for a recession. Trump’s proposed tariffs dramatically exceeded the worst expectations, and the resultant crisis is centered around the US.
Overall, current projections show that the crypto market will mirror the stock market to some extent. If the Nasdaq and S&P 500 fall further, the implications for risk assets could worsen.
Disclaimer
In adherence to the Trust Project guidelines, BeInCrypto is committed to unbiased, transparent reporting. This news article aims to provide accurate, timely information. However, readers are advised to verify facts independently and consult with a professional before making any decisions based on this content. Please note that our Terms and Conditions, Privacy Policy, and Disclaimers have been updated.


Changpeng “CZ” Zhao, former CEO of Binance, is advising Kyrgyzstan on becoming a crypto hub. He signed an agreement with the Kyrgyz National Investment Agency to build the nation’s Web3 capacities.
A cornerstone of this plan is Kyrgyzstan’s A7A5 stablecoin, pegged to the Russian ruble and focused on emerging markets. CZ claimed that he has been advising several governments “officially and unofficially” regarding crypto.
CZ Helps Kyrgyzstan Drive Crypto Adoption
Countries worldwide are becoming more interested in crypto integration lately. Although Kyrgyzstan has not been a particular hub for crypto activity, it is trying to turn a new leaf.
According to the latest announcements, the country is developing a new A7A5 stablecoin pegged to the Russian ruble. Kyrgyzstan’s crypto turn is also being influenced by Changpeng “CZ” Zhao, the founder of Binance.
“A Memorandum of Understanding has been signed between the National Investment Agency under the President of the Kyrgyz Republic and Changpeng Zhao (CZ). In accordance with the Memorandum, the parties intend to cooperate in the development of the cryptocurrency and blockchain technology ecosystem in the Kyrgyz Republic,” claimed President Sadyr Zhaparov.
CZ is a very influential figure in crypto and has been involved with a few official governments in his career. For example, last month, allegations surfaced that he was working with President Trump to establish a new dollar-backed stablecoin.
Meanwhile, CZ acknowledged his business in Kyrgyzstan, claiming that he introduced President Zhaparov to X, the social media site.
“I officially and unofficially advise a few governments on their crypto regulatory frameworks and blockchain solutions for gov efficiency, expanding blockchain to more than trading. I find this work extremely meaningful,” CZ claimed via social media.
Although CZ’s connection with Kyrgyzstan’s new A7A5 stablecoin is not fully known, it would align with his recent alleged Trump dealings.
Zhaparov’s statement claimed that the Binance founder will provide infrastructural, technological support, technical expertise, and consulting services on crypto and blockchain technologies.
Also, the president went on to state that this agreement with CZ will strengthen Kyrgyzstan’s standing in the growing Web3 environment. The long-term plan is to help create new opportunities for Kyrgyz businesses and society as a whole.
Presumably, this will involve some cooperation with Russia, as A7A5’s press release mentions “a new class of digital assets tied to the Russian economy.” This stablecoin is bucking significant tradition by aligning with the ruble instead of the dollar.
However, this is part of its strategy to focus on emerging markets. This novel experiment could demonstrate new market opportunities and challenge the dominance of USD-pegged stablecoins in the region.
Disclaimer
In adherence to the Trust Project guidelines, BeInCrypto is committed to unbiased, transparent reporting. This news article aims to provide accurate, timely information. However, readers are advised to verify facts independently and consult with a professional before making any decisions based on this content. Please note that our Terms and Conditions, Privacy Policy, and Disclaimers have been updated.

Solana (SOL) Crashes 11%—Is More Pain Ahead?
Expert Reveals XRP Price Could Drop To $1.90 Before Rally To New Highs

Crypto Market Mirrors Nasdaq and S&P 500 Amid Recession Fears

Here’s Why Is Shiba Inu Price Crashing Daily?

Binance’s CZ is Helping Kyrgyzstan Become A Crypto Hub

Altcoin Season Still In Sight Even As Ethereum Struggles To Gain Upward Momentum

2.52 Million Altcoins Are Ruining Crypto’s Future

Animoca Brands Valuation Tanks 75% In Two Years, Here’s Why

Crypto exchange BingX hacked for $43 million

Are The Big Players Losing Interest?

Hong Kong’s Securities Association Tips Authorities On Crypto Self-Regulation

Coinbase cbBTC Set to go Live on Solana
2.52 Million Altcoins Are Ruining Crypto’s Future
Animoca Brands Valuation Tanks 75% In Two Years, Here’s Why
Crypto exchange BingX hacked for $43 million
Are The Big Players Losing Interest?
Hong Kong’s Securities Association Tips Authorities On Crypto Self-Regulation
Coinbase cbBTC Set to go Live on Solana
-
 Altcoin21 hours ago
Binance Sidelines Pi Network Again In Vote To List Initiative, Here’s All
-

 Market21 hours ago
XRP Price Reversal Toward $3.5 In The Works With Short And Long-Term Targets Revealed
-

 Market18 hours ago
XRP Price Under Pressure—New Lows Signal More Trouble Ahead
-
 Altcoin18 hours ago
Analyst Forecasts 250% Dogecoin Price Rally If This Level Holds
-

 Market17 hours ago
Cardano (ADA) Downtrend Deepens—Is a Rebound Possible?
-

 Market16 hours ago
Ethereum Price Recovery Stalls—Bears Keep Price Below $2K
-
 Altcoin15 hours ago
VanEck Seeks BNB ETF Approval—Big Win For Binance?
-

 Market9 hours ago
Bitcoin’s Future After Trump Tariffs