Market
Did Changpeng Zhao Make or Lose Billions in Prison? Forbes and Bloomberg Weigh In


Binance founder and former CEO Changpeng Zhao (CZ) was likely still growing his wealth despite his four-month confinement in California’s Lompoc II detention center.
The popular crypto executive exited prison recently, concluding his sentence two days ahead of the official release.
Changpeng Zhao’s Daily Earnings While In Prison Debated
According to Bloomberg’s methodology, Binance’s Changpeng Zhao saw his net worth decline significantly while in prison. As of June 2, his wealth was estimated at $36.5 billion, which fell to around $30.8 billion by September 27.
Bloomberg took a conservative approach in calculating this, valuing CZ’s holdings in Bitcoin (BTC), Binance Coin (BNB), and Binance.us at $0. Additionally, the value of his Binance.com equity was discounted by 50%, based on the average EV-to-sales multiple of peers like Coinbase, Galaxy Digital, and Riot Platforms.
However, Forbes disagrees with Bloomberg’s approach. While Bloomberg estimated CZ’s wealth to have dropped, Forbes suggests he may have earned billions while in prison, estimating his net worth at $61 billion on that same date. It means CZ had a daily income of about $25 million during the four-month period.
Read more: Who Is Changpeng Zhao? A Deep Dive Into the Ex-CEO of Binance
Forbes did not fully disclose its methodology. However, its data shows that CZ’s net worth was $33 billion on May 7 and $57.8 billion on July 12. This sharp contrast suggests that Forbes includes CZ’s crypto holdings and applies a less conservative discount on his equity in Binance. Forbes’ estimate implies that CZ may have gained at least $3 billion during his time in prison.
Forbes’ valuation primarily focuses on wealth derived from equity in privately held Binance-affiliated companies. If accurate, this suggests CZ made more money during his prison term than many executives earn in a lifetime.
As BeInCrypto reported, authorities released CZ from prison on Friday, September 27, two days ahead of official date. He served 117 days at Lompoc II, a minimum-security prison near Santa Barbara.
It is worth mentioning that these are estimates as the Binance-affiliated firms where CZ owns equity are private. Similarly, CZ has no obligation to report his assets publicly.
Read more: Binance Review 2024: Is It the Right Crypto Exchange for You?
These facts make it rather opaque and difficult to calculate Changpeng Zhao’s net worth accurately. Bloomberg rated its confidence in the estimation at one out of five, putting it at the lowest level possible.
The post Did Changpeng Zhao Make or Lose Billions in Prison? Forbes and Bloomberg Weigh In appeared first on BeInCrypto.
Market
Is CZ’s April Fool’s Joke a Crypto Reality or Just Fun?


On April 1, Binance co-founder Changpeng Zhao (CZ) shared an amusing hypothetical on social media platform X (Twitter).
He posed the hypothetical scenario of a user generating a cryptocurrency wallet address commonly used for token burns, which permanently remove tokens from circulation.
Binance’s CZ Shares Cryptic Hypothetical on April Fools Day
Changpeng Zhao’s April Fools’ joke about generating a token burn address sparked discussions. However, the chances of it happening are astronomically low. CZ shared the post during the early hours of the Asian session, kickstarting an interesting discourse.
“Imagine downloading Trust Wallet and finding your newly generated address is: 0x000000000000000000000000000000000000dead. Theoretically speaking, it has the same chance as any other address. Alright, enough imagining. Not gonna happen. Get back to building. Happy Apr 1!” Changpeng Zhao wrote.
It comes in time for April Fools’ Day, celebrated annually on April 1, dedicated to practical jokes, hoaxes, and playful deception. Trust Wallet, integrated as Binance’s non-custodial wallet provider, played along with the joke.
“Happy April Fool’s Day,” wrote Trust Wallet.
While the idea seems far-fetched, CZ was not technically wrong. Theoretically, there is an infinitesimally small probability that someone could randomly generate a wallet address matching “0x000…dead” using software like Trust Wallet.
However, the chances are comparable to winning the lottery multiple times. To put things into perspective, one can generate blockchain addresses using cryptographic hashing functions that produce 160-bit outputs.
This means there are 2¹⁶⁰ possible Ethereum addresses—a number so vast that generating any specific address, such as “0x000…dead,” is practically impossible.
“Haha, imagine the odds! That is a 1 in 2^160 type of vibe. Good one, CZ—back to work now, no distractions from the code,” Synergy Media wrote, putting the rarity into context.
While CZ’s April Fool’s joke entertained the crypto community, the reality remains unchanged. The likelihood of generating a wallet address identical to “0x000…dead” is close to zero. This means the post was a fun thought experiment but nothing more.
“Imagine that you can randomly generate a Bitcoin private key every second, and suddenly one day the private key you generated happens to correspond to Satoshi Nakamoto’s wallet or Binance’s wallet. That’s terrifying,” another user quipped.
However, the joke does highlight the fascinating cryptographic underpinnings of blockchain technology. While every address is technically possible, some are rare and might as well be myths. Crypto users will have to keep burning their tokens the old-fashioned way.
Disclaimer
In adherence to the Trust Project guidelines, BeInCrypto is committed to unbiased, transparent reporting. This news article aims to provide accurate, timely information. However, readers are advised to verify facts independently and consult with a professional before making any decisions based on this content. Please note that our Terms and Conditions, Privacy Policy, and Disclaimers have been updated.
Market
XRP Bulls Fight Back—Is a Major Move Coming?

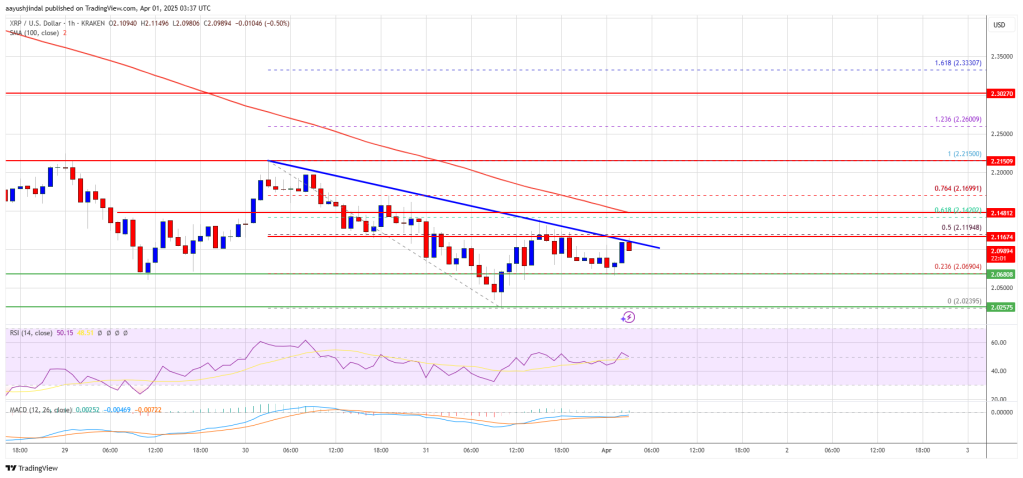
XRP price started a fresh decline below the $2.080 zone. The price is now recovering some losses and might face hurdles near the $2.150 level.
- XRP price started a fresh decline after it failed to clear the $2.20 resistance zone.
- The price is now trading below $2.120 and the 100-hourly Simple Moving Average.
- There is a connecting bearish trend line forming with resistance at $2.10 on the hourly chart of the XRP/USD pair (data source from Kraken).
- The pair might extend losses if it fails to clear the $2.150 resistance zone.
XRP Price Faces Resistance
XRP price failed to continue higher above the $2.20 resistance zone and reacted to the downside, like Bitcoin and Ethereum. The price declined below the $2.150 and $2.10 levels.
The pair even declined below the $2.050 zone. A low was formed at $2.023 and the price is now attempting a recovery wave. There was a move above the $2.050 level. The price cleared the 23.6% Fib retracement level of the recent decline from the $2.215 swing high to the $2.023 low.
The price is now trading below $2.120 and the 100-hourly Simple Moving Average. On the upside, the price might face resistance near the $2.10 level. There is also a connecting bearish trend line forming with resistance at $2.10 on the hourly chart of the XRP/USD pair. The trend line is near the 50% Fib retracement level of the recent decline from the $2.215 swing high to the $2.023 low.
The first major resistance is near the $2.150 level. The next resistance is $2.1680. A clear move above the $2.1680 resistance might send the price toward the $2.20 resistance. Any more gains might send the price toward the $2.220 resistance or even $2.250 in the near term. The next major hurdle for the bulls might be $2.2880.
Another Decline?
If XRP fails to clear the $2.120 resistance zone, it could start another decline. Initial support on the downside is near the $2.050 level. The next major support is near the $2.020 level.
If there is a downside break and a close below the $2.020 level, the price might continue to decline toward the $2.00 support. The next major support sits near the $1.880 zone.
Technical Indicators
Hourly MACD – The MACD for XRP/USD is now losing pace in the bearish zone.
Hourly RSI (Relative Strength Index) – The RSI for XRP/USD is now above the 50 level.
Major Support Levels – $2.050 and $2.020.
Major Resistance Levels – $2.120 and $2.150.
Market
CFTC’s Crypto Market Overhaul Under New Chair Brian Quintenz


Brian Quintenz, the incoming Chair of the US CFTC (Commodity Futures Trading Commission), has begun meeting with Capitol Hill lawmakers before his nomination hearing.
On Monday, Quintenz met with Senator Chuck Grassley (R-IA) to discuss key regulatory issues, including the CFTC’s role in overseeing crypto spot markets.
CFTC Targets Crypto Spot Market After Derivatives
Brian Quintenz met with Republican Senator from Iowa Chuck Grassley to discuss another element in the CFTC’s crypto market structure regulation agenda. This time, the focus is on crypto spot markets.
“It was wonderful to meet with you Chuck Grassley and discuss your leadership on whistleblower issues as well as the future of the agency,” Quintenz stated.
Grassley also commented on their discussion. He highlighted the CFTC Whistleblower Protection Program for spot crypto markets as part of the agenda. Notably, Grassley is a member of the Senate AG Committee, the legislative body overseeing the CFTC.
Eleanor Terrett, host of the Crypto America podcast, indicated that the Senate AG Committee will have a significant role in part of the CFTC’s crypto regulation agenda. Specifically, it would have an outsized say in whether the CFTC could gain expanded jurisdiction over crypto spot markets.
The meeting comes as the CFTC moves closer to expanding its role in crypto regulation. US President Donald Trump tapped Quintenz, a former executive at venture capital firm Andreessen Horowitz (a16z), to lead the agency.
His appointment is part of Trump’s broader plans to reshape crypto oversight. This could potentially give the CFTC greater authority over digital asset markets.
Meanwhile, regulatory developments surrounding crypto have accelerated in recent weeks. The CFTC eased regulatory hurdles for the crypto derivatives market only days ago. The move will enhance market efficiency and attract institutional investors.
Beyond derivatives and spot markets, the CFTC is also exploring other areas of crypto oversight. The agency recently announced plans to host a roundtable discussion on prediction market regulation. It aims to address the regulation of decentralized prediction platforms.
Stablecoins are also on the agency’s radar. The CFTC also revealed a forum to discuss stablecoin regulation and potential risks associated with their widespread adoption.
Additionally, the Federal Deposit Insurance Corporation (FDIC) and the CFTC revoked previous crypto-related guidelines, signaling a shift in regulatory strategy.
Crypto markets can also not rule out the possibility of further collaboration between key agencies in the broader industry. Reports indicate that the US SEC (Securities and Exchange Commission) and the CFTC have discussed reviving a joint advisory committee to coordinate on crypto regulation.
If revived, the committee could serve as a bridge between the agencies. This would address concerns over jurisdictional overlap and streamlining oversight efforts.
As Quintenz prepares for his nomination hearing, his meetings with lawmakers suggest that crypto regulation will be a top priority for the CFTC moving forward.
Disclaimer
In adherence to the Trust Project guidelines, BeInCrypto is committed to unbiased, transparent reporting. This news article aims to provide accurate, timely information. However, readers are advised to verify facts independently and consult with a professional before making any decisions based on this content. Please note that our Terms and Conditions, Privacy Policy, and Disclaimers have been updated.
-

 Market18 hours ago
Bitcoin Mining Faces Tariff Challenges as Hashrate Hits New ATH
-

 Bitcoin24 hours ago
US Macroeconomic Indicators This Week: NFP, JOLTS, & More
-

 Market23 hours ago
Don’t Fall for These Common Crypto Scams
-

 Bitcoin16 hours ago
Strategy Adds 22,048 BTC for Nearly $2 Billion
-

 Market21 hours ago
Strategic Move for Trump Family in Crypto
-

 Market16 hours ago
BNB Breaks Below $605 As Bullish Momentum Fades – What’s Next?
-

 Market20 hours ago
Top Crypto Airdrops to Watch in the First Week of April
-

 Market15 hours ago
Trump Family Gets Most WLFI Revenue, Causing Corruption Fears


