
Market
Analyst Discuss Strategies to Buy the Dip


Despite its historical bullishness, October’s beginning has been anything but predictable. Traditionally dubbed “Uptober” by crypto enthusiasts for its typically strong performance, this month has faced substantial disruptions.
These disturbances stem from escalating geopolitical tensions between Israel and Iran, which intensified dramatically on October 1 with a significant missile attack—the second incident this year.
Analysts Believe Altcoin Season Is Closer
This geopolitical strife has injected uncertainty into global markets, impacting cryptocurrencies with over $500 million in liquidations. Nevertheless, some experts view these disruptions as just hiccups preceding an altcoin season.
“Altcoin season is not going anywhere. The market is doing a shakeout. People are being tested. This is just like every other test. You need to pass,” pseudonymous analyst Altcoin Buzz stated.
Read more: 11 Cryptos To Add To Your Portfolio Before Altcoin Season
In response to the market downturn, prominent crypto analyst Miles Deutscher has outlined strategies for opportunistic buying during the dip. According to Deutscher, the key is focusing on previous leaders.
“It’s actually quite simple because we just had a sample size from the market. The market gave us information on the old coins that pumped when things were really bullish last week, so what you want to do is pick the leaders during the most recent rally,” he explained.
Deutscher believes that meme coins and AI tokens have been at the forefront of the market for the last two weeks. Hence, he expects that when the market rebounds from this dip, these sectors might become the strongest performers once again.
Specifically, Deutscher mentioned Dogwifhat (WIF), Pepe (PEPE), Popcat (POPCAT) and Mog Coin (MOG). He also pointed to Fantom (FTM), which showed remarkable resilience during the current market dip. Despite this, Deutscher continues to maintain a position in stablecoins as a hedge against potential further downturns.
“The real alpha here is to make sure your watchlist is pre-prepared based on relative strength. If the market drops further, you’ll know exactly what to buy, and you’ll be mentally prepared rather than panicking and derisking,” Deutscher stated.
He recommends using price aggregator platforms to monitor daily top performers, which are likely to lead once the market uptrend resumes.
Read more: 7 Hot Meme Coins and Altcoins that are Trending in 2024
Other analysts also echo the sentiment that the altcoin season is just around the corner.
“Altcoin season is closer than ever before. Uptober is still Uptober, despite the recent Middle East confrontations. I am starting to swap more Solana (SOL) and Ethereum (ETH) into memes and promising alts that I expect to make 5-10x returns,” crypto researcher 0xFinish noted.
Indeed, by preparing a strategic watchlist and understanding the relative strengths of different altcoins, investors can effectively capitalize on potential market rebounds. As always, vigilance and preparedness are key to leveraging opportunities during periods of volatility.
Disclaimer
In adherence to the Trust Project guidelines, BeInCrypto is committed to unbiased, transparent reporting. This news article aims to provide accurate, timely information. However, readers are advised to verify facts independently and consult with a professional before making any decisions based on this content. Please note that our Terms and Conditions, Privacy Policy, and Disclaimers have been updated.


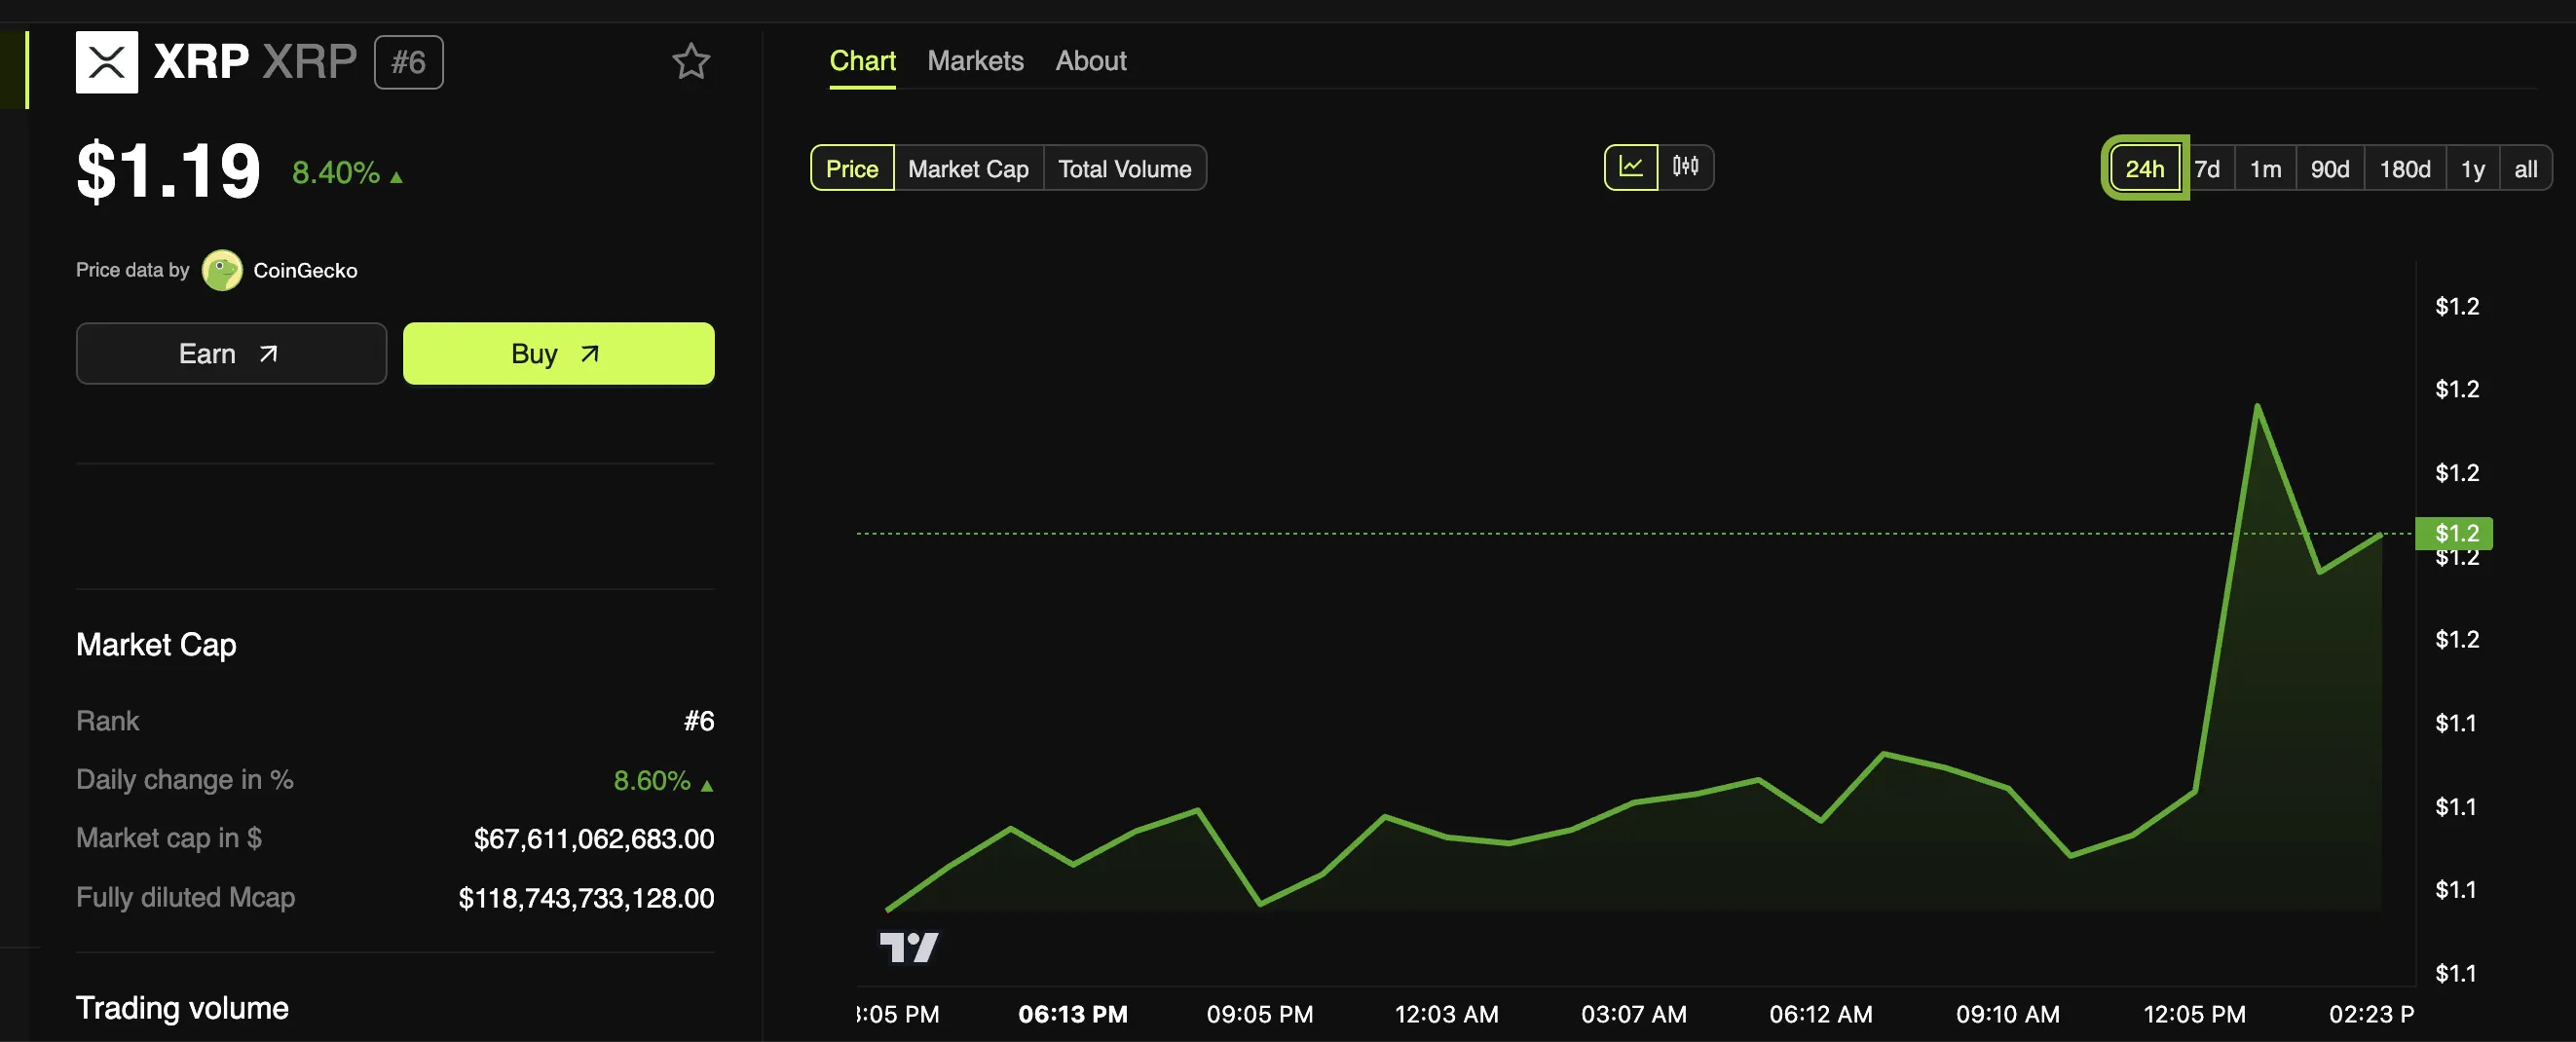
ETF issuer WisdomTree’s European division just announced a new ETP based on XRP. This product is currently available in four EU countries, which has led XRP’s price to jump slightly.
ETPs are a common issuer strategy to earn revenue without ETF approval, but Europe will not necessarily approve one even if the US does so.
WisdomTree’s XRP ETP
WisdomTree, one of the Bitcoin ETF issuers in the US, announced that its European branch is offering an exchange-traded product (ETP) based on XRP. This new product is currently available in Germany, Switzerland, France, and the Netherlands. A growing number of issuers have filed for an XRP ETF, but WisdomTree is taking a slightly different tack.
“The WisdomTree Physical XRP ETP offers a simple, secure, and low-cost way to gain exposure to XRP, one of the largest cryptocurrencies by market capitalization. Backed 100% by XRP, XRPW is the lowest-priced XRP ETP in Europe, providing direct spot price exposure,” the announcement claimed.
The possibility of an official XRP ETF is growing with the current bull market, and Ripple CEO Brad Garlinghouse considers it “inevitable.” Still, it hasn’t happened yet, and ETP offerings allow issuers to somewhat address customers’ requirements. BitWise, which has also filed for an XRP ETF in the US, recently acquired a European ETP issuer to enter the same market.
WisdomTree, however, is no stranger to this market strategy. In May this year, it won approval to offer ETPs based on Bitcoin and Ethereum to British investors.
The UK has not yet approved a full ETF for either of these assets, but WisdomTree still gained market access. Even a fraction of the XRP market could also prove lucrative; the asset’s value spiked today.
WisdomTree Europe’s strategy page does not describe any further actions upon full approval. Even if the US approves an XRP ETF under the SEC’s new leadership, that won’t necessarily benefit WisdomTree’s European branch. For now, these ETPs built on XRP will have to suffice for this market.
Disclaimer
In adherence to the Trust Project guidelines, BeInCrypto is committed to unbiased, transparent reporting. This news article aims to provide accurate, timely information. However, readers are advised to verify facts independently and consult with a professional before making any decisions based on this content. Please note that our Terms and Conditions, Privacy Policy, and Disclaimers have been updated.

Ethereum price started a fresh increase above the $3,220 zone. ETH is rising and aiming for more gains above the $3,350 resistance.
- Ethereum started a fresh increase above the $3,220 and $3,300 levels.
- The price is trading above $3,250 and the 100-hourly Simple Moving Average.
- There is a short-term contracting triangle forming with resistance at $3,360 on the hourly chart of ETH/USD (data feed via Kraken).
- The pair could gain bullish momentum if it clears the $3,385 resistance zone.
Ethereum Price Regains Traction
Ethereum price remained supported above $3,000 and started a fresh increase like Bitcoin. ETH gained pace for a move above the $3,150 and $3,220 resistance levels.
The bulls pumped the price above the $3,300 level. It gained over 10% and traded as high as $3,387. It is now consolidating gains above the 23.6% Fib retracement level of the recent move from the $3,036 swing low to the $3,387 high.
Ethereum price is now trading above $3,220 and the 100-hourly Simple Moving Average. On the upside, the price seems to be facing hurdles near the $3,350 level. There is also a short-term contracting triangle forming with resistance at $3,360 on the hourly chart of ETH/USD.

The first major resistance is near the $3,385 level. The main resistance is now forming near $3,420. A clear move above the $3,420 resistance might send the price toward the $3,550 resistance. An upside break above the $3,550 resistance might call for more gains in the coming sessions. In the stated case, Ether could rise toward the $3,650 resistance zone or even $3,880.
Another Decline In ETH?
If Ethereum fails to clear the $3,350 resistance, it could start another decline. Initial support on the downside is near the $3,300 level. The first major support sits near the $3,250 zone.
A clear move below the $3,250 support might push the price toward $3,220 or the 50% Fib retracement level of the recent move from the $3,036 swing low to the $3,387 high. Any more losses might send the price toward the $3,150 support level in the near term. The next key support sits at $3,050.
Technical Indicators
Hourly MACD – The MACD for ETH/USD is gaining momentum in the bullish zone.
Hourly RSI – The RSI for ETH/USD is now above the 50 zone.
Major Support Level – $3,250
Major Resistance Level – $3,385
Ethereum price started a fresh increase above the $3,220 zone. ETH is rising and aiming for more gains above the $3,350 resistance.
- Ethereum started a fresh increase above the $3,220 and $3,300 levels.
- The price is trading above $3,250 and the 100-hourly Simple Moving Average.
- There is a short-term contracting triangle forming with resistance at $3,360 on the hourly chart of ETH/USD (data feed via Kraken).
- The pair could gain bullish momentum if it clears the $3,385 resistance zone.
Ethereum Price Regains Traction
Ethereum price remained supported above $3,000 and started a fresh increase like Bitcoin. ETH gained pace for a move above the $3,150 and $3,220 resistance levels.
The bulls pumped the price above the $3,300 level. It gained over 10% and traded as high as $3,387. It is now consolidating gains above the 23.6% Fib retracement level of the recent move from the $3,036 swing low to the $3,387 high.
Ethereum price is now trading above $3,220 and the 100-hourly Simple Moving Average. On the upside, the price seems to be facing hurdles near the $3,350 level. There is also a short-term contracting triangle forming with resistance at $3,360 on the hourly chart of ETH/USD.
The first major resistance is near the $3,385 level. The main resistance is now forming near $3,420. A clear move above the $3,420 resistance might send the price toward the $3,550 resistance. An upside break above the $3,550 resistance might call for more gains in the coming sessions. In the stated case, Ether could rise toward the $3,650 resistance zone or even $3,880.
Another Decline In ETH?
If Ethereum fails to clear the $3,350 resistance, it could start another decline. Initial support on the downside is near the $3,300 level. The first major support sits near the $3,250 zone.
A clear move below the $3,250 support might push the price toward $3,220 or the 50% Fib retracement level of the recent move from the $3,036 swing low to the $3,387 high. Any more losses might send the price toward the $3,150 support level in the near term. The next key support sits at $3,050.
Technical Indicators
Hourly MACD – The MACD for ETH/USD is gaining momentum in the bullish zone.
Hourly RSI – The RSI for ETH/USD is now above the 50 zone.
Major Support Level – $3,250
Major Resistance Level – $3,385

Dogecoin Hashrate Surges To New All-Time High Amid Rise In Positive Momentum
WisdomTree Europe Launches XRP ETP

BTC Surges to $99K, ETH Shoots, XRP Jumps 25%

Rallies 10% and Targets More Upside
Rallies 10% and Targets More Upside

“Crypto Dad” Chris Giancarlo Emerges Top For White House Crypto Czar Role

2.52 Million Altcoins Are Ruining Crypto’s Future

Animoca Brands Valuation Tanks 75% In Two Years, Here’s Why

Crypto exchange BingX hacked for $43 million

Are The Big Players Losing Interest?

Hong Kong’s Securities Association Tips Authorities On Crypto Self-Regulation

Coinbase cbBTC Set to go Live on Solana
2.52 Million Altcoins Are Ruining Crypto’s Future
Animoca Brands Valuation Tanks 75% In Two Years, Here’s Why
Crypto exchange BingX hacked for $43 million
Are The Big Players Losing Interest?
Hong Kong’s Securities Association Tips Authorities On Crypto Self-Regulation
Coinbase cbBTC Set to go Live on Solana
-

 Ethereum22 hours ago
Fundraising platform JustGiving accepts over 60 cryptocurrencies including Bitcoin, Ethereum
-

 Market18 hours ago
South Korea Unveils North Korea’s Role in Upbit Hack
-

 Market23 hours ago
Cardano’s Hoskinson Wants Brian Armstrong for US Crypto-Czar
-

 Bitcoin13 hours ago
Marathon Digital Raises $1B to Expand Bitcoin Holdings
-
 Market13 hours ago
ETH/BTC Ratio Plummets to 42-Month Low Amid Bitcoin Surge
-
 Altcoin24 hours ago
SHIB Burn Rate Surges 2200%, Shiba Inu Eyes Parabolic Rally Ahead?
-
 Altcoin16 hours ago
Sui Network Back Online After 2-Hour Outage, Price Slips
-

 Market22 hours ago
Litecoin (LTC) at a Crossroads: Can It Rebound and Rally?