
Market
Fantom (FTM) Price Aims for $1, Pushing 100 Million Tokens Into Profit

Fantom (FTM), currently transitioning to Sonic (S), is one of today’s top market gainers, with its price rising by 8% in the last 24 hours.
As FTM climbs, indicators point to the potential for even greater gains. This analysis outlines the factors driving the token’s rise, key resistance levels to watch, and the potential benefits for investors.
Fantom Plan to Put Worried Holders Out of Pain
As of this writing, Fantom’s price is $0.75, meaning 53% of the total FTM holders are now in profits. However, according to the Global In/Out of Money (GIOM) Around Price, holders who are currently out of money might soon gain from the price appreciation.
The GIOM classifies addresses based on those making money at the break-even point and those in losses at the current price. Using an average on-chain cost basis, the indicator can tell how much volume can become profitable or otherwise, depending on the price action.
Also, the larger the clusters, the stronger the support or resistance. According to IntoTheBlock, about 25,230 addresses that accumulated FTM between $0.94 and $1.50 are currently holding over 100 million tokens at a loss.
Read more: How to Add Fantom to MetaMask: A Step-by-Step Guide
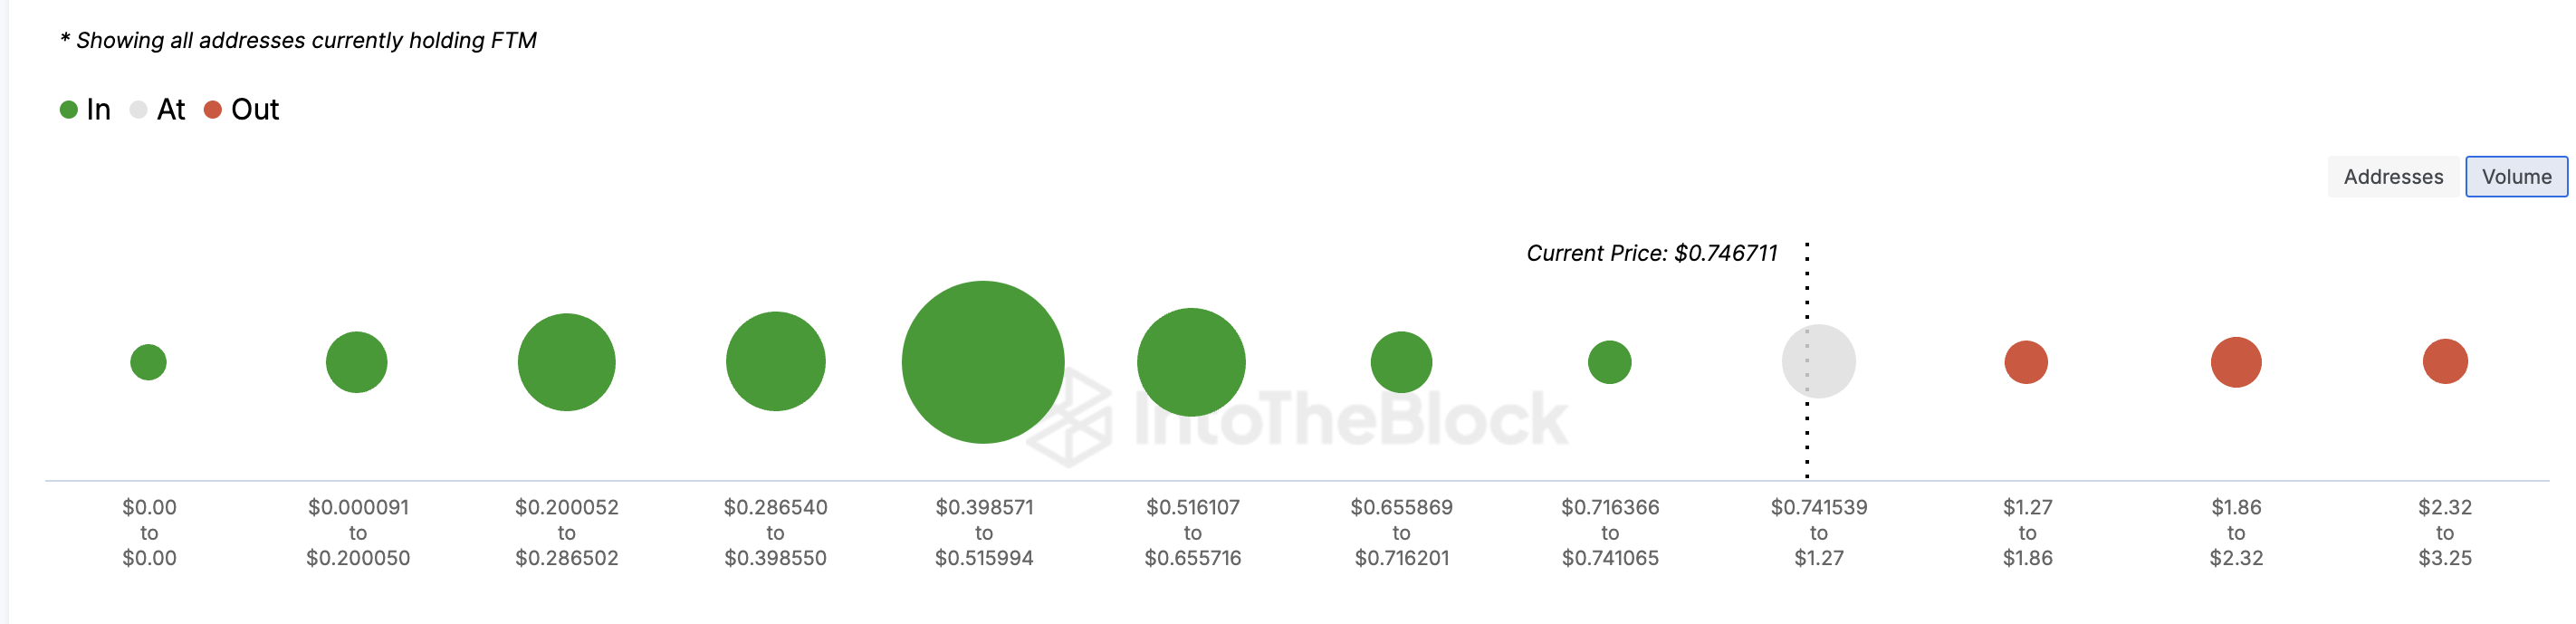
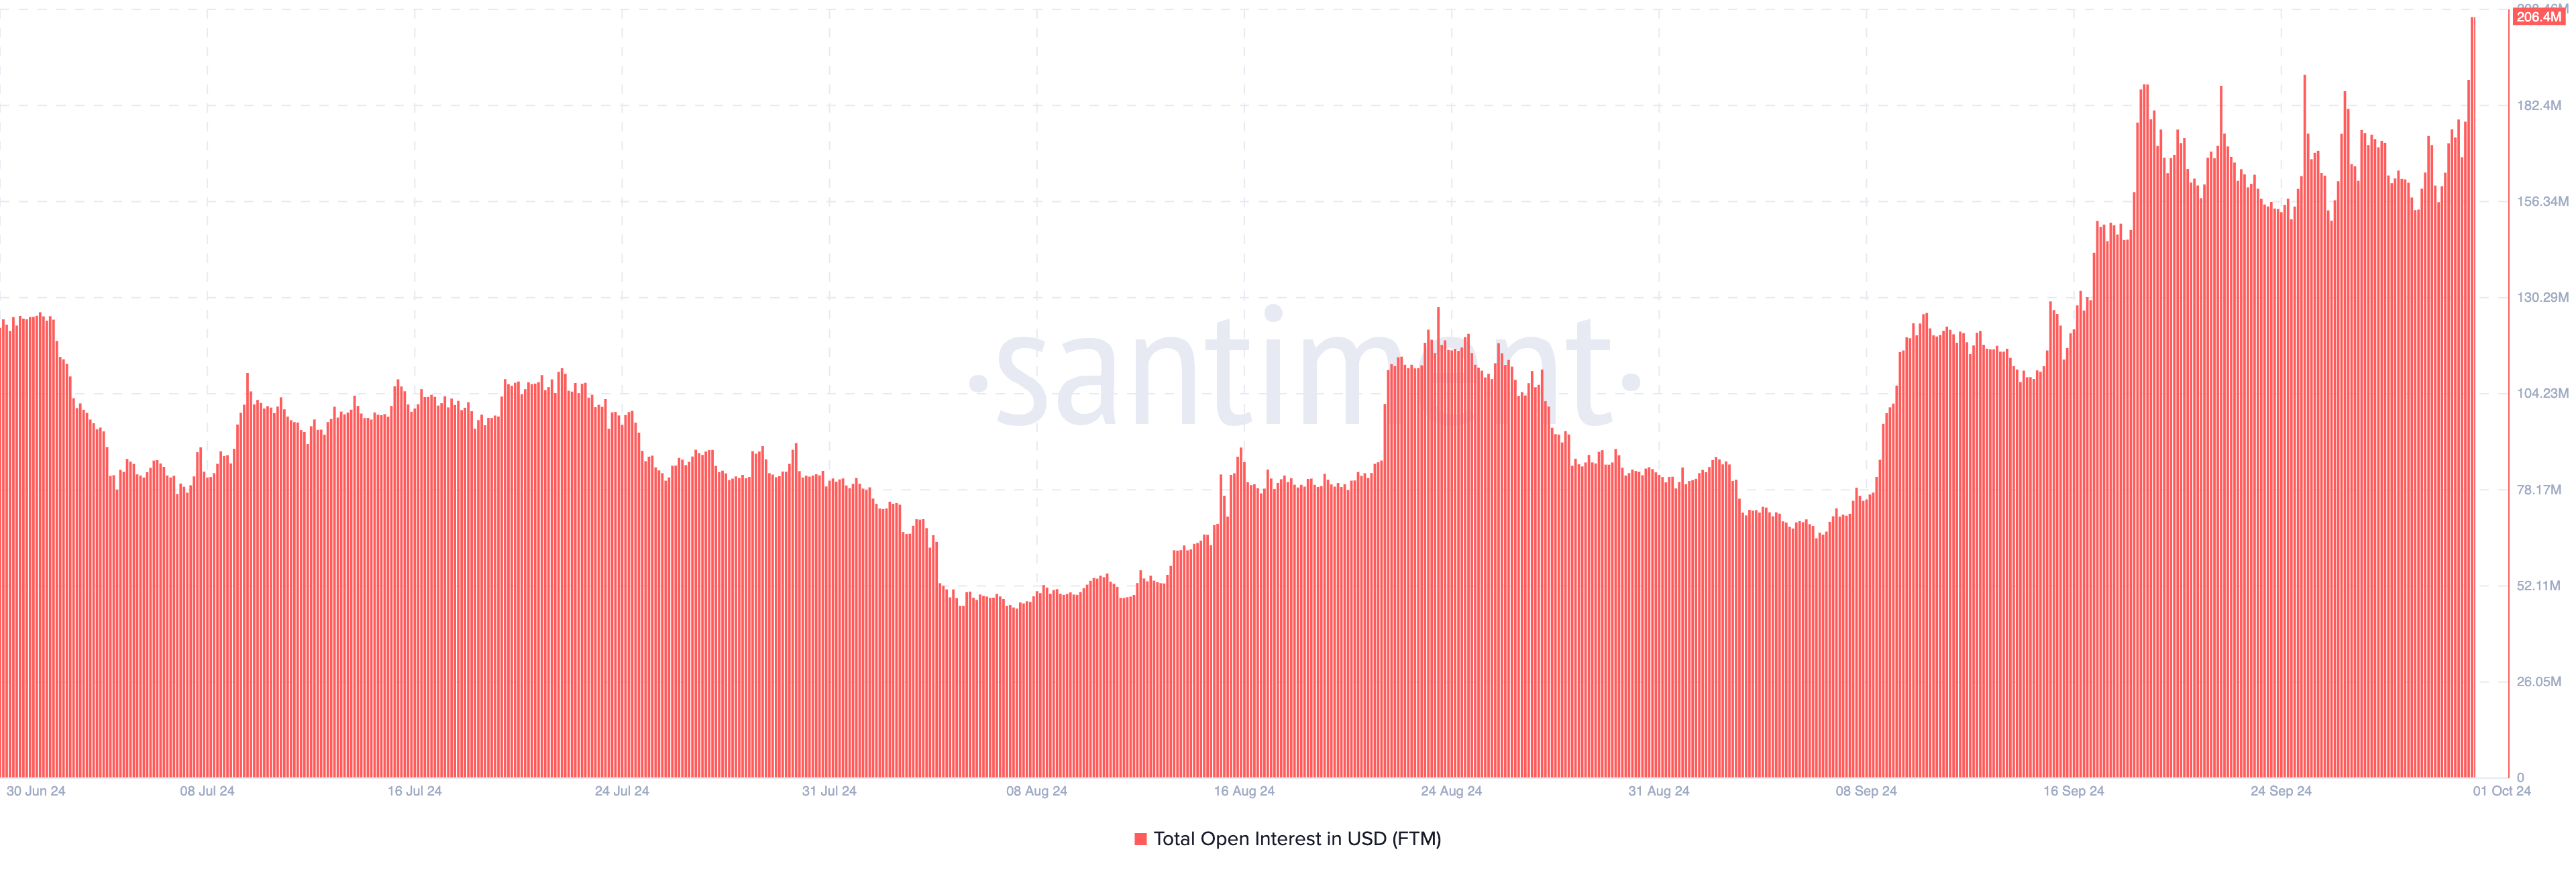
However, with strong support of around $0.75, these addresses might soon be in the money, indicating that the volume in these regions could soon be valued at $75 million. Fantom’s Open Interest has also increased, suggesting that more money is flowing into FTM-related contracts.
Historically, whenever this happens when FTM’s price increases, the uptrend becomes stronger. Thus, it is likely that the token’s uptrend might continue, and FTM’s price could close in on the $1 mark.
Interestingly, crypto trader Ansem also seems to align with the bullish bias. The trader, who has 503,900 followers on X, noted that the last quarter was for accumulation, while this new one will see FTM price trade much higher.
“FTM price action is a good indicator of the different regimes we are in now. March-> July: alts down only [-70-80%]. July -> September: sideways accumulation. currently, continuation without high timeframe retests is usually the beginning of aggro trend,” Ansem wrote.
FTM Price Prediction: Higher Values Only
On the daily chart, FTM’s price increased after a bullish inverse head-and-shoulders pattern formed. Currently trading at $0.75, BeInCrypto examined the Directional Movement Index (DMI) to support the continuation of the altcoin’s uptrend.
As the name implies, the DMI measures a cryptocurrency’s trend. At press time, the DMI (red) was down to 5.68, which indicates that sellers are not in control. On the other hand, the DMI (green) was higher at 2.08.
In addition, the Average Directional Index (ADX), which measures directional strength, has increased. At press time, the ADX (yellow) is 48.49, suggesting that Fantom’s price might continue to move up.
Read more: 9 Best Fantom (FTM) Wallets in 2024
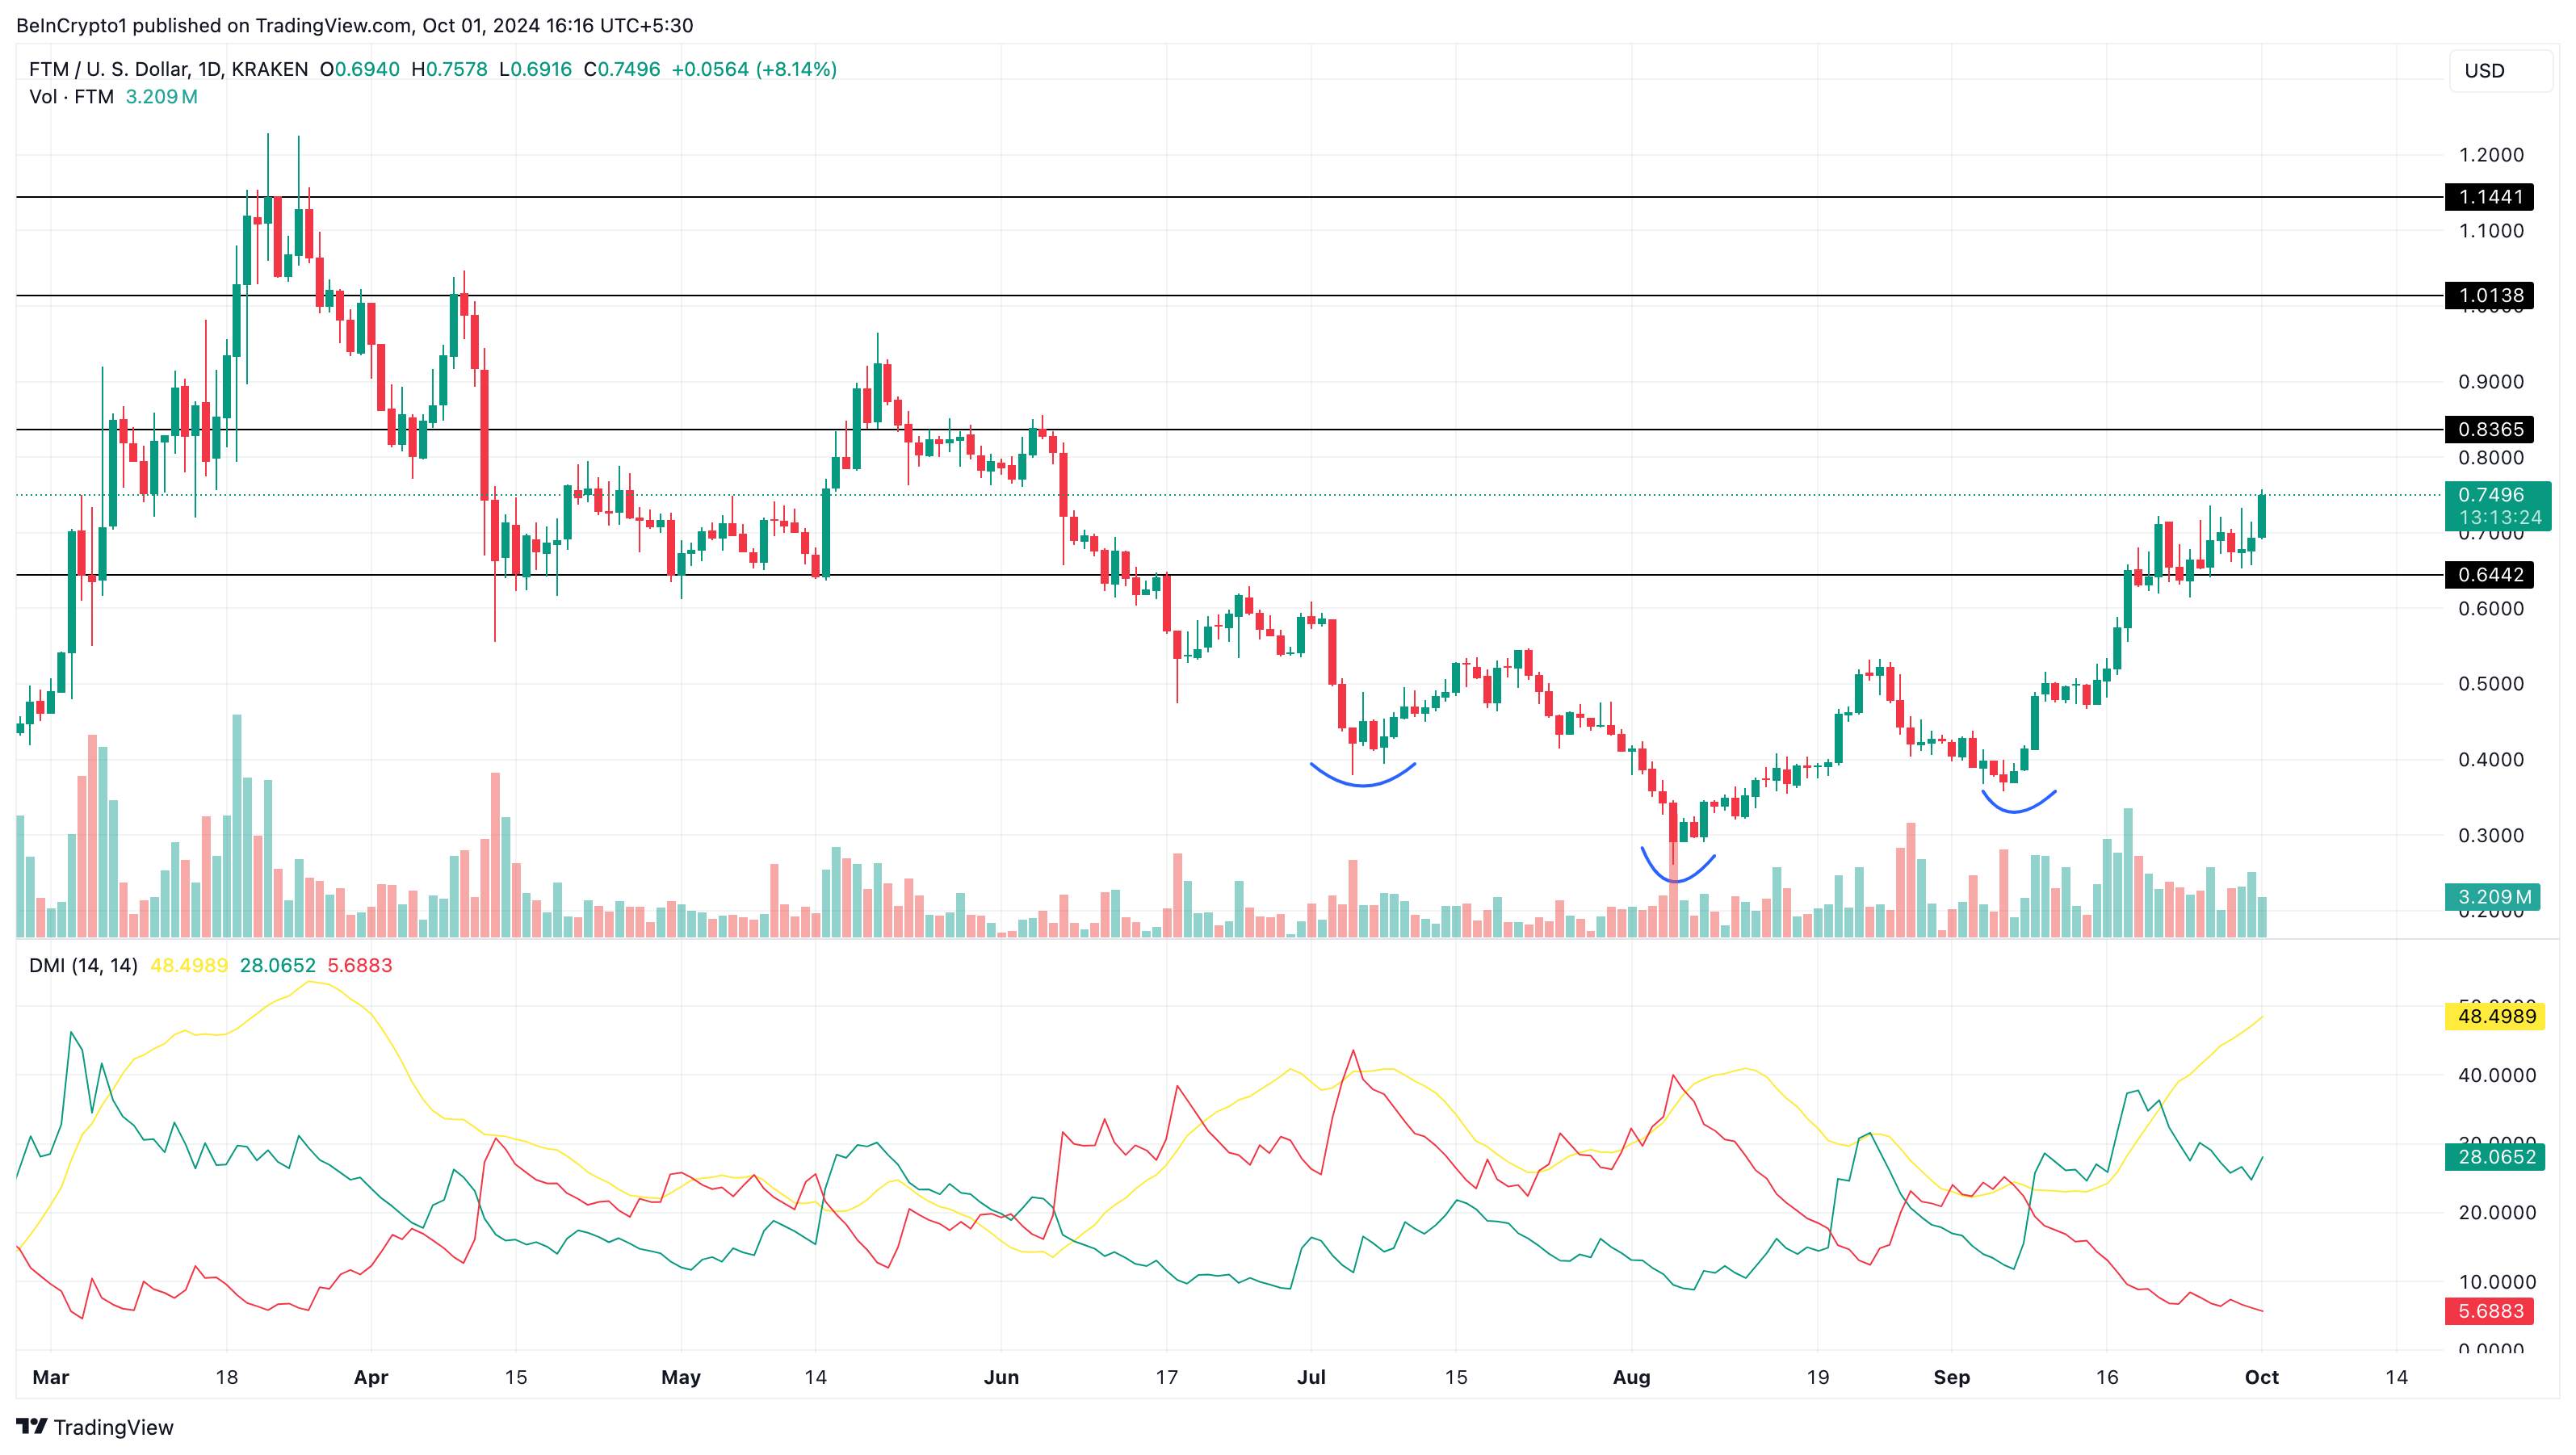
If validated, FTM’s price might surpass the $0.84 resistance in the short term. If that is the case, the altcoin’s next move could be to $1.01 and possibly $1.14. However, the token could pull back if the FTM holder’s book profits in large volume. If that happens, FTM could decline to $1.14.
The post Fantom (FTM) Price Aims for $1, Pushing 100 Million Tokens Into Profit appeared first on BeInCrypto.


Ethereum (ETH) is under pressure once again, dropping around 3% in the last 24 hours and falling below the $1,800 level. This decline is putting several large leveraged positions at risk, including two massive whale vaults on Maker that collectively hold over $235 million worth of ETH.
With on-chain indicators flashing warning signs and technical levels being tested, the stakes are rising for both bulls and bears. As ETH hovers near critical support, the coming days could prove pivotal for its short-term price trajectory.
Ethereum Whales Could Get Liquidated
Ethereum has dropped around 3% in the past 24 hours, slipping below the $1,900 mark once again. This decline is putting pressure on large leveraged positions within the DeFi ecosystem.
According to on-chain data from Lookonchain, two major whale vaults on Maker—one of the leading decentralized lending protocols—are now approaching critical levels.
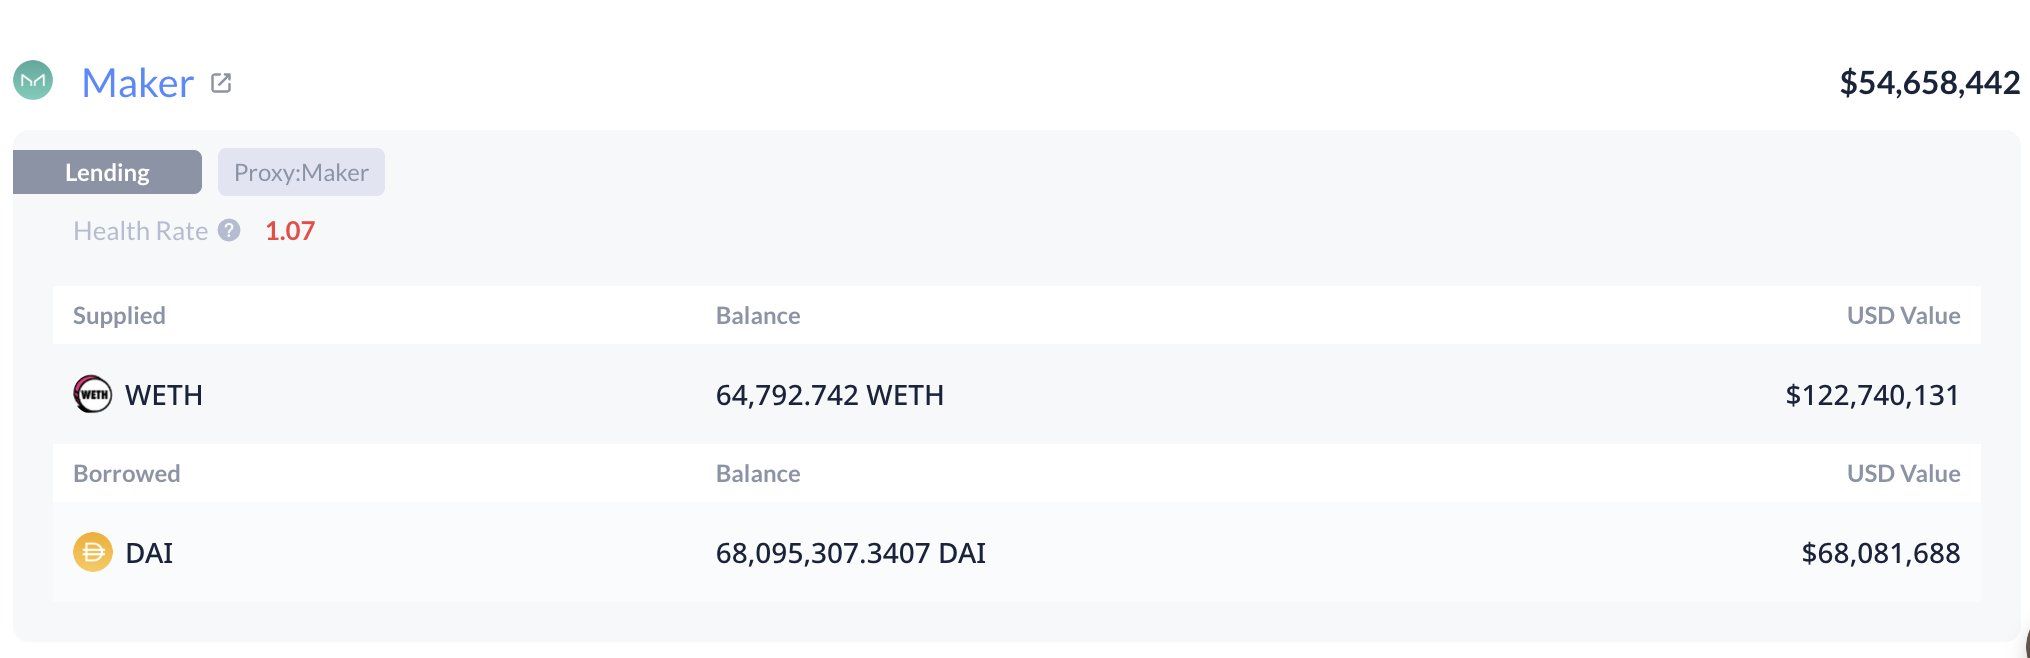
Together, these vaults hold 125,603 ETH, valued at approximately $235 million. With ETH’s price nearing their liquidation thresholds, both vaults are at risk of being forcibly closed if the downward trend continues.
In Maker’s system, users can deposit ETH into vaults as collateral to borrow the DAI stablecoin. To avoid liquidation, the collateral must stay above a certain health ratio—essentially a safety buffer.
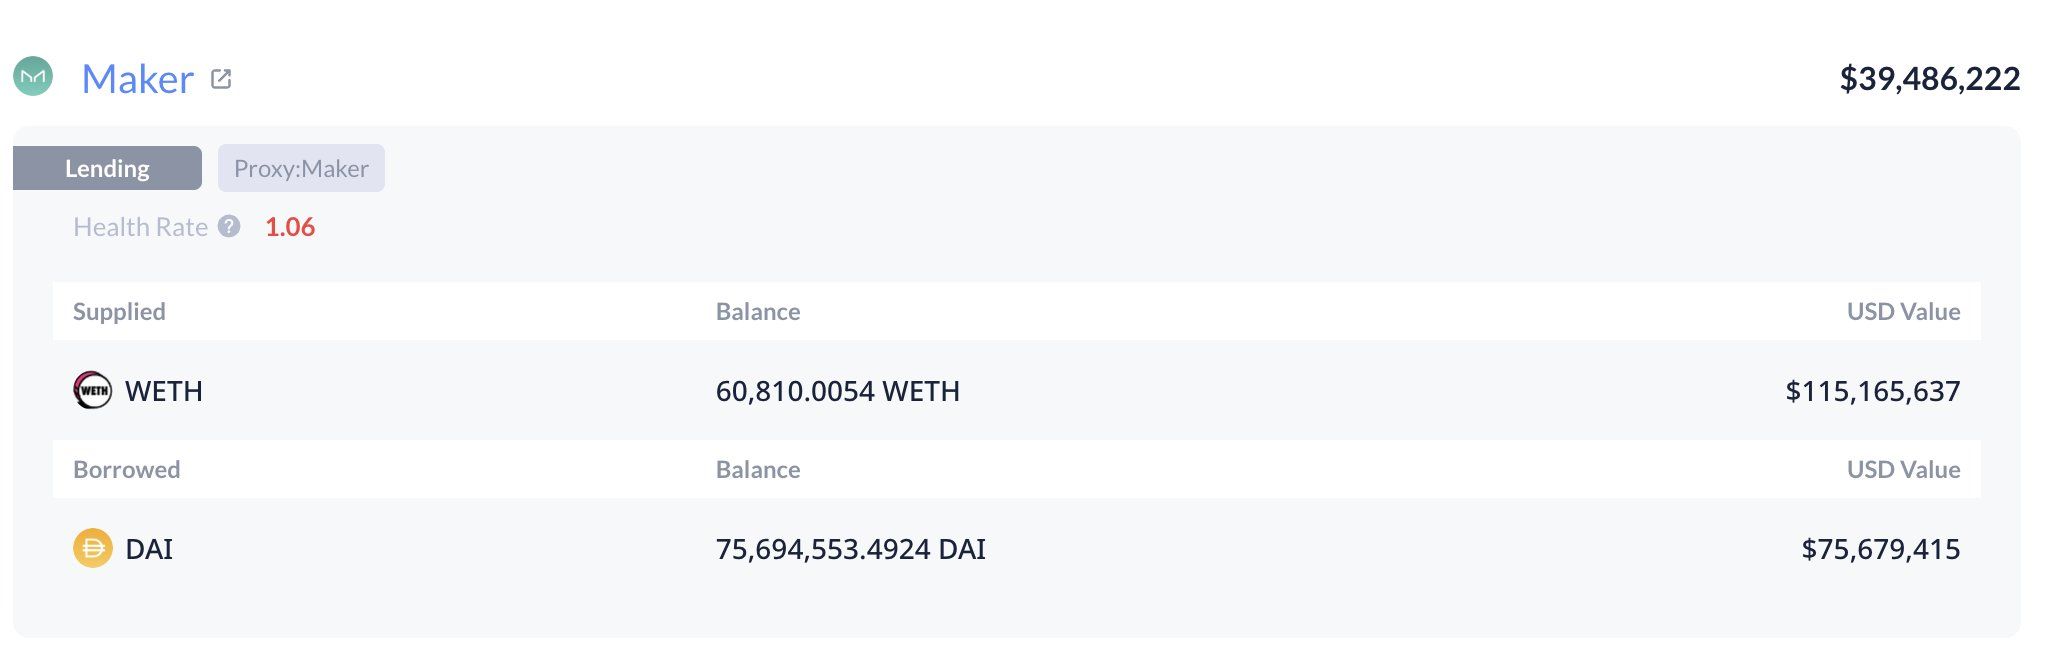
When that buffer gets too low, the protocol automatically sells off the collateral to cover the debt. In this case, the health ratio of the whale positions has fallen to just 1.07, dangerously close to the minimum threshold.
One vault faces liquidation at an ETH price of $1,805, and the other at $1,787. If ETH continues to dip, these vaults could trigger significant sell pressure, potentially accelerating the downward move.
Indicators Suggest The Downtrend Could Continue
Ethereum’s recent price drop has pushed its Relative Strength Index (RSI) back into oversold territory, currently sitting at 24.37. Just three days ago, the RSI was at 58.92, indicating how quickly sentiment has shifted.
The RSI is a momentum indicator that measures the speed and change of price movements, with readings below 30 typically signaling that an asset is oversold.
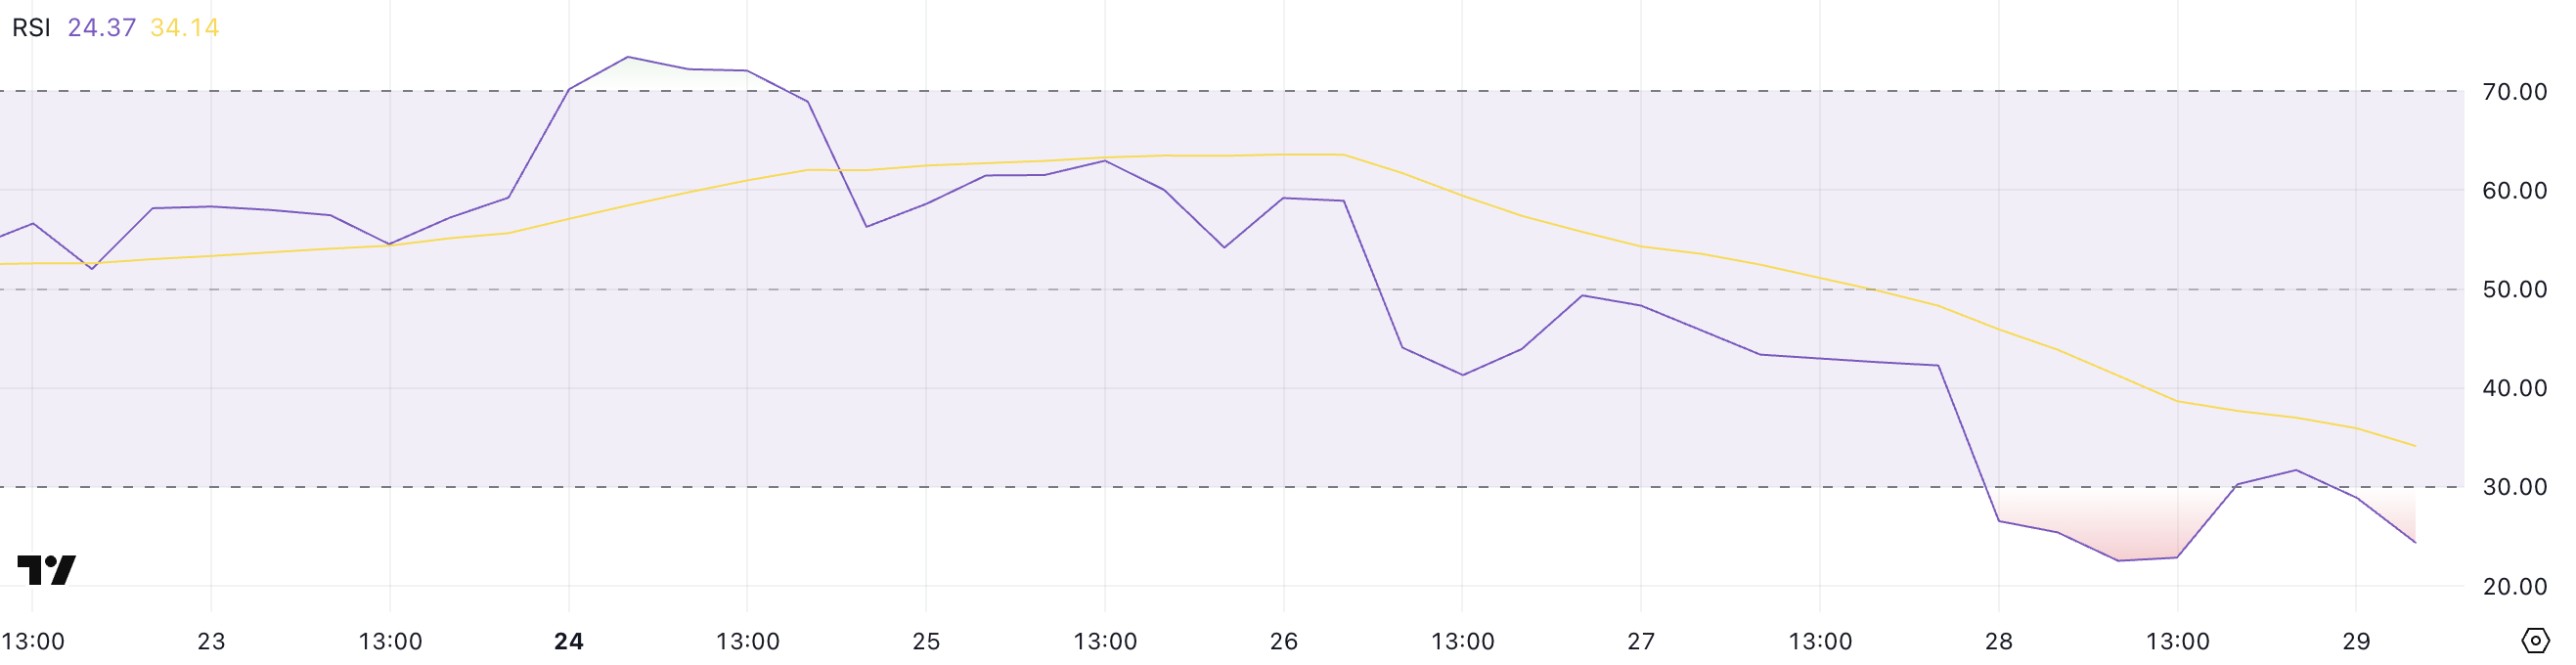
While this suggests that Ethereum may be due for a short-term bounce or relief rally, historical data shows that RSI can remain oversold for extended periods—or even drop further—if bearish momentum stays strong.
Ethereum’s Directional Movement Index (DMI), which signals a strong downtrend, adds to the bearish outlook. The Average Directional Index (ADX), which measures the strength of a trend, surged to 38.6 from 23.47 just a day ago, indicating growing momentum behind the current move.
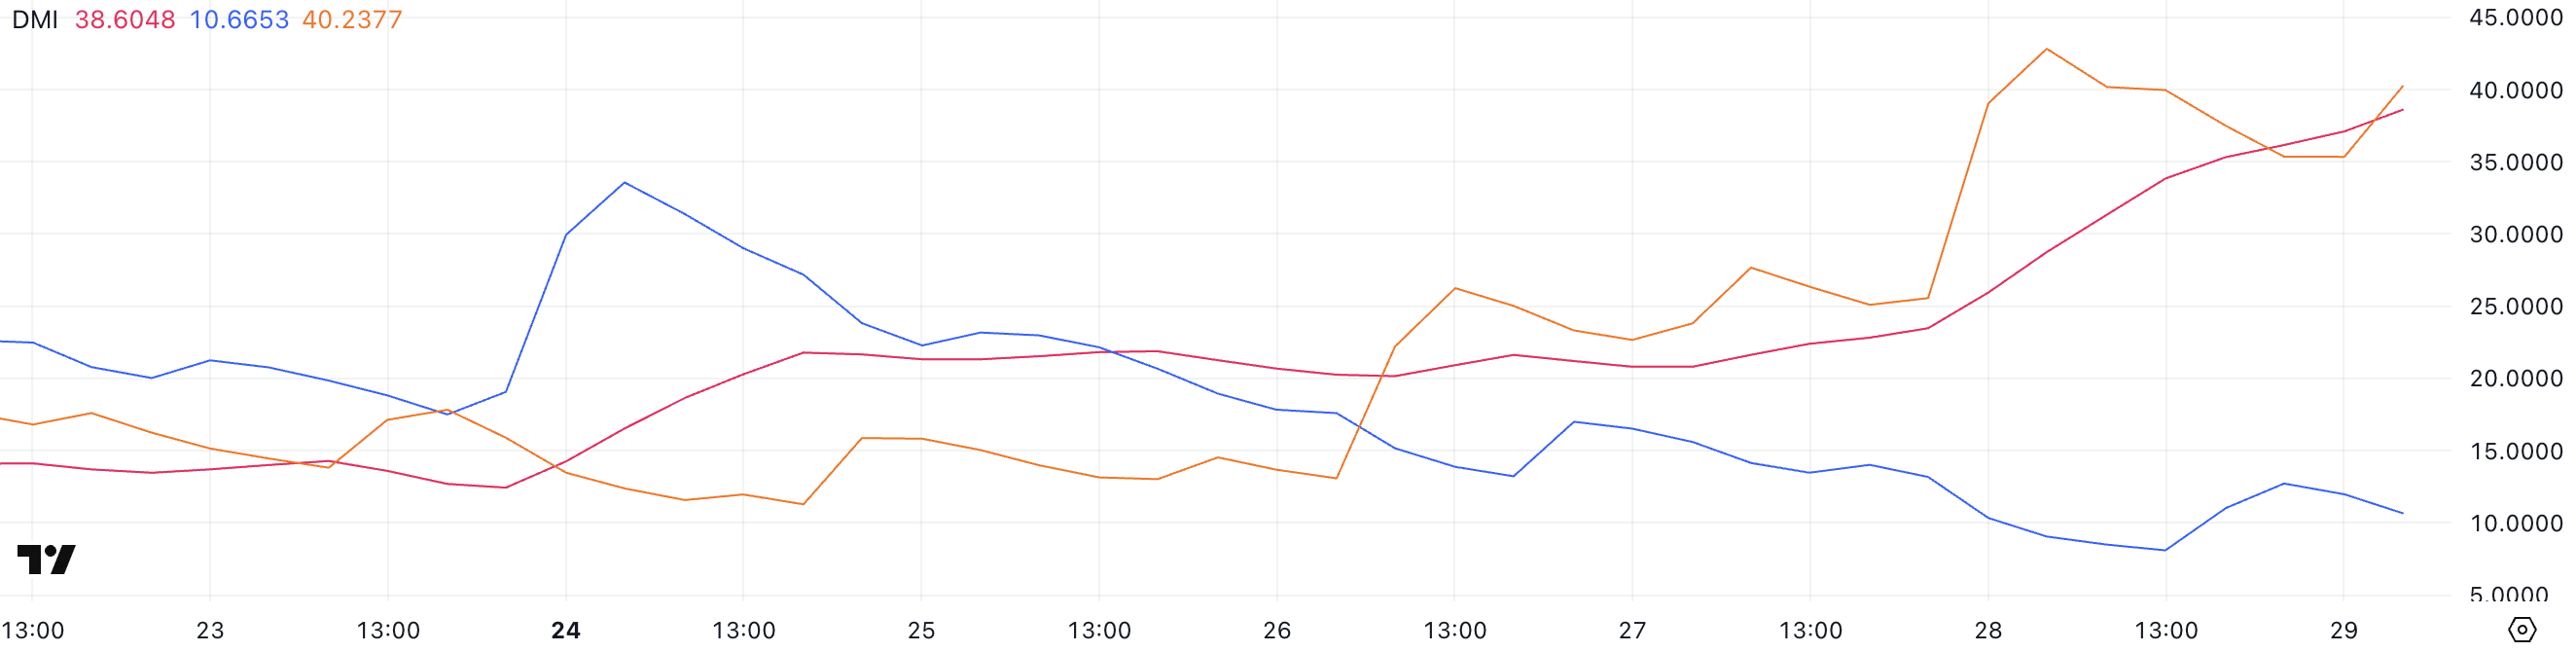
Meanwhile, the +DI (positive directional indicator) has fallen to 10.6, while the -DI (negative directional indicator) has spiked to 40.23, showing that sellers are firmly in control.
This combination—rising ADX, high -DI, and falling +DI—typically suggests an intensifying bearish trend, meaning Ethereum’s price could remain under pressure in the near term despite already being technically oversold.
Will Ethereum Fall Below $1,800 Soon?
If Ethereum’s downtrend continues, the next key level to watch is the support at $1,823. A break below this level could quickly push the price down toward $1,759—a move that would trigger the liquidation of two major whale vaults on Maker, which are already hovering near their thresholds.
These potential liquidations could amplify sell pressure, making it even harder for Ethereum price to stabilize in the short term. Given the current bearish momentum and weak technical indicators, this scenario remains a real risk if bulls fail to step in.
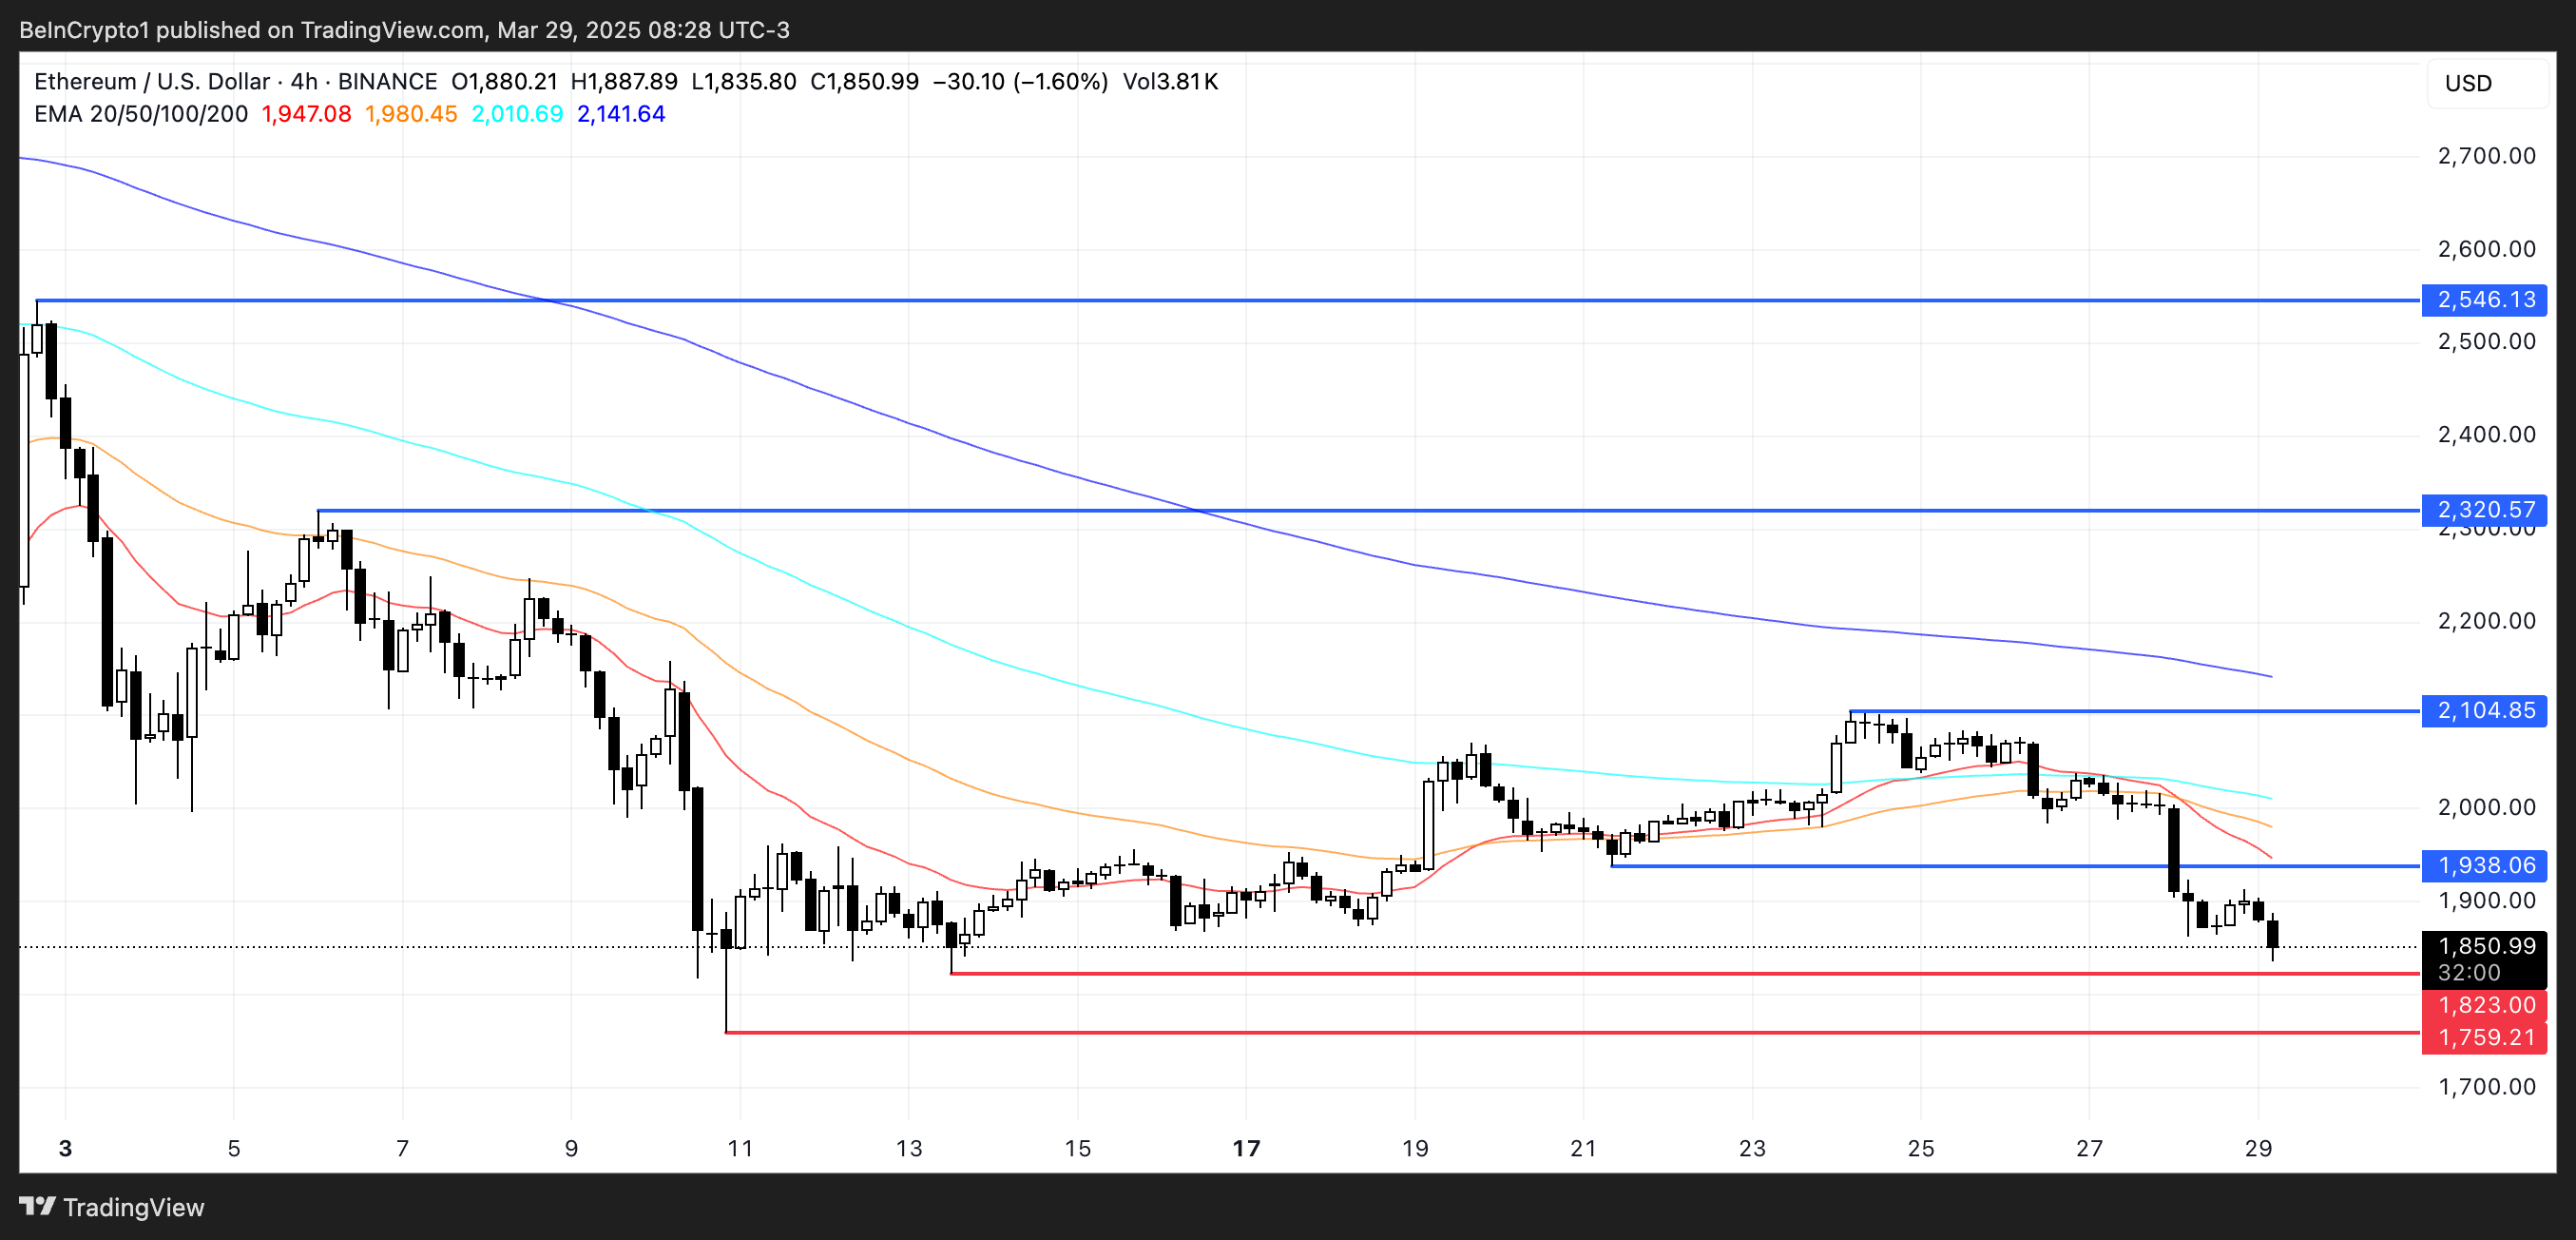
However, if sentiment shifts and the trend reverses, Ethereum could regain ground and test the resistance level at $1,938.
Breaking above that could open the path toward $2,104, a level that has previously acted as both resistance and support. Should buying momentum strengthen further, ETH might continue climbing toward $2,320 and potentially even $2,546.
Disclaimer
In line with the Trust Project guidelines, this price analysis article is for informational purposes only and should not be considered financial or investment advice. BeInCrypto is committed to accurate, unbiased reporting, but market conditions are subject to change without notice. Always conduct your own research and consult with a professional before making any financial decisions. Please note that our Terms and Conditions, Privacy Policy, and Disclaimers have been updated.

More than 100,000 users of popular crypto exchanges Binance and Gemini may be at risk after a trove of sensitive information appeared for sale on the dark web.
The leaked data reportedly includes full names, email addresses, phone numbers, and location details—raising alarms over growing cyber threats in the crypto sector.
Dark Web Actors Are Targeting Crypto Users
On March 27, a dark web user operating under the alias AKM69 listed a large database allegedly tied to Gemini, one of the largest crypto trading platforms in the US.
According to Dark Web Informer, the dataset mainly includes information about users from the United States, with a few entries from Singapore and the United Kingdom. The attacker claims the data could be used for marketing, fraud, or crypto recovery scams.
“The database for sale reportedly includes 100,000 records, each containing full names, emails, phone numbers, and location data of individuals from the United States and a few entries from Singapore and the UK,” the report stated.
It is unclear whether the leak resulted from a direct breach of Gemini’s systems or from other vulnerabilities, such as compromised user accounts or phishing campaigns.
Meanwhile, this incident followed another alarming listing on March 26.
According to the report, a separate dark web actor, kiki88888, allegedly offered a trove of Binance user data for sale. The database is said to hold over 132,000 entries, including the exchange users’ login information.
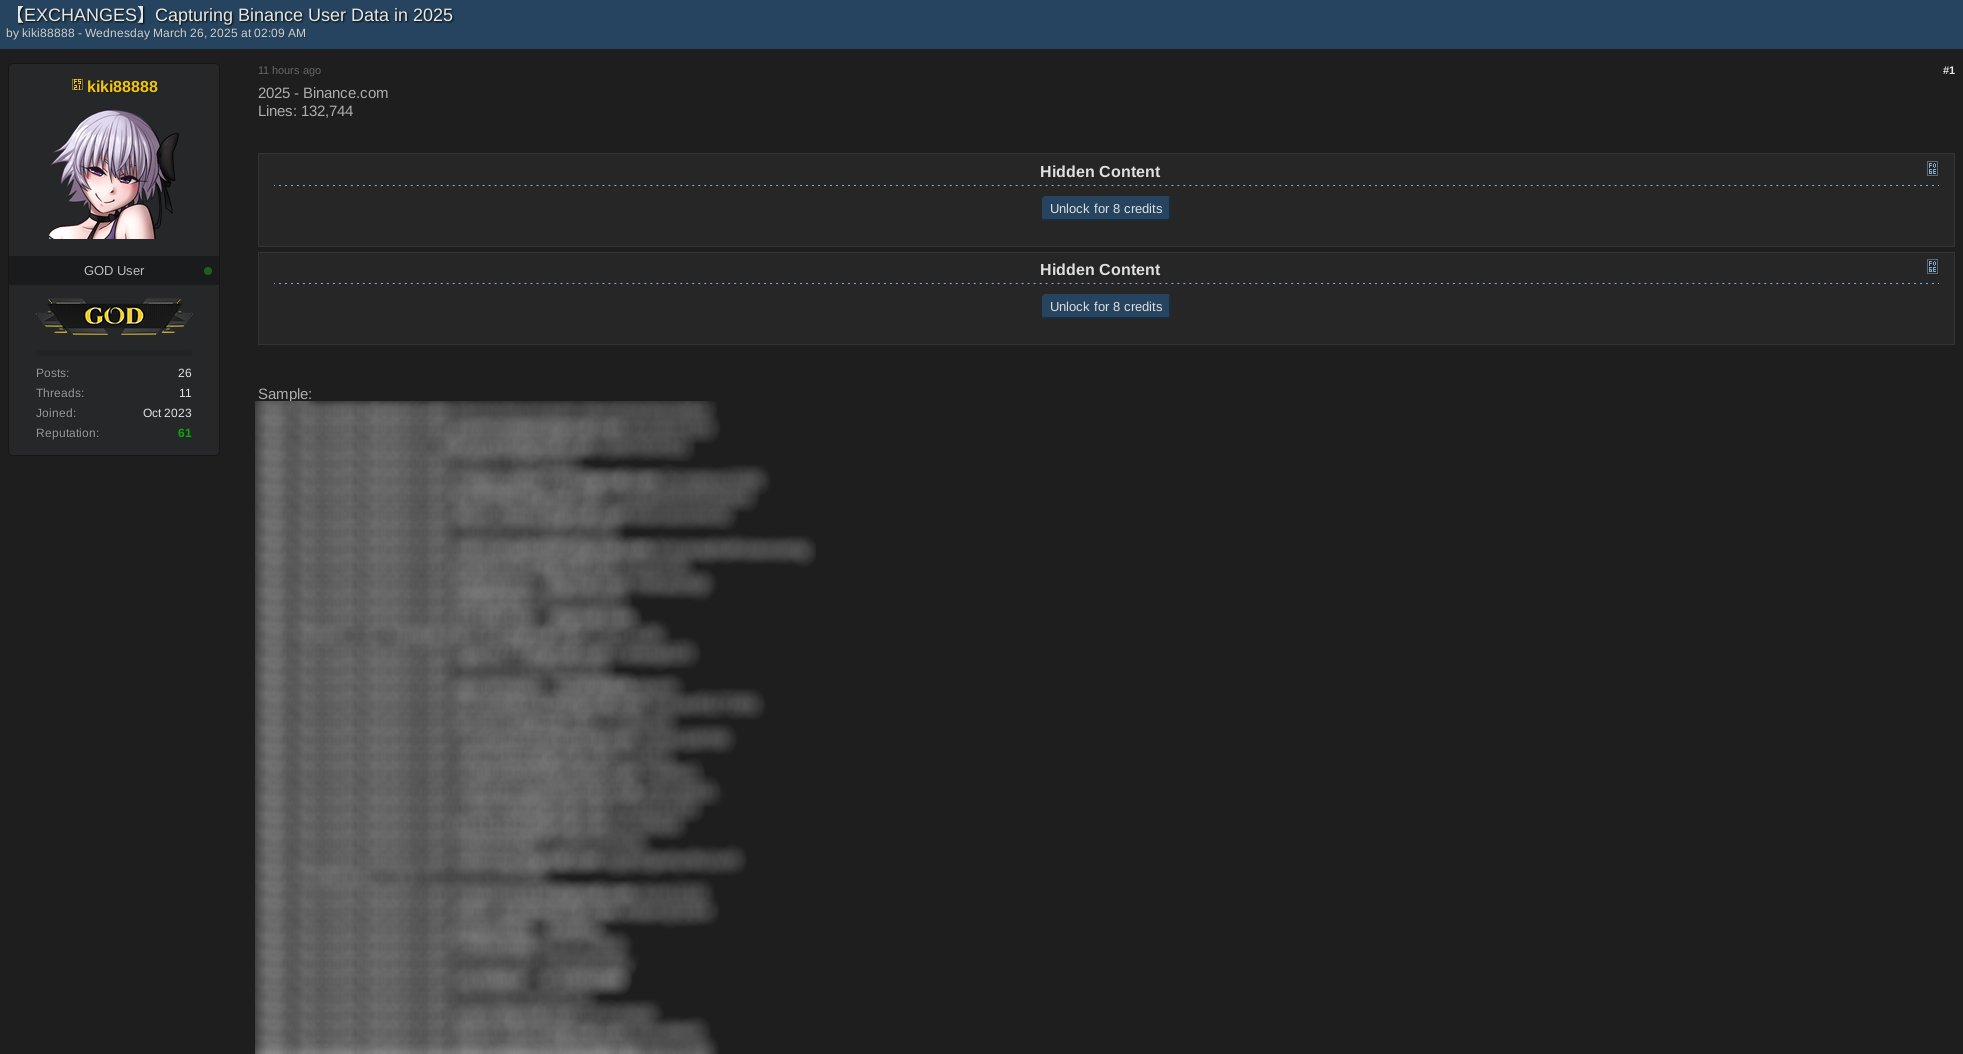
The Dark Web Informer suggests phishing attacks likely caused the breach rather than a compromise of the exchange’s systems.
“Some of you really need to stop clicking random stuff,” the Informer stated.
Binance and Gemini have yet to publicly comment on these incidents. However, phishing remains one of the most effective methods cybercriminals use to exploit crypto holders.
Scammers often impersonate official accounts or place misleading ads that redirect users to fake websites. Coinbase users are also being extensively targeted through phishing campaigns.
As BeInCrypto reported earlier, in March, Coinbase users lost over $46 million to social engineering scams.
Blockchain security firm Scam Sniffer revealed that phishing-related losses exceeded $15 million in the first two months of the year. This figure highlights the growing scale of the threat.
Given the rising threats, crypto users should stay vigilant and avoid unfamiliar links. They should also protect their accounts with two-factor authentication and hardware wallets whenever possible.
Disclaimer
In adherence to the Trust Project guidelines, BeInCrypto is committed to unbiased, transparent reporting. This news article aims to provide accurate, timely information. However, readers are advised to verify facts independently and consult with a professional before making any decisions based on this content. Please note that our Terms and Conditions, Privacy Policy, and Disclaimers have been updated.

Representative Jordan Pace introduced legislation to create a Bitcoin Reserve for South Carolina, joining a nationwide effort. Currently, nearly half of all US states have an active bill to create a similar Reserve.
However, the talking point that this bill “allows 10% of state funds” in Bitcoin investments is taking off like wildfire. It may scare off fiscal conservatives, which contributed to recent failures.
South Carolina Joins the Bitcoin Reserve Race
Since President Trump announced his intention to create a US Bitcoin Reserve, many state governments have attempted to create smaller models.
In the last month, these efforts have been intensifying, with more and more states joining the effort. Today, South Carolina filed its own Bitcoin Reserve bill, allowing the state to make substantial purchases:
“The State Treasurer may invest in digital assets including, but not limited to, Bitcoin with money that is unexpended, unencumbered, or uncommitted. The amount of money that the State Treasurer may invest in digital assets from a fund specified in this section may not exceed ten precent of the total funds under management,” it reads.
State Representative Jordan Pace proposed South Carolina’s Bitcoin Reserve legislation. He claimed that this bill “gives the Treasurer new tools to protect taxpayer dollars from inflation,” one of crypto’s most well-known use cases. Pace is currently the bill’s only sponsor, and it’s unclear what chances it has of passing.
Still, there may be challenges ahead. Similar proposals in other Republican-led states—like Montana and Wyoming—have already failed. This was largely due to concerns over using public funds to buy cryptocurrency.
Even though Trump backs the idea on a national level, not all GOP lawmakers are convinced at the state level.
That said, there are some signs of progress elsewhere. For example, Texas has advanced its Bitcoin Reserve bill, achieving bipartisan support. A key reason for its success is that the bill doesn’t require the state to make crypto purchases; it simply allows them at the Treasurer’s discretion.
Likewise, South Carolina’s bill wouldn’t force the state to invest 10% of its funds into Bitcoin. It just opens the door for that possibility, giving the state financial flexibility rather than a mandate.
Disclaimer
In adherence to the Trust Project guidelines, BeInCrypto is committed to unbiased, transparent reporting. This news article aims to provide accurate, timely information. However, readers are advised to verify facts independently and consult with a professional before making any decisions based on this content. Please note that our Terms and Conditions, Privacy Policy, and Disclaimers have been updated.

Ethereum Drops As Two Whales Face $235 Million Liquidation Risk

Dark Web Criminals Are Selling Binance and Gemini User Data

Bitcoin Price Could Surge To $95,000 — But Analyst Sounds ‘Bull Trap’ Alarm

Ethereum Breakdown, Analyst Eyes $1,130–$1,200 Price Target
Did XRP Price Just Hit $21K? Live TV Display Error Goes Viral

El Salvador’s Nayib Bukele Open to White House Visit

2.52 Million Altcoins Are Ruining Crypto’s Future

Animoca Brands Valuation Tanks 75% In Two Years, Here’s Why

Crypto exchange BingX hacked for $43 million

Are The Big Players Losing Interest?

Hong Kong’s Securities Association Tips Authorities On Crypto Self-Regulation

Coinbase cbBTC Set to go Live on Solana
2.52 Million Altcoins Are Ruining Crypto’s Future
Animoca Brands Valuation Tanks 75% In Two Years, Here’s Why
Crypto exchange BingX hacked for $43 million
Are The Big Players Losing Interest?
Hong Kong’s Securities Association Tips Authorities On Crypto Self-Regulation
Coinbase cbBTC Set to go Live on Solana
-

 Regulation21 hours ago
FDIC Revises Crypto Guidelines Allowing Banks To Enter Digital Assets
-
 Regulation24 hours ago
AVAX Price Eyes Rally To $44 As Grayscale Files For Avalanche ETF
-
 Regulation19 hours ago
US SEC Drops Charges Against Hawk Tuah Girl Hailey Welch
-
 Market23 hours ago
A Threat to Crypto’s Decentralized Future?
-
 Altcoin23 hours ago
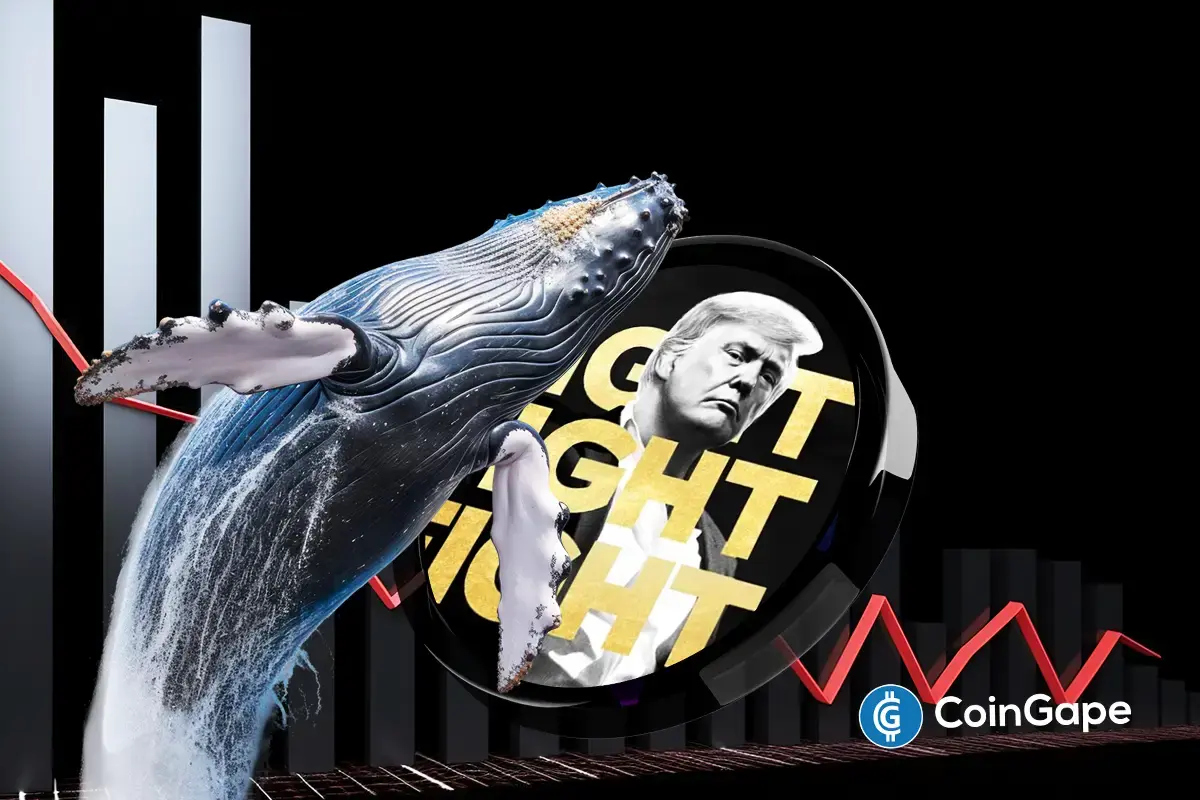
TRUMP Crypto Whale Incurs Massive $15M Loss Amid Price Slump, Here’s How
-

 Market22 hours ago
Popular Analyst Peter Brandt Identifies XRP Head & Shoulder Pattern, Reveals Path To Take
-

 Market21 hours ago
What to Expect from XRP Price in April 2025
-

 Market16 hours ago
Why Did MUBARAK Drop 40% Despite Binance Listing?