
Market
What Major Holder Activity Shows

FET price is showing some unusual patterns that could impact its direction in the near future. Recent activity from major holders has caught attention, raising questions about what’s next for the token. While certain indicators point to potential gains, others suggest there might be caution among larger investors.
These conflicting signals are creating uncertainty around the short-term outlook. With the market closely watching, FET’s next move could be pivotal.
FET Whales Are Sending Paradoxical Signs
Big holders of FET have been showing paradoxical signs in recent days. Monitoring the actions of a coin’s whales is crucial because it provides insights into potential market moves, as large-scale holders can influence the price with their buy or sell decisions.
On September 28, there were 69 holders with between 100,000 and 1,000,000 FET tokens, and by September 30, this number had risen to 82, marking an 18% increase in just a few days. However, during the same period, holders with between 1,000,000 and 10,000,000 FET tokens dropped from 13 to 10.
Read more: Top 9 Artificial Intelligence (AI) Cryptocurrencies in 2024
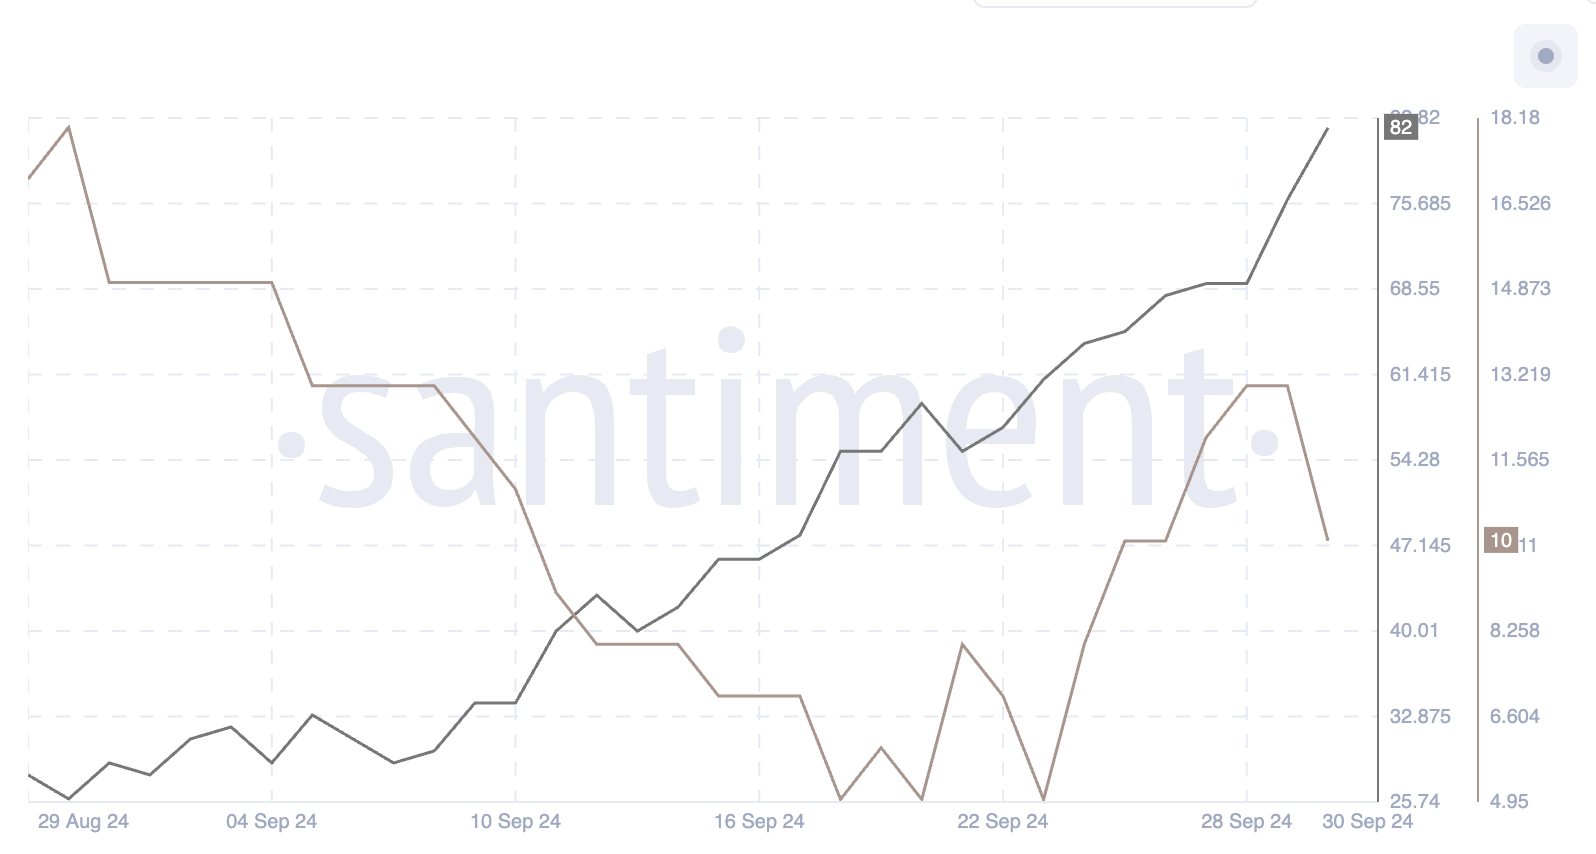
This situation is unusual because while smaller large holders are accumulating, the biggest holders are reducing their positions, which could indicate a mixed sentiment in the market.
For FET’s price, this divergence might suggest some short-term upward momentum from new buyers, but the retreat of the largest holders could signal caution or potential selling pressure ahead.
Social Dominance Is Down
FET’s Social Dominance 7-day Moving Average has seen a sharp decline, falling to 0.123%, down from 0.336% just a day ago and 0.668% on September 24. This decline matters because social dominance measures the level of attention and discussion a coin is receiving relative to the overall market.
A drop in this metric suggests fading interest or hype around the asset. Reduced social buzz often aligns with lower buying activity or enthusiasm from retail investors, indicating that excitement around FET may be waning for the time being.
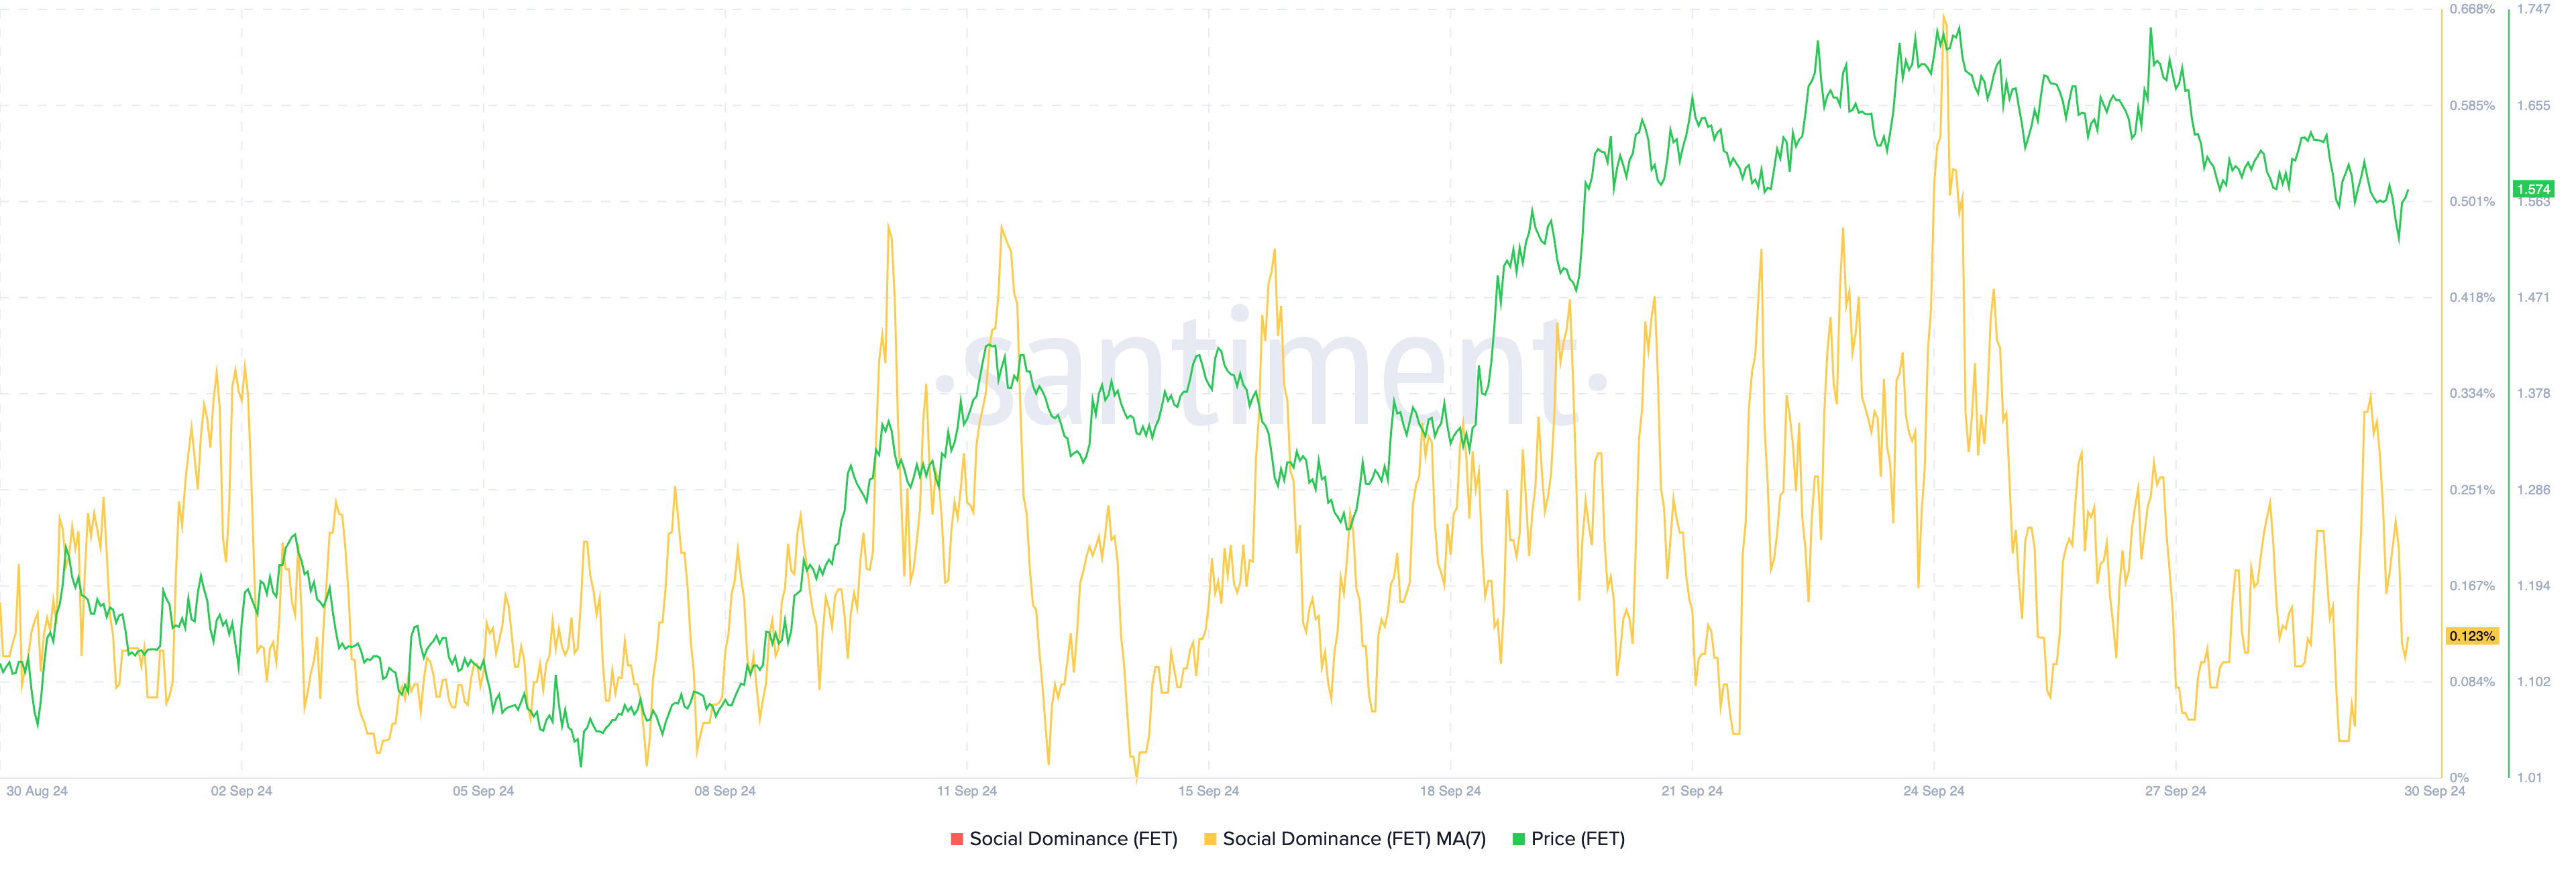
However, it’s important to note that FET’s Social Dominance 7D MA hovered around 0.123% last month as well, yet that didn’t stop its price from climbing in the following days.
For example, between September 7 and September 12, FET rose from $1.07 to $1.42, showing that even with low social dominance, price increases are still possible if other factors drive demand.
FET Price Prediction: Can It Reach $1.87 Soon?
According to the In/Out of the Money Around Price chart, FET faces strong resistance at $1.68 and weaker resistance at $1.73. If these levels are broken, FET could quickly rise to $1.87, offering a potential gain of 14.7%. That could be driven by all the hype around artificial intelligence coins, which appear to be on the rise lately.
The In/Out of the Money Around Price metric tracks the distribution of holders who are in profit (in the money) or at a loss (out of the money) based on their entry price, providing insights into where selling pressure or buying support might come from.
It highlights key resistance levels at which holders might sell to secure profits and support levels at which buyers may step in to prevent further decline.
Read more: How To Invest in Artificial Intelligence (AI) Cryptocurrencies?
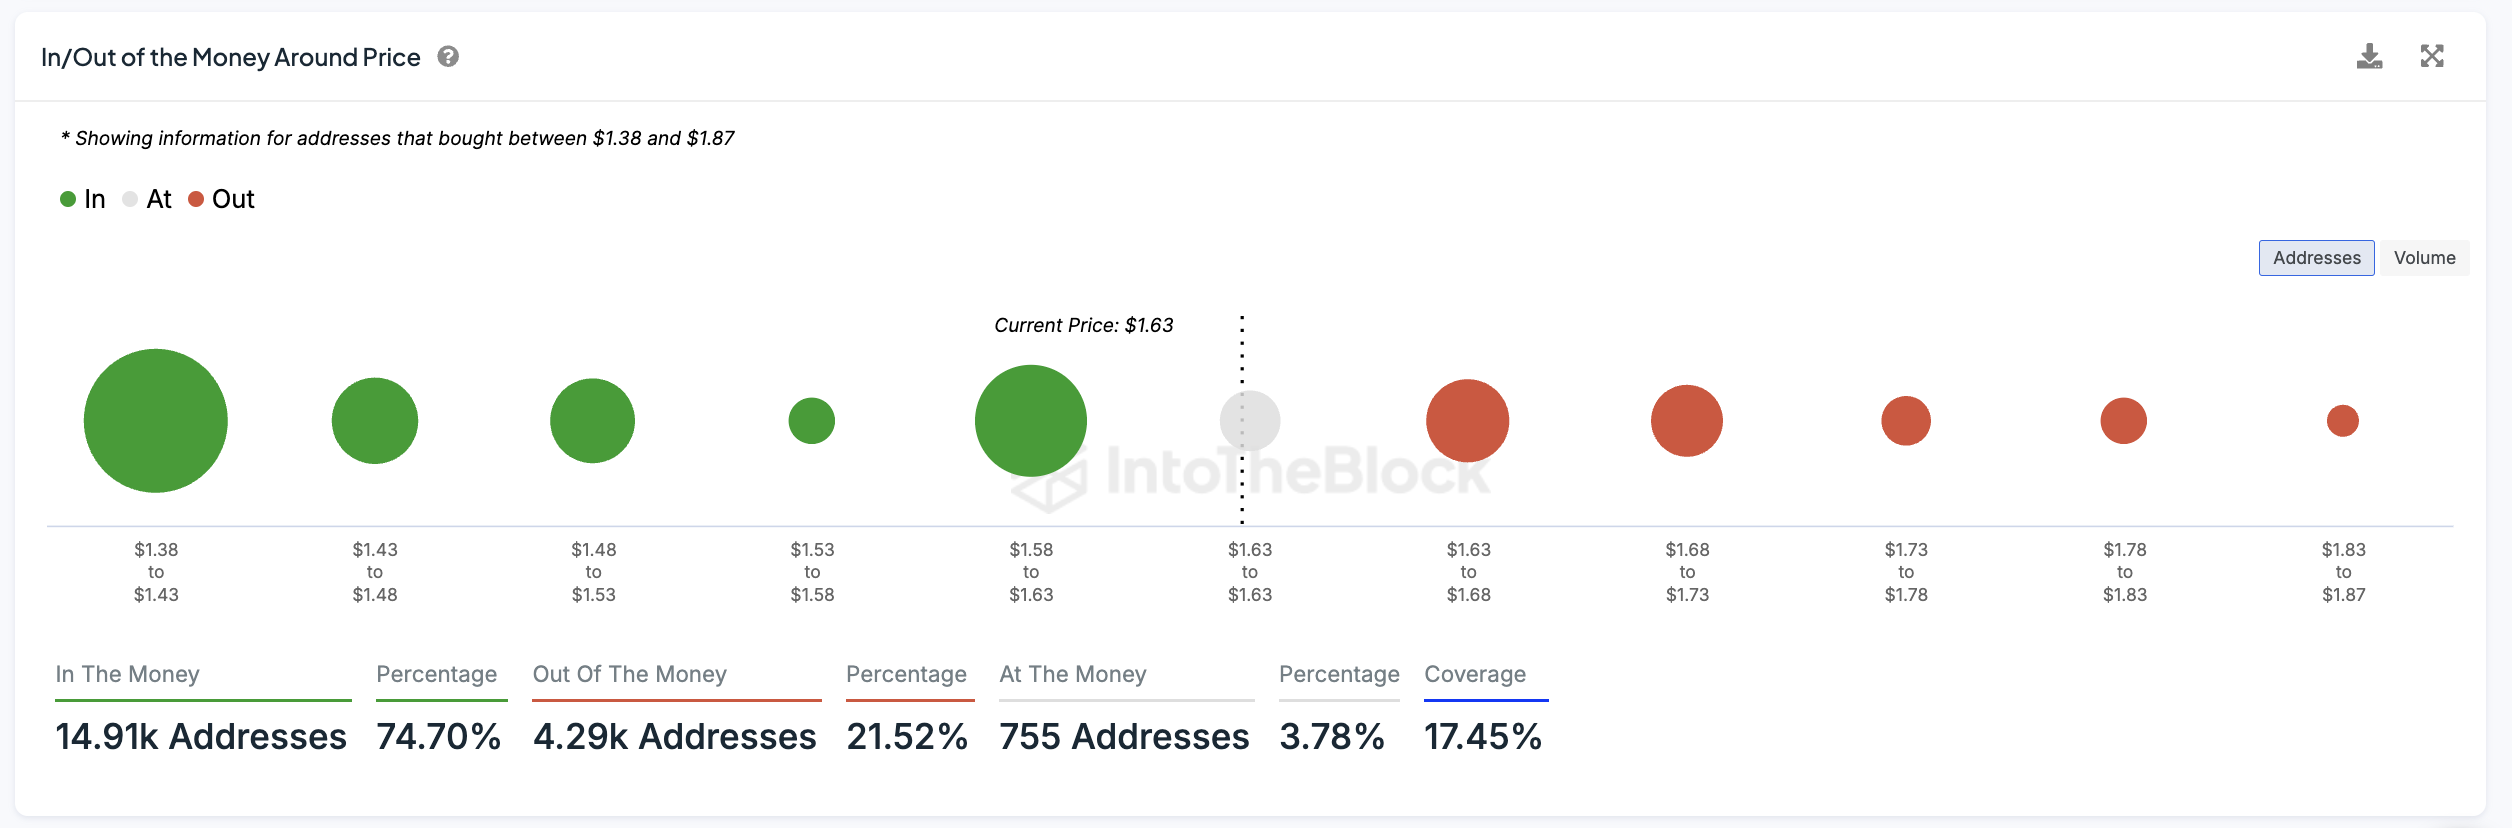
However, if FET’s current trend reverses, there’s strong support at $1.58, but if that fails to hold, the price could drop as low as $1.38, indicating significant downside risk.
Disclaimer
In line with the Trust Project guidelines, this price analysis article is for informational purposes only and should not be considered financial or investment advice. BeInCrypto is committed to accurate, unbiased reporting, but market conditions are subject to change without notice. Always conduct your own research and consult with a professional before making any financial decisions. Please note that our Terms and Conditions, Privacy Policy, and Disclaimers have been updated.


Hedera Foundation’s recent move to partner with Zoopto for a late-stage bid to acquire TikTok has sparked renewed investor interest in HBAR, driving a fresh wave of demand for the altcoin.
Market participants have grown increasingly bullish, with a notable uptick in long positions signaling growing confidence in HBAR’s future price performance.
HBAR’s Futures Market Sees Bullish Spike
HBAR’s long/short ratio currently sits at a monthly high of 1.08. Over the past 24 hours, its value has climbed by 17%, reflecting the surge in demand for long positions among derivatives traders.
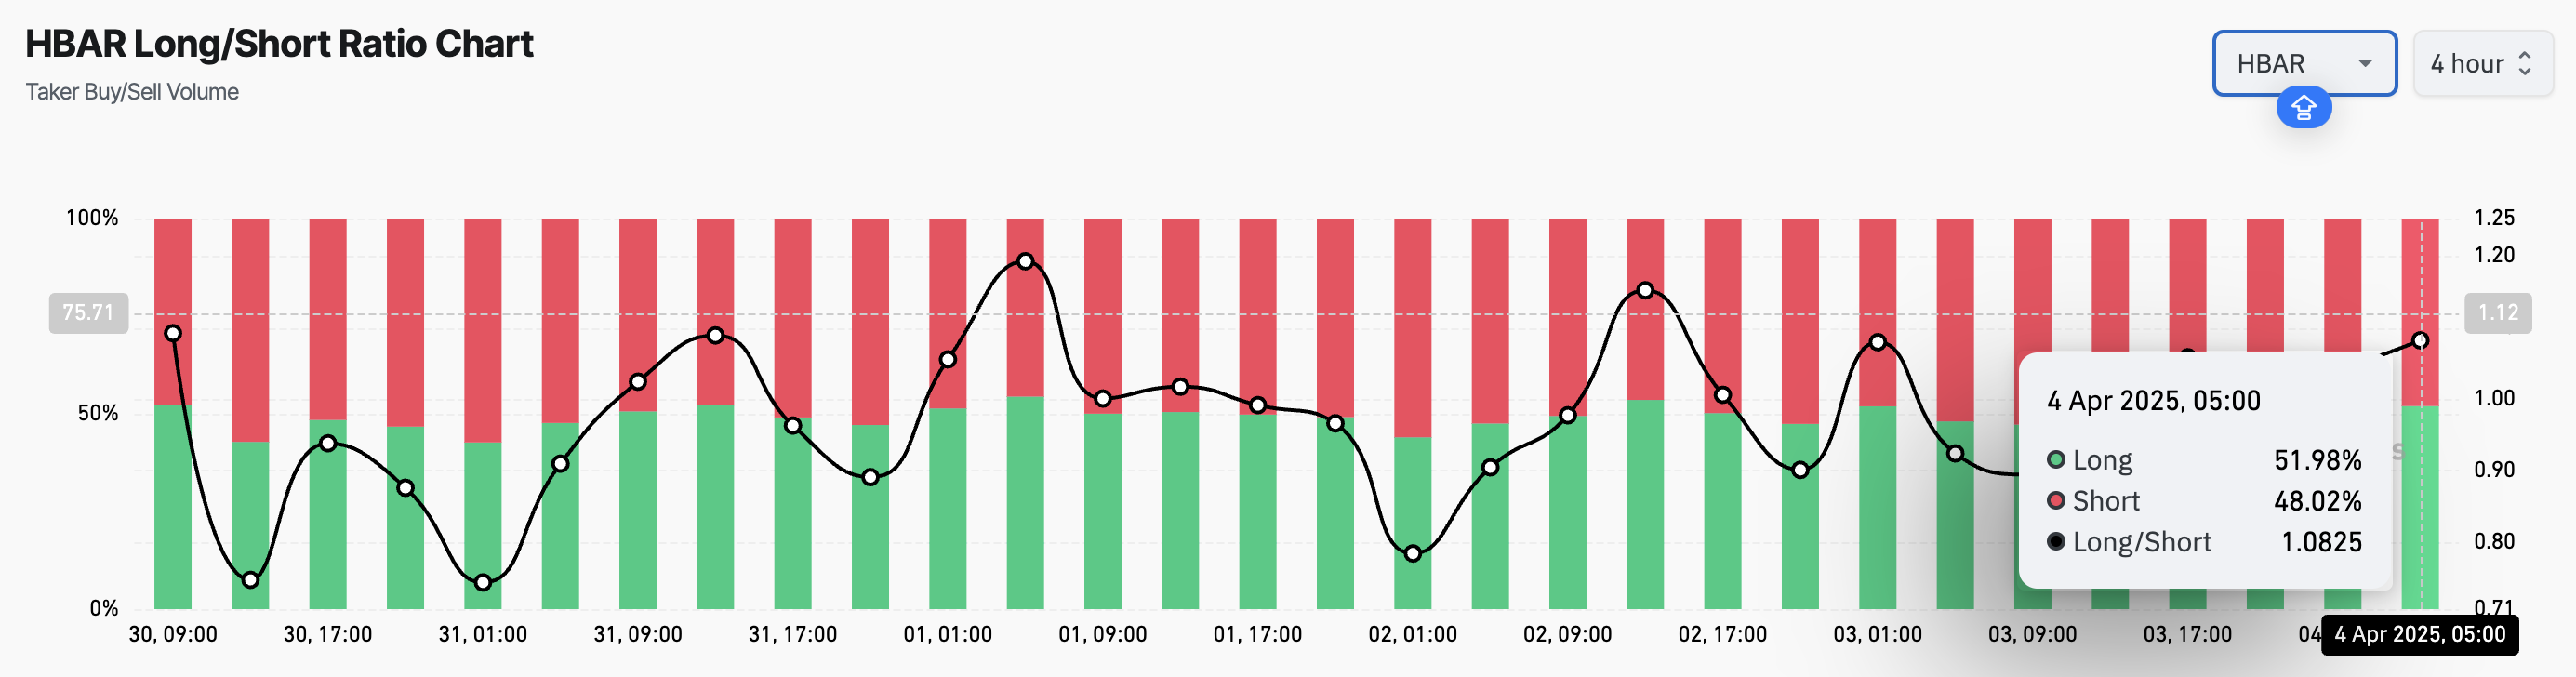
An asset’s long/short ratio compares the proportion of its long positions (bets on price increases) to short ones (bets on price declines) in the market.
When the long/short ratio is above one like this, more traders are holding long positions than short ones, indicating bullish market sentiment. This suggests that HBAR investors expect the asset’s price to rise, a trend that could drive buying activity and cause HBAR’s price to extend its rally.
Further, the token’s Balance of Power (BoP) confirms this bullish outlook. At press time, this bullish indicator, which measures buying and selling pressure, is above zero at 0.25.
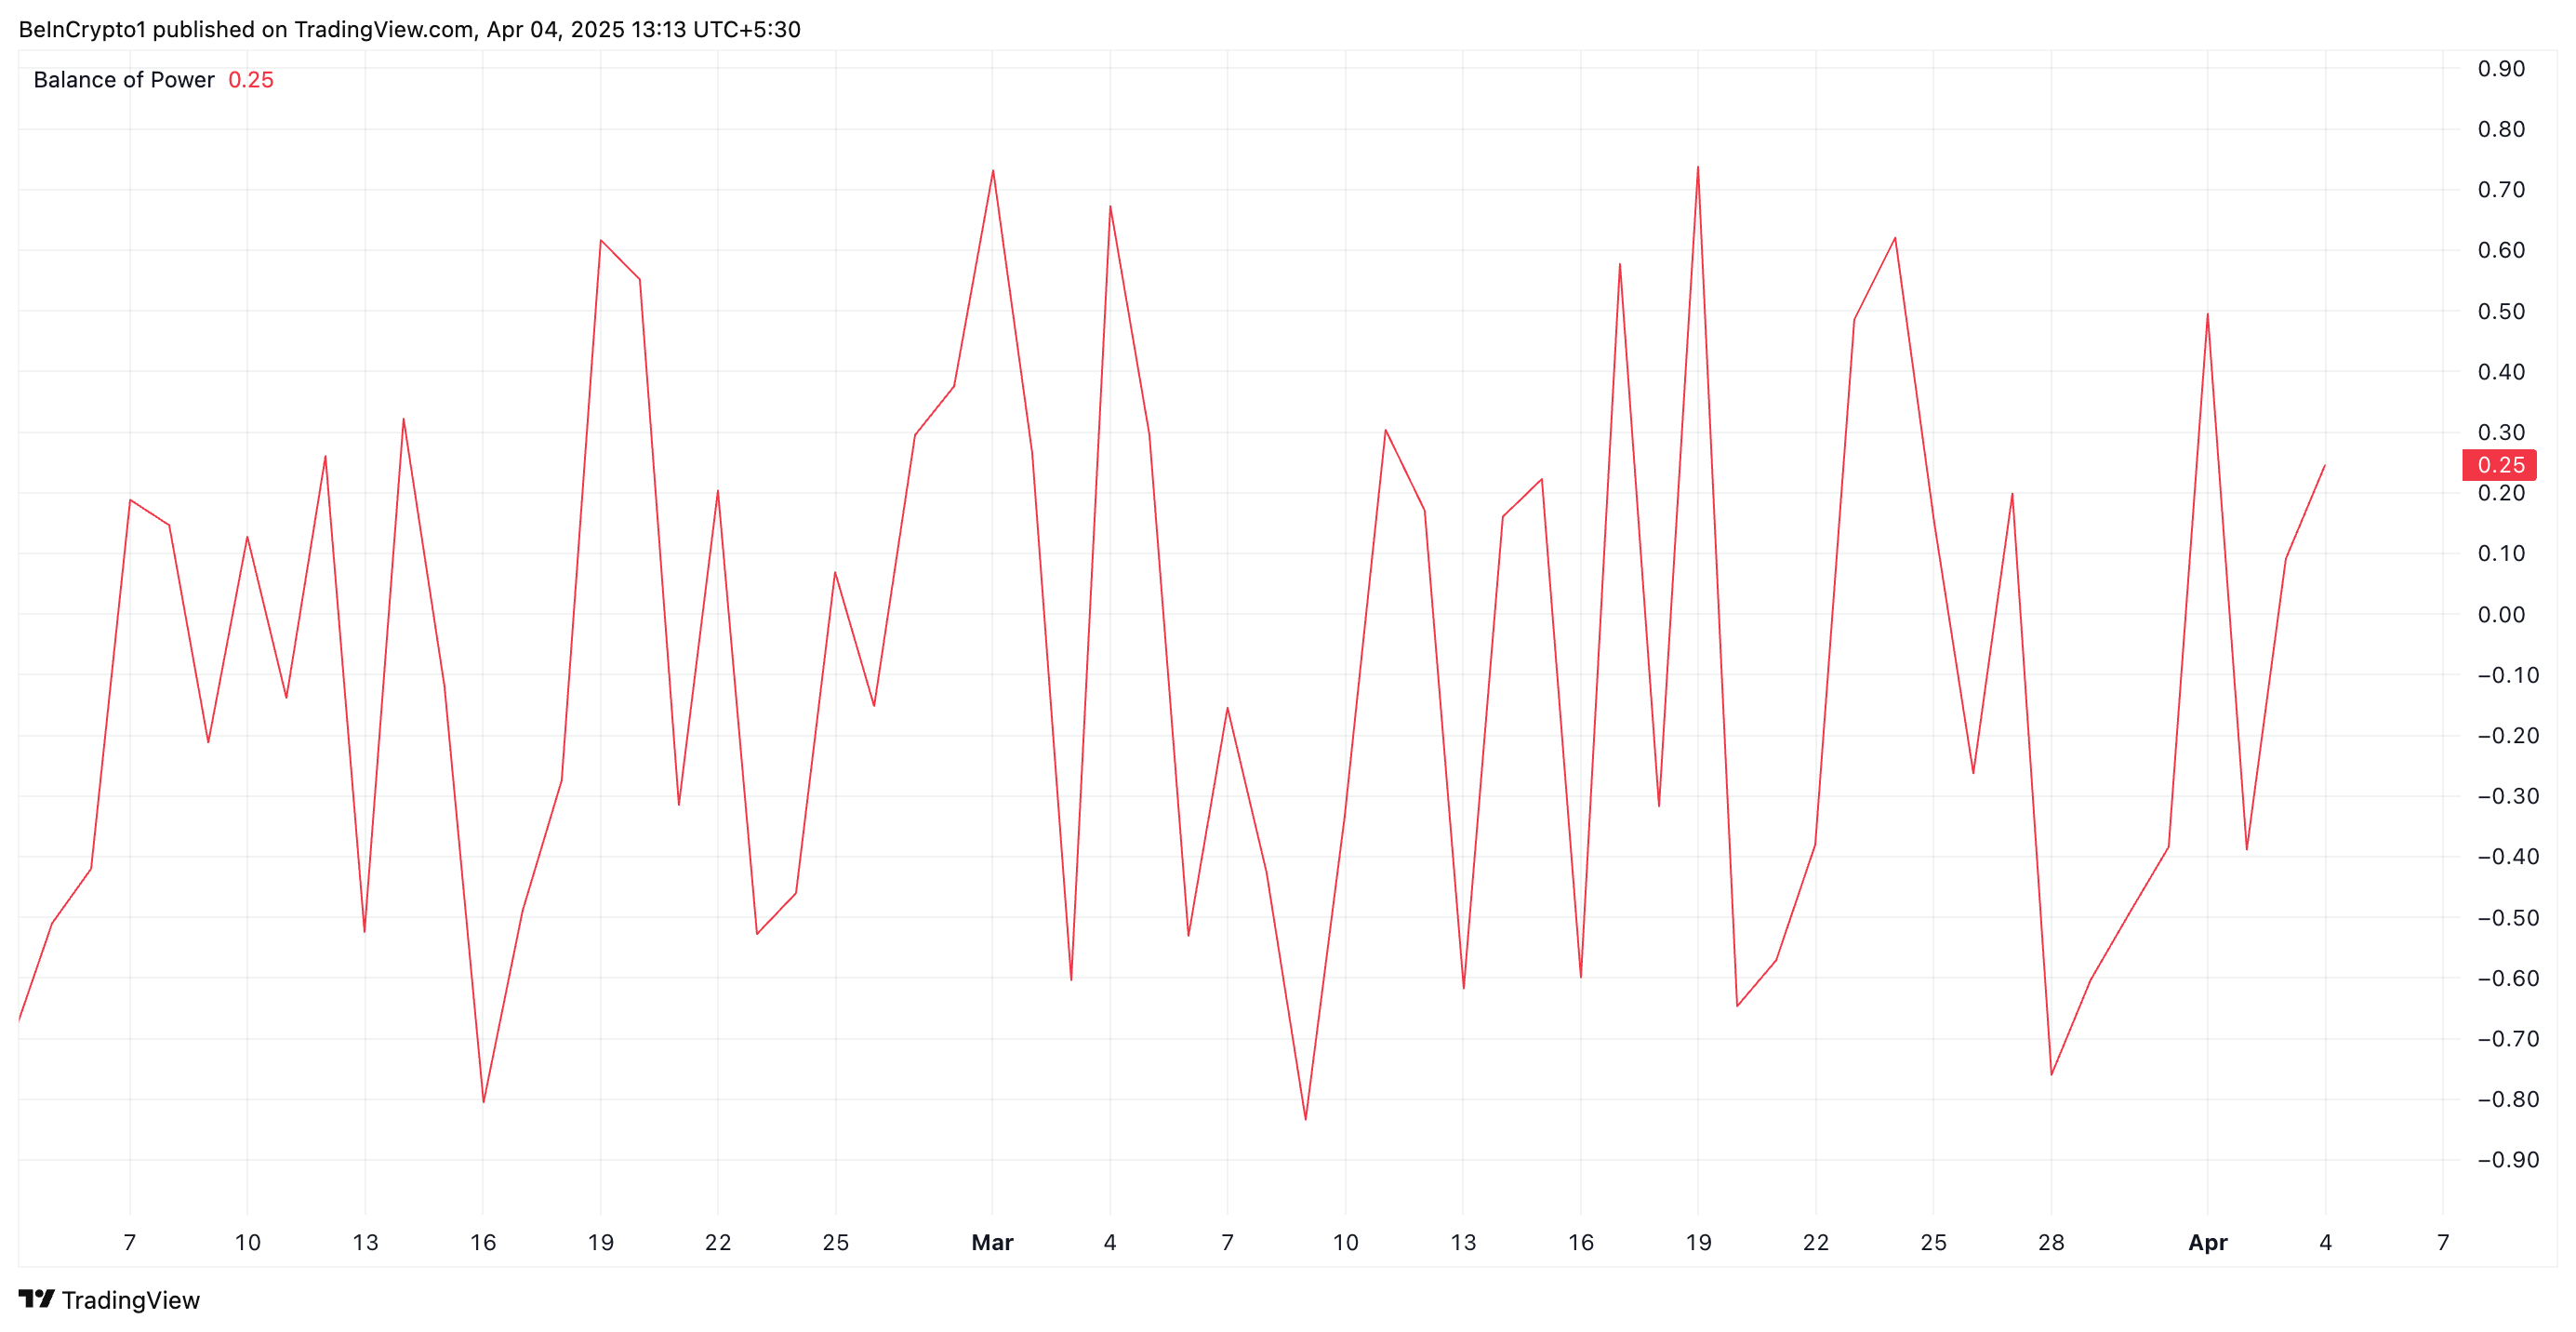
When an asset’s BoP is above zero, buying pressure is stronger than selling pressure, suggesting bullish momentum. This means HBAR buyers dominate price action, and are pushing its value higher.
HBAR Buyers Push Back After Hitting Multi-Month Low
During Thursday’s trading session, HBAR traded briefly at a four-month low of $0.153. However, with strengthening buying pressure, the altcoin appears to be correcting this downward trend.
If HBAR buyers consolidate their control, the token could flip the resistance at $0.169 into a support floor and climb toward $0.247.
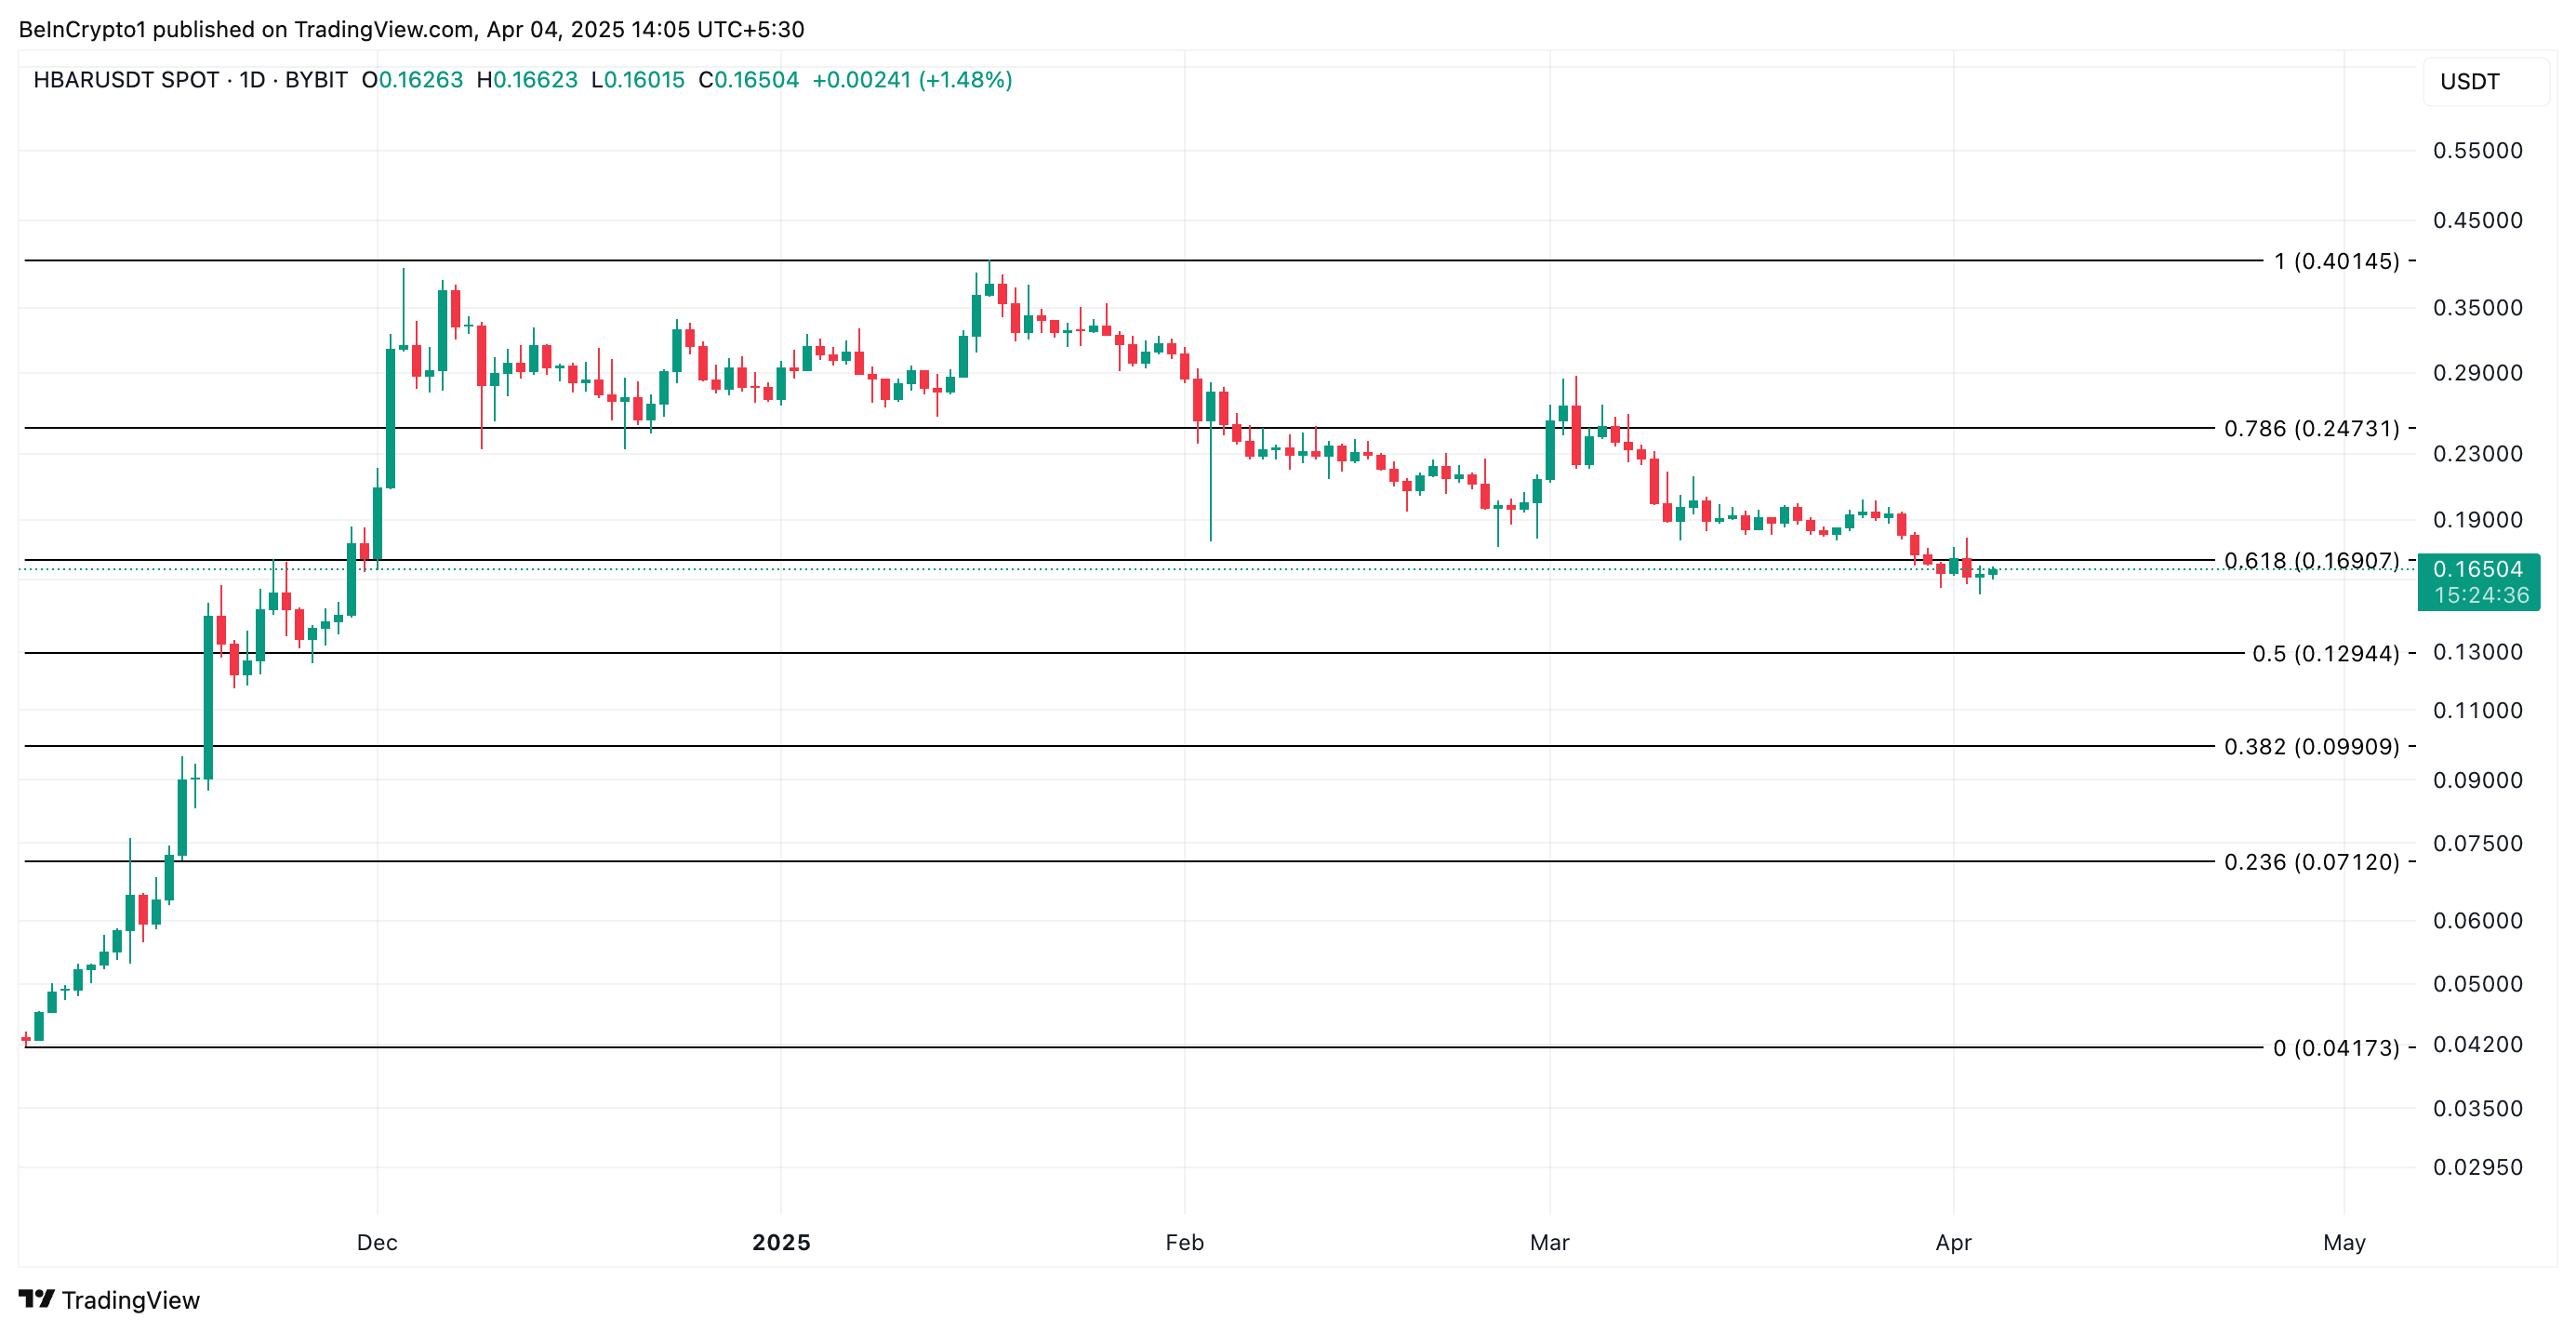
However, a resurgence in profit-taking activity will invalidate this bullish projection. HBAR could resume its decline and fall to $0.129 in that scenario.
Disclaimer
In line with the Trust Project guidelines, this price analysis article is for informational purposes only and should not be considered financial or investment advice. BeInCrypto is committed to accurate, unbiased reporting, but market conditions are subject to change without notice. Always conduct your own research and consult with a professional before making any financial decisions. Please note that our Terms and Conditions, Privacy Policy, and Disclaimers have been updated.

Welcome to the US Morning Crypto Briefing—your essential rundown of the most important developments in crypto for the day ahead.
Grab a coffee to see how Bitcoin is holding firm above $79,000 despite a sharp equities sell-off. Markets are bracing for the March NFP report and rising recession risks. With Fed rate cuts on the table and ETF inflows staying strong, all eyes are on what’s next for macro and crypto markets.
Is Bitcoin in a Bear Market?
The highly anticipated March U.S. non-farm payrolls (NFP) report is due later today, and it’s expected to play a key role in shaping market sentiment heading into the weekend.
“With the key macro risk event now behind us, attention turns to tonight’s non-farm payroll report. Investors are bracing for signs of softness in the U.S. labour market. A weaker-than-expected print would bolster the case for further Fed rate cuts this year, as policymakers attempt to cushion a decelerating economy. At the time of writing, markets are pricing in four rate cuts in 2025—0.25 bps each in June, July, September and December,” QCP Capital analysts said.
Traditional markets are increasingly pricing in a recession, with equities retreating sharply—a 7% decline overall, including a 5% drop just yesterday. This broad de-risking environment helps explain the current pause in crypto inflows.
On the derivatives front, QCP adds:
“On the options front, the desk continues to observe elevated volatility in the short term, with more buyers of downside protection. This skew underscores the prevailing mood – uncertain and cautious.”
However, they also note that “with positioning now light and risk assets largely oversold, the stage may be set for a near-term bounce.”
Bitcoin remains resilient despite market volatility, holding above $79,000 with strong ETF inflows and signs of decoupling from stocks and altcoins. According to Nic Puckrin, crypto analyst, investor, and founder of The Coin Bureau: “Bitcoin is nowhere near a bear market at this stage. The future of many altcoins, however, is more questionable.”
Chart of the Day
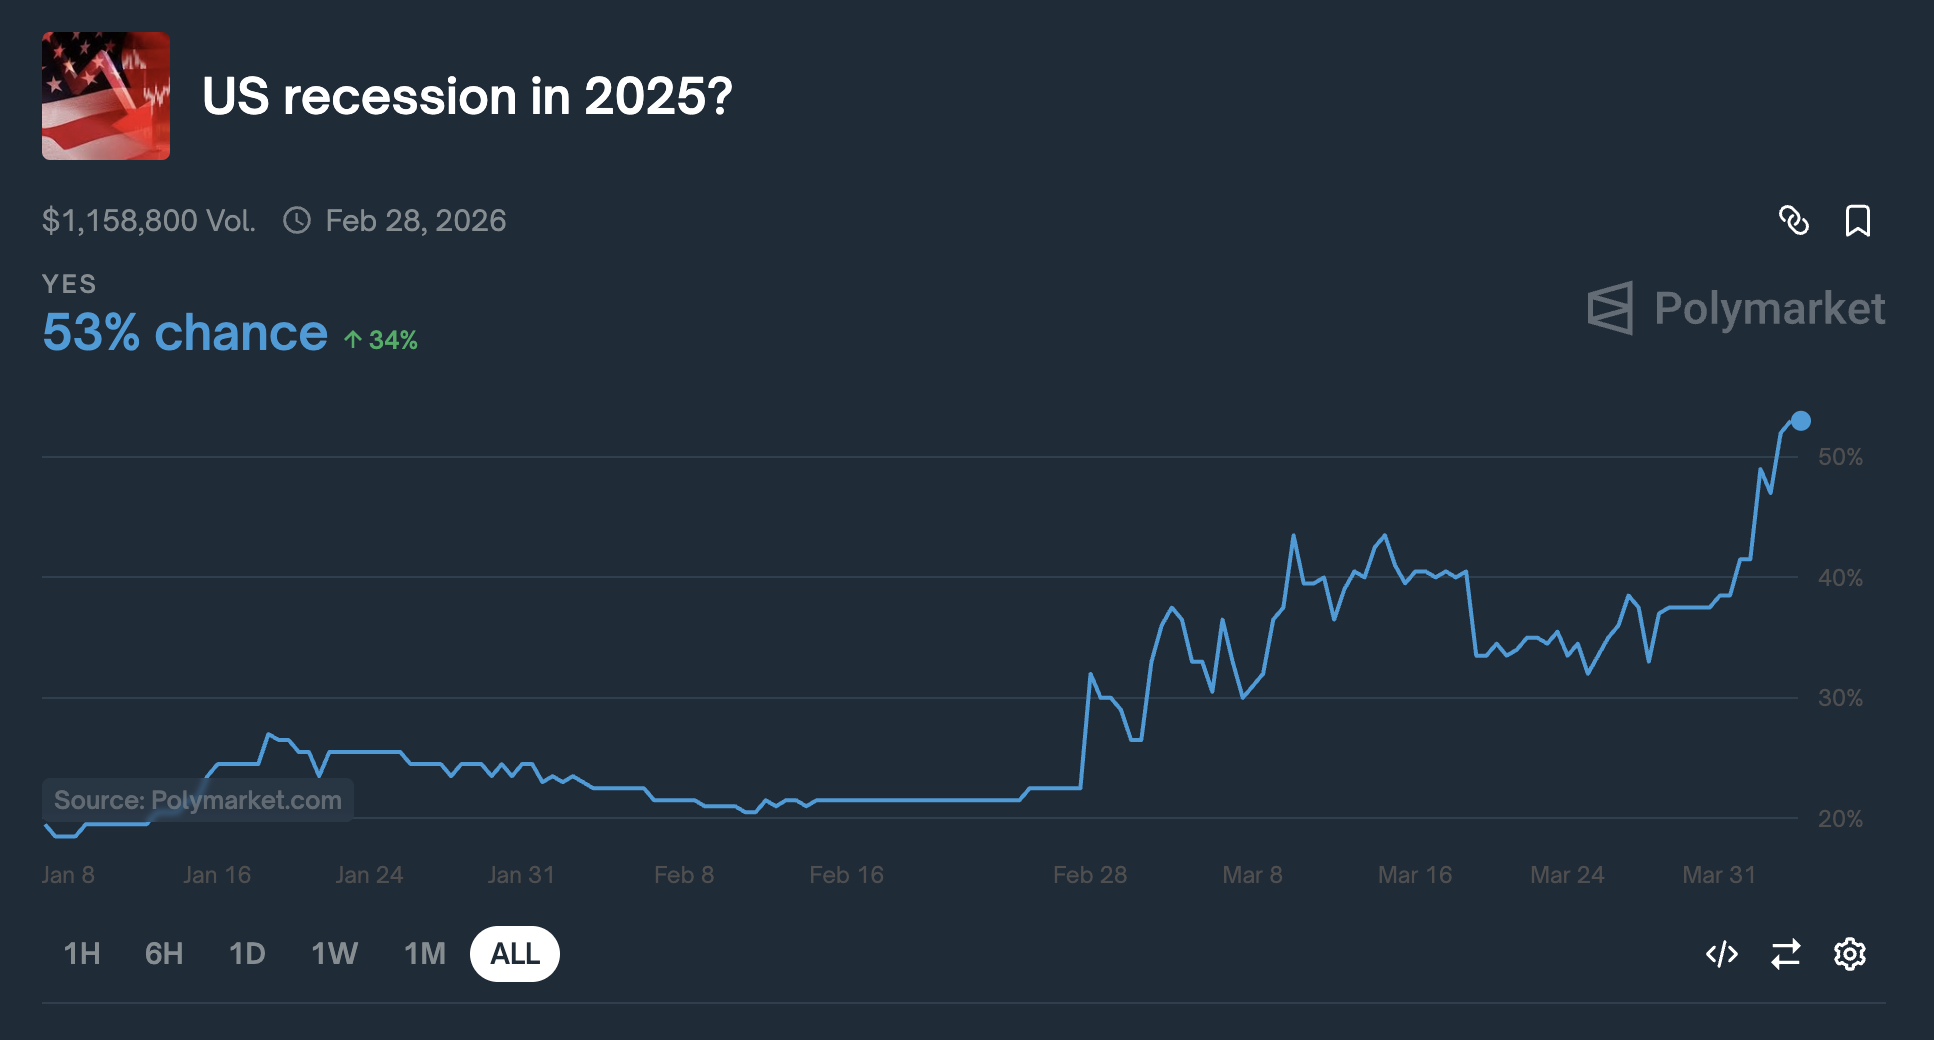
Chances of a US Recession in 2025 jumped above 50% for the first time, currently at 53%.
Byte-Sized Alpha
– Major ETF issuers are buying Bitcoin, with $220 million in inflows showing strong confidence despite volatility.
– Futures show bullish BTC sentiment, but options traders remain cautious, signaling mixed market outlook.
– Coinbase is launching XRP futures after Illinois lawsuit relief, signaling growing regulatory support for crypto.
– Despite Trump’s tariff-driven crash, analysts see potential for a Bitcoin rebound—though inflation may cap gains.
– The Anti-CBDC bill passed a key House vote, aiming to block Fed-issued digital currencies and protect privacy.
– Today at 11:25 AM, Fed Chair Jerome Powell will deliver a speech on the U.S. economic outlook.
Disclaimer
In line with the Trust Project guidelines, this price analysis article is for informational purposes only and should not be considered financial or investment advice. BeInCrypto is committed to accurate, unbiased reporting, but market conditions are subject to change without notice. Always conduct your own research and consult with a professional before making any financial decisions. Please note that our Terms and Conditions, Privacy Policy, and Disclaimers have been updated.

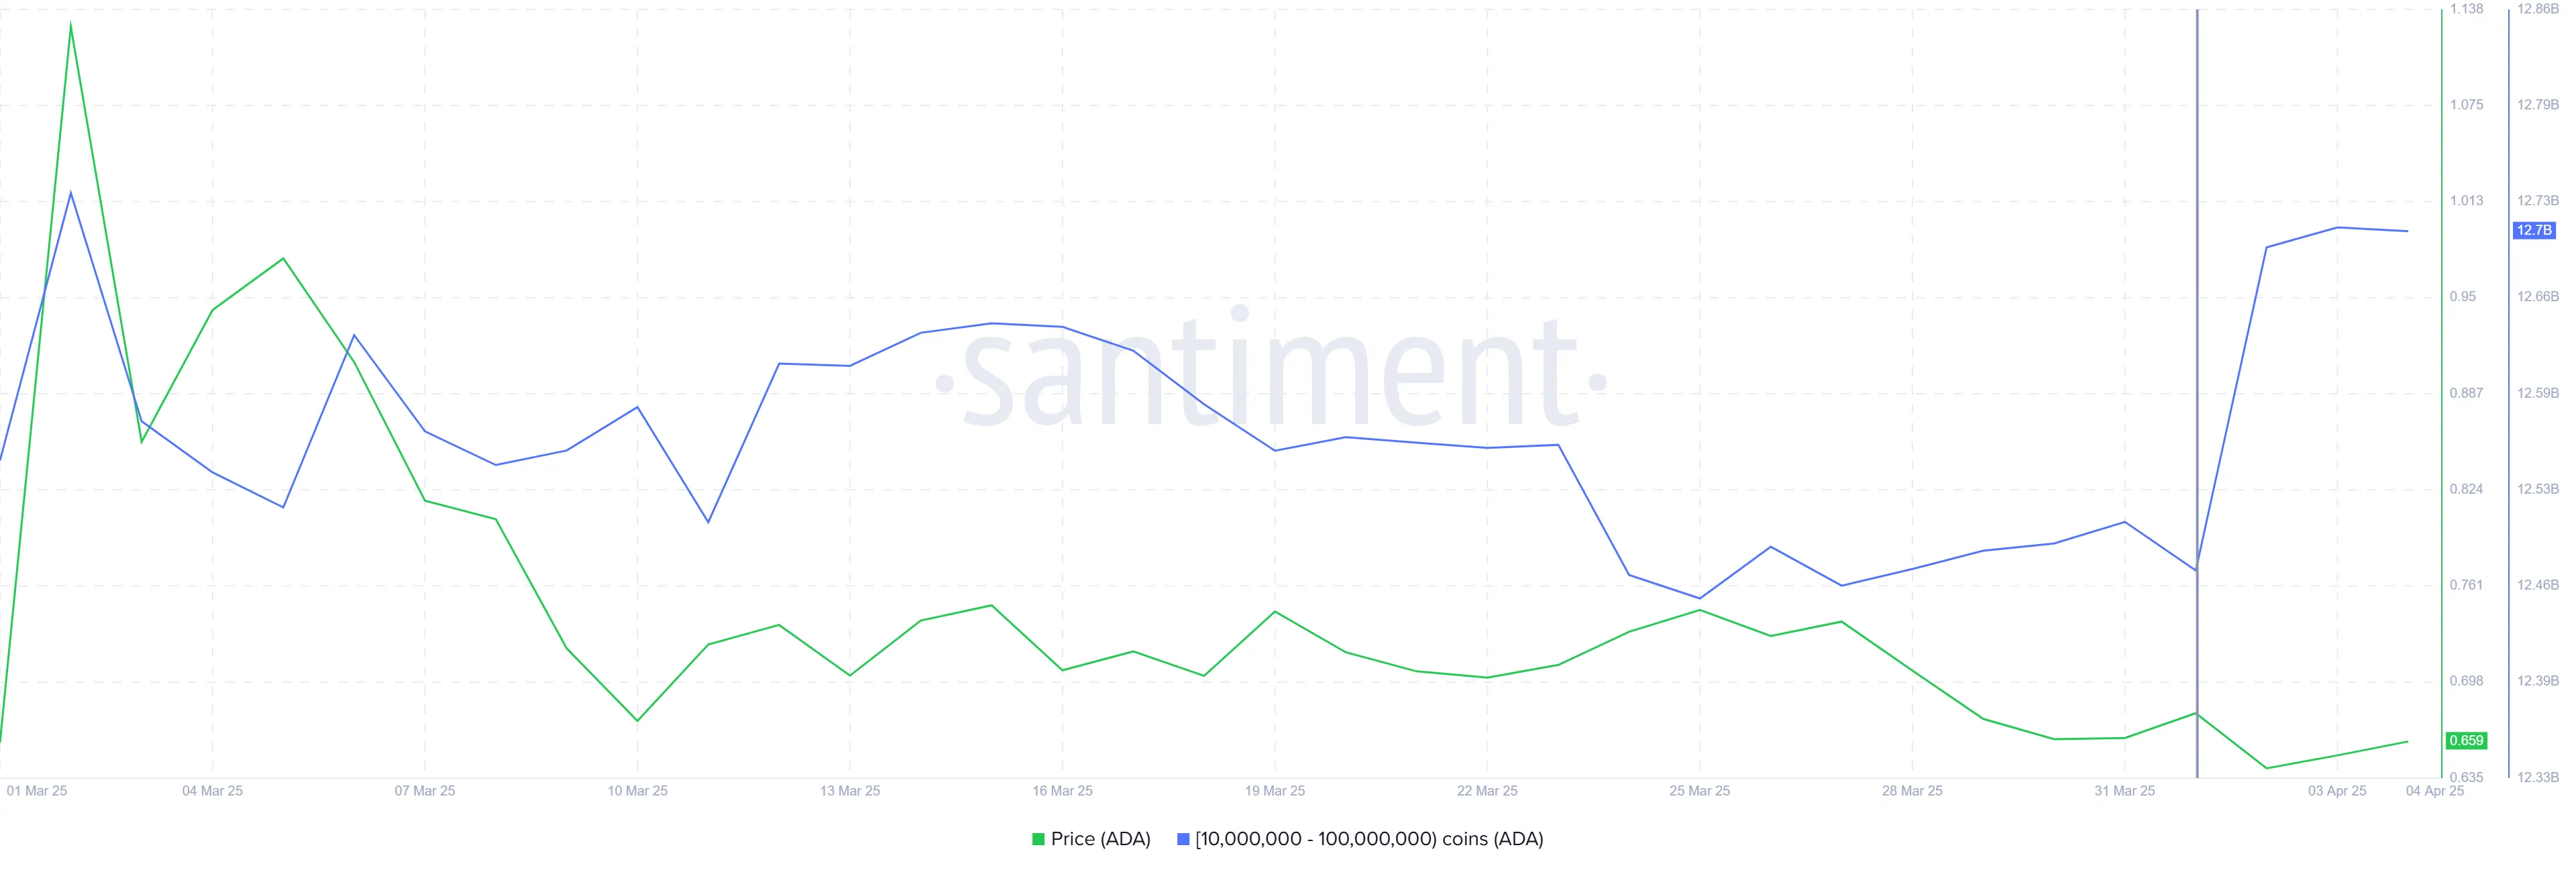
Cardano has experienced a tough period, with the failed price recovery and declining market conditions. However, the recent buying behavior of whales and the potential for a price surge suggest a change in momentum.
If Cardano (ADA) can break through the $0.70 level, it could signal the end of the bearish sentiment.
Cardano Whales Are Hopeful
Over the past 72 hours, whales holding between 10 million and 100 million ADA have accumulated over 230 million ADA, valued at over $150 million at current prices. This shift from selling and staying neutral to accumulation indicates a shift in sentiment, with whales optimistic about ADA’s potential for Q2 2025. Their recent activity signals confidence in the altcoin’s recovery despite the recent market struggles.
Whale accumulation is often a bullish indicator as these investors have significant influence over the market. The accumulation is crucial, as it provides the support needed for ADA to break through resistance levels.
The liquidation map for Cardano shows that approximately $15 million in short contracts will expire as soon as ADA rises above the $0.70 level. This presents a key opportunity for the altcoin. Short-sellers may be forced to close their positions, which could lead to a short squeeze and drive the price higher.
Potential liquidation of short positions may create upward pressure, preventing further declines and allowing ADA to recover. The combination of whale accumulation and the looming liquidation of short contracts could provide Cardano with the momentum it needs to break free from its recent downtrend.

Can ADA Price Breach $0.70?
At the time of writing, Cardano’s price is at $0.65, holding above the crucial $0.62 support level. The altcoin has struggled in recent weeks, but the whale-buying activity offers hope for recovery. A breach of the $0.70 barrier could lead to further upward movement.
Should ADA successfully break through $0.70, it could gain the necessary momentum to continue its recovery. Flipping $0.77 into support would provide an additional boost, positioning Cardano to regain recent losses and possibly challenge higher resistance levels.

However, if Cardano fails to breach $0.70, the price may return to the $0.62 support level. Losing this support would invalidate the bullish outlook and send ADA to a lower level of $0.58, extending the ongoing decline.
Disclaimer
In line with the Trust Project guidelines, this price analysis article is for informational purposes only and should not be considered financial or investment advice. BeInCrypto is committed to accurate, unbiased reporting, but market conditions are subject to change without notice. Always conduct your own research and consult with a professional before making any financial decisions. Please note that our Terms and Conditions, Privacy Policy, and Disclaimers have been updated.

HBAR Futures Traders Lead the Charge as Buying Pressure Grows

Why Bitcoin Is Gaining Appeal Amid Falling US Treasury Yields

Bitcoin is Far From a Bear Market But not Altcoins, Analysts Claim

Bitcoin Drops as China Escalates Trade War With 34% Tariff on US
Cardano Price Recovery Next As Whales Buy 230 Million ADA

Fresh $36M Bitcoin Transfer By Bhutan Sparks Speculation—Dump Alert?

2.52 Million Altcoins Are Ruining Crypto’s Future

Animoca Brands Valuation Tanks 75% In Two Years, Here’s Why

Crypto exchange BingX hacked for $43 million

Are The Big Players Losing Interest?

Hong Kong’s Securities Association Tips Authorities On Crypto Self-Regulation

Coinbase cbBTC Set to go Live on Solana
2.52 Million Altcoins Are Ruining Crypto’s Future
Animoca Brands Valuation Tanks 75% In Two Years, Here’s Why
Crypto exchange BingX hacked for $43 million
Are The Big Players Losing Interest?
Hong Kong’s Securities Association Tips Authorities On Crypto Self-Regulation
Coinbase cbBTC Set to go Live on Solana
-

 Market22 hours ago
Binance Managed 94% of All Crypto Airdrops and Staking Rewards
-

 Market23 hours ago
Pi Network Price Falls To Record New Low Amid Weak Inflows
-
 Regulation21 hours ago
US SEC Acknowledges Fidelity’s Filing for Solana ETF
-

 Market19 hours ago
Wormhole (W) Jumps 10%—But Is a Pullback Coming?
-
 Altcoin19 hours ago
Altcoin Season Still In Sight Even As Ethereum Struggles To Gain Upward Momentum
-

 Market21 hours ago
XRP Battle Between Bulls And Bears Hinges On $1.97 – What To Expect
-

 Market20 hours ago
Ripple Shifts $1B in XRP Amid Growing Bearish Pressure
-

 Market18 hours ago
Binance’s CZ is Helping Kyrgyzstan Become A Crypto Hub