
Altcoin
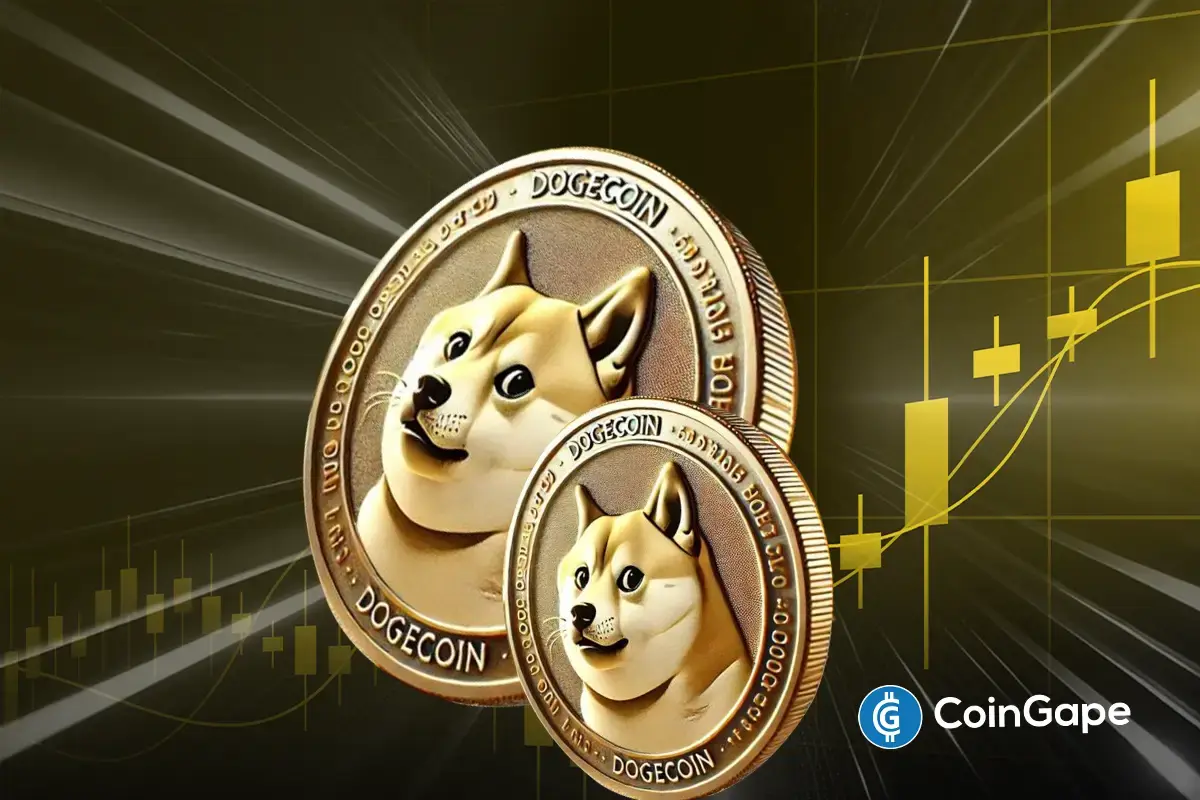
Dogecoin Price To Target $0.15 Following $0.105 Bounce
The Dogecoin price could surge to $0.15 soon enough as it continues to hold above the crucial support level at $0.015. Dogecoin analyst Kevin Capital recently suggested that the foremost meme coin will rise higher if it holds $0.105 as support. Meanwhile, DOGE could witness some resistance between $0.13 and $0.14 as it looks to break out to the upside.
Dogecoin Price Set For A Rally To $0.15
DOGE is set to rally to $0.15 following a successful retest of the $0.105 price level as support. Kevin stated in an X post that the meme coin will continue to move to the upside if it holds above this price level. He described this price level as the ‘lines in the sand’ currently, suggesting that the top meme coin cannot afford to drop below this support level if it is to continue its uptrend.
There is also the Bitcoin factor, as the analyst highlighted $60,000 as the price level at which the flagship crypto must stay above for prices to keep trending upward. IntoTheBlock data shows that Bitcoin and Dogecoin prices have a strong positive correlation. Therefore, the meme coin risks a significant price drop if BTC drops below $60,000.
Meanwhile, DOGE could also face significant resistance between $0.13 and $0.14. Crypto analyst Crypto Yapper stated that the meme coin has already been rejected at this critical horizontal level. He further suggests that this will be the major price range that DOGE will need to break as it rises to $0.15.

Network Growth Supports A Price Rally
Crypto analyst Ali Martinez shared IntoTheBlock data showing that the Dogecoin network has experienced significant growth over the past week. This provides a bullish outlook for the Dogecoin price. The analyst stated that there has been a 72% increase in the number of new DOGE addresses. He added that 19,630 new addresses were created on September 30.

This notable surge in Dogecoin’s new addresses could be related to the recent plans to enable smart contracts on the network. QED protocol announced its partnership with Nexus to launch a zero-knowledge virtual machine (zkVM) on the network. Enabling smart contracts on the network will increase decentralized finance (DeFi) activity. As such, these new addresses could have been activated in anticipation of the launch.
Meanwhile, Dogecoin’s large transactions have surged, indicating an accumulation trend among DOGE whales. IntoTheBlock data shows that 7.83 billion DOGE coins have been traded in the last 24 hours. This is significant considering how these whales could contribute to the Dogecoin price rally.

Boluwatife Adeyemi
Boluwatife Adeyemi is a well-experienced crypto news writer and editor who has covered topics that cut across DeFi, NFTs, smart contracts, and blockchain interoperability, among others. Boluwatife has a knack for simplifying the most technical concepts and making it easy for crypto newbies to understand. Away from writing, He is an avid basketball lover and a part-time degen.
Disclaimer: The presented content may include the personal opinion of the author and is subject to market condition. Do your market research before investing in cryptocurrencies. The author or the publication does not hold any responsibility for your personal financial loss.


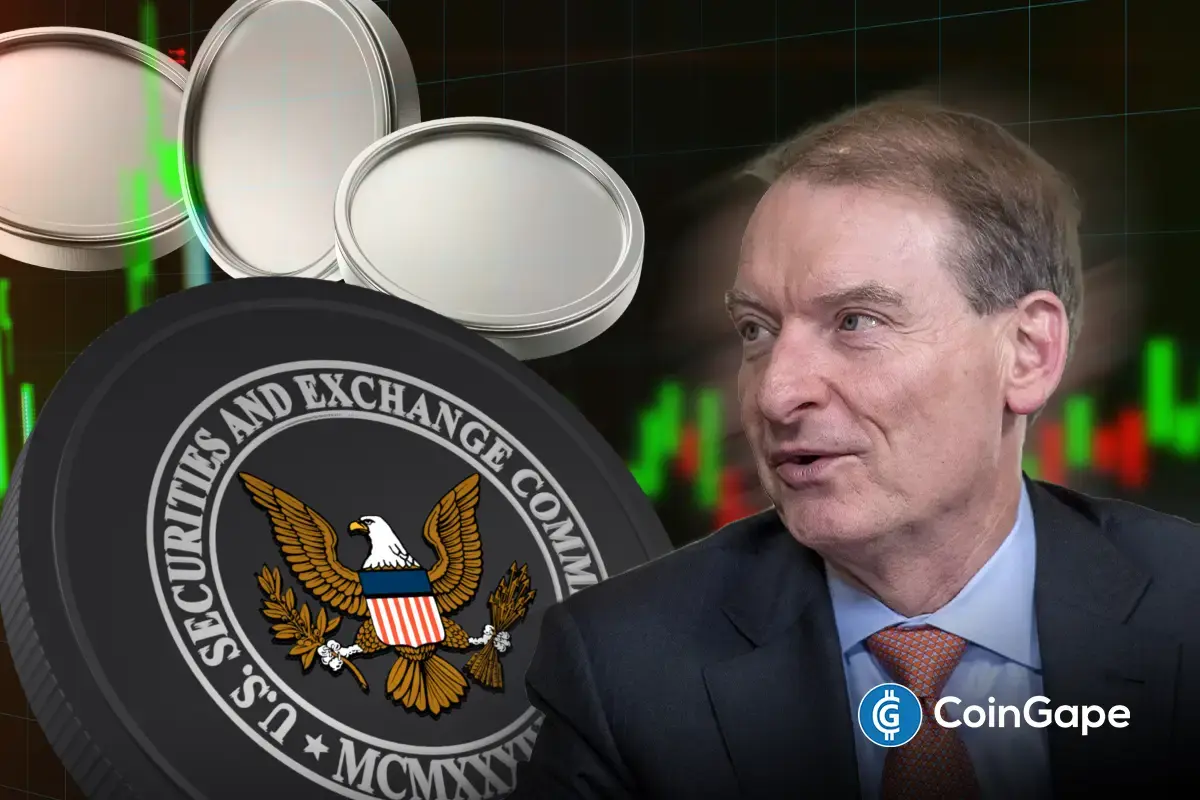
XRP price has surged nearly 10% today, indicating a renewed market interest in Ripple’s native asset. Notably, the robust surge comes amid a broader crypto market recovery and several other positive developments like the successful ETF launch in the US. Amid this, a top expert has highlighted the XRP/BTC performance and said that Ripple’s native asset is likely to hit $22 if Bitcoin hits a new ATH ahead.
XRP/BTC Bullish Cross Signals Massive Surge Ahead
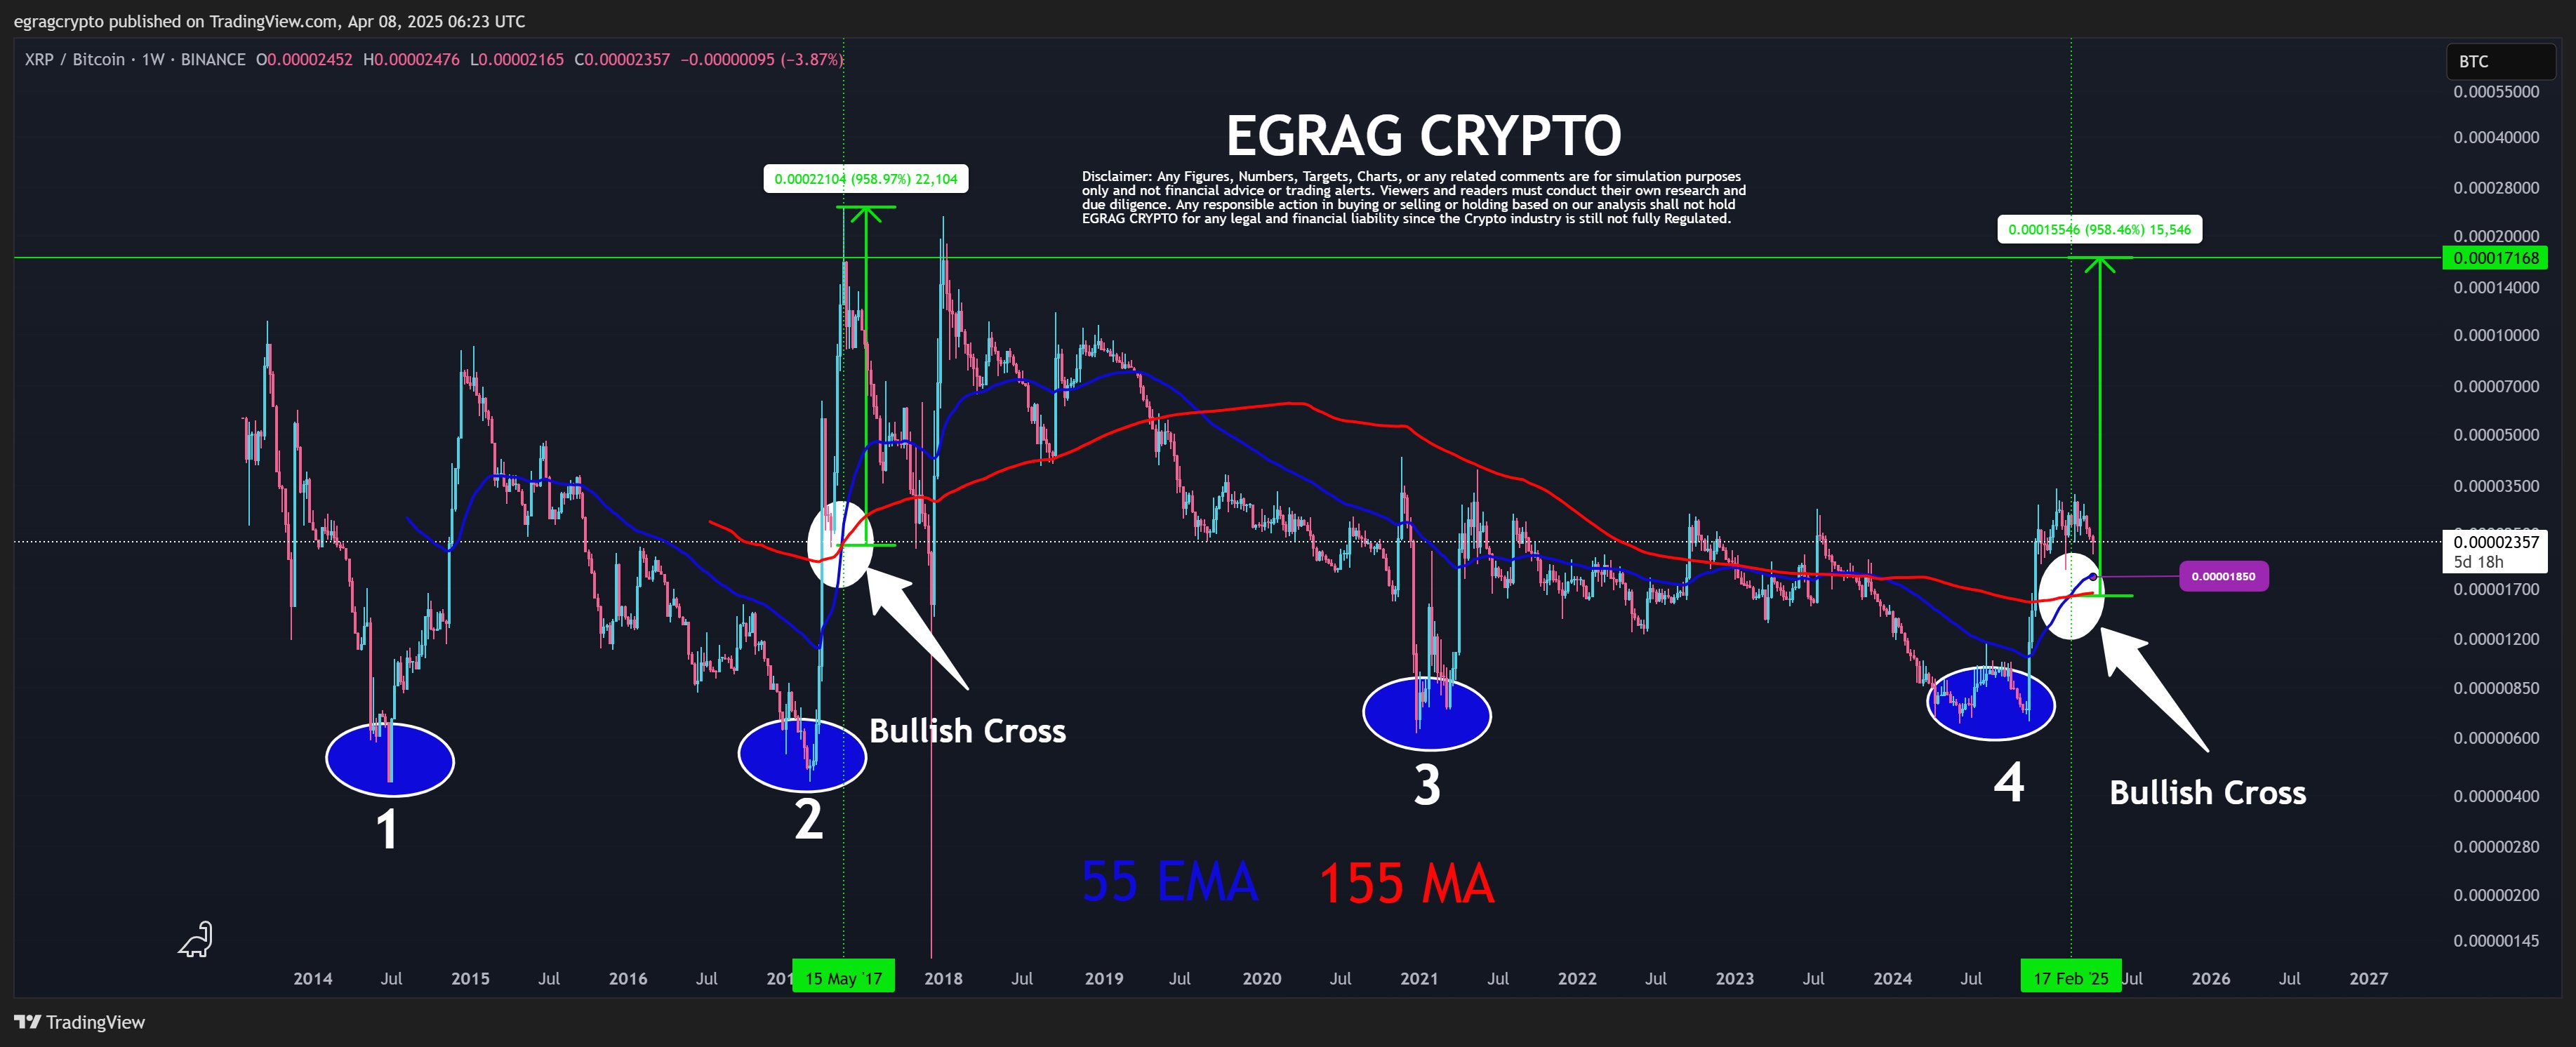
Crypto analyst EGRAG CRYPTO recently highlighted a major bullish signal on the XRP/BTC chart. He pointed out a rare crossover of two key indicators, i.e. the 55-week Exponential Moving Average (EMA) and the 155-week Moving Average (MA). According to him, this “Bullish Cross” could be a game-changer for XRP holders.
EGRAG explained that the last time this crossover occurred was back in May 2017. XRP price rallied 958% shortly after that event. A similar cross took place again on February 17, 2025, and could repeat the explosive pattern if market conditions align.
Meanwhile, he added that if XRP/BTC retests the 55 EMA level of 0.00001850, Ripple’s coin could reach around $1.48, assuming Bitcoin trades at $80,000. However, if the historical pattern plays out and XRP/BTC gains another 958%, XRP price could skyrocket much higher. Besides, it also comes amid a surge of nearly 6% in BTC price today.
XRP Price Likely To Follow Bitcoin Move
EGRAG CRYPTO’s prediction hinges heavily on Bitcoin’s next major move. If Bitcoin price revisits its 2025 ATH near $109,000 and retraces to $97,000, XRP could hit $16.5. But if BTC breaks into higher territory, the numbers look even more bullish.
For context, he calculated that if Bitcoin touches $130K, XRP could trade at $22. Furthermore, if BTC rallies to $150K, XRP might surge to $25. A push toward $170K could propel XRP to $29, he added.
Why Does This Technical Signal Matters?
The analyst believes most traders overlook the significance of the 55 EMA and 155 MA combination. He noted that many still doubt XRP’s ability to reach double digits, especially after the recent crypto market crash.
However, the analyst remains firm in his belief that the chart tells a different story. He believes that as long as the XRP/BTC pair holds above the 55 EMA, the bullish projection for the XRP price stays valid.
XRP Price Soars 10%
XRP price today was up nearly 10% and exchanged hands at $2, while its one-day volume rose 3% to $8 billion. Simultaneously, the XRP Futures Open Interest also soared past the $3 billion mark with over 4% surge, CoinGlass data showed.
Notably, this recent surge comes as the Ripple network has seen a massive surge in active addresses recently. Besides, the recent XRP ETF launch in the US has also bolstered market confidence. The first-day volume of the Teucrium 2X Long Daily XRP ETF has outshined Solana’s 2X ETF (SOLT) first-day volume.
Considering all these fundamental developments, it appears that the crypto is gearing up for a major rally ahead. Besides, the analyst’s forecast, if holds true, could send the crypto to over $20 in the coming days.
Rupam Roy
Rupam is a seasoned professional with three years of experience in the financial market, where he has developed a reputation as a meticulous research analyst and insightful journalist. He thrives on exploring the dynamic nuances of the financial landscape. Currently serving as a sub-editor at Coingape, Rupam’s expertise extends beyond conventional boundaries. His role involves breaking stories, analyzing AI-related developments, providing real-time updates on the crypto market, and presenting insightful economic news.
Rupam’s career is characterized by a deep passion for unraveling the complexities of finance and delivering impactful stories that resonate with a diverse audience.
Disclaimer: The presented content may include the personal opinion of the author and is subject to market condition. Do your market research before investing in cryptocurrencies. The author or the publication does not hold any responsibility for your personal financial loss.

The cryptocurrency market is showing potential signs of an impending altcoin season. Market watchers cite a confluence of technical, sentiment, and macroeconomic factors that could lead to a significant rally in altcoins.
The outlook follows a notable downturn in the altcoin market, which has dropped about 37.6% since its high in early December 2024. As of the latest data, the market cap stands at $1.1 trillion.
Is Altcoin Season Coming?
From a technical perspective, Bitcoin (BTC) Dominance, which measures Bitcoin’s market share relative to the total cryptocurrency market, seems to be at a key turning point.
A recent chart shared by crypto analyst Mister Crypto on X highlighted that Bitcoin Dominance has reached a resistance following a rising wedge pattern. This pattern is generally seen as a bearish signal, often leading to sharp pullbacks.
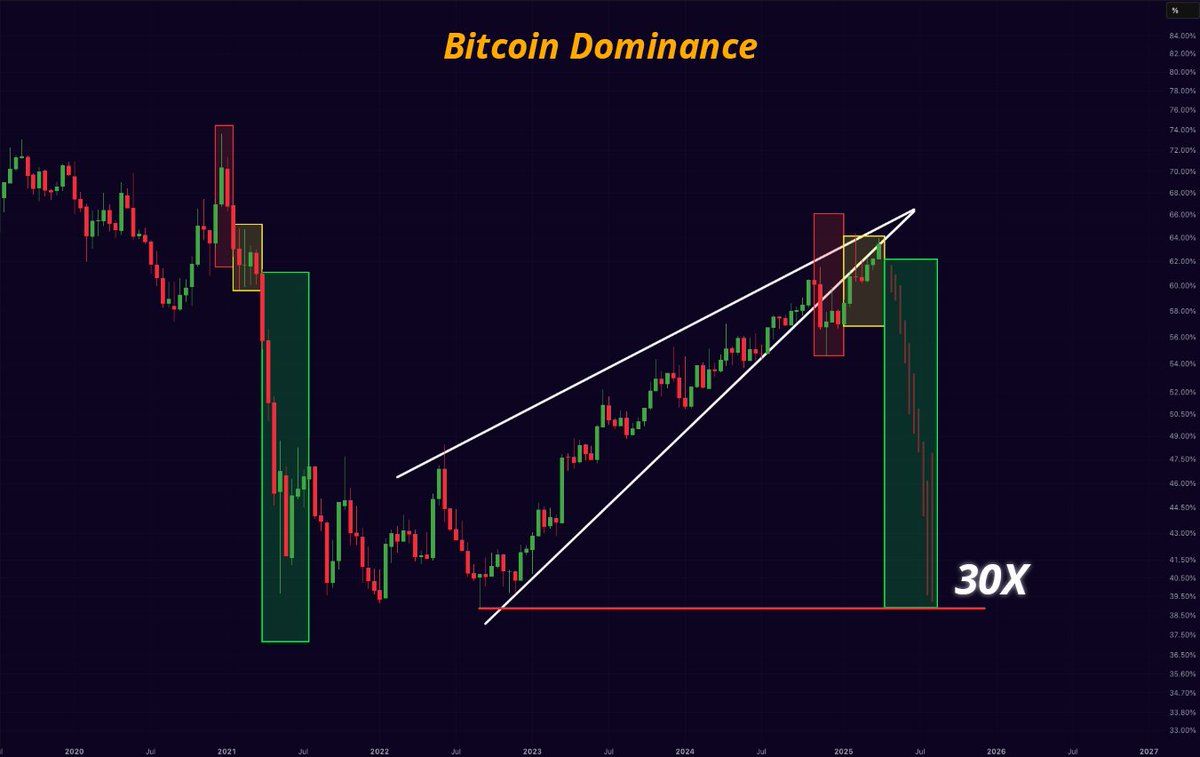
“Bitcoin Dominance will collapse. Altseason will come. We will all get rich this year!” he wrote.
In addition, another analyst corroborated these findings, noting that Bitcoin Dominance has reached a peak. Thus, he forecasted a subsequent downturn.
However, the Altcoin Season Index has dropped to a low of 16. The index, which analyzes the performance of the top 50 altcoins against Bitcoin, indicated that altcoins are currently underperforming.

Notably, this level mirrors the bottom for altcoins observed around August 2024. This period preceded a significant altcoin rally, and the index peaked at 88 by December 2024.
Lastly, from a macroeconomic perspective, the 90-day delay in President Donald Trump’s tariff implementation has renewed market confidence. This delay is perceived as a positive signal, potentially encouraging capital inflows into altcoins.
“90 days tariff pause = 90 days of altseason,” an analyst claimed.
Moreover, analyst Crypto Rover pointed to quantitative easing (QE) as a catalyst for an altseason. According to him, when the central bank starts pumping money into the economy (through QE), altcoins could experience a significant price surge, benefiting from the increased liquidity and investor optimism.
“Once QE starts. Altcoin season will make a massive comeback!” he stated.
However, in the latest report, Kaiko Research stressed that a traditional altcoin season may no longer be feasible. Instead, any potential rally could be selective, with only a few altcoins experiencing significant upside. The focus will likely be on assets with real-world use cases, strong liquidity, and revenue-generating potential.
“Altseasons may become a thing of the past, necessitating a more nuanced categorization beyond just ‘altcoins,’ as correlations in returns, growth factors, and liquidity among crypto assets are diverging significantly over time,” the report read.
Kaiko Research noted that the growing concentration of liquidity in a few altcoins and Bitcoin may disrupt the typical capital flow into altcoins during market upswings. Furthermore, as Bitcoin becomes more widely adopted as a reserve asset by institutions and governments, its position in the market strengthens further.
Ultimately, while the signs point to a potential altcoin rally, it’s clear that the future of altcoins could involve more nuanced market dynamics.
Disclaimer
In adherence to the Trust Project guidelines, BeInCrypto is committed to unbiased, transparent reporting. This news article aims to provide accurate, timely information. However, readers are advised to verify facts independently and consult with a professional before making any decisions based on this content. Please note that our Terms and Conditions, Privacy Policy, and Disclaimers have been updated.

The on-chain analytics firm Santiment has revealed how the majority of the altcoins are currently in what has historically been a buy zone.
Mid-Term Trading Returns Are Extremely Negative For Most Altcoins
In a new post on X, Santiment has shared an update for its MVRV Opportunity & Danger Zone Divergence Model for the various altcoins in the sector. The model is based on the popular “Market Value to Realized Value (MVRV) Ratio.”
The MVRV Ratio is an on-chain indicator that basically tells us whether the investors of a cryptocurrency as a whole are holding their coins at a net profit or loss.
When the value of this metric is greater than 1, it means the average investor is holding a profit. On the other hand, it being under this threshold suggests the dominance of loss.
Historically, holder profitability is something that has tended to have an effect on the prices of digital assets. Whenever the investors are in large profits, they can become tempted to sell their coins in order to realize the piled-up gains. This can impede bullish momentum and result in a top for the price.
Similarly, holders being significantly underwater results in market conditions where profit-takers have run out, thus allowing for the cryptocurrency to reach a bottom.
Santiment’s MVRV Opportunity & Danger Zone Divergence Model exploits these facts in order to define buy and sell zones for the altcoins. The model calculates the divergence of the MVRV Ratio on various timeframes (30 days, 90 days, and 6 months) to find whether an asset is inside one of these zones or not.
Here is the chart shared by the analytics firm that shows how the different altcoins are currently looking based on this model:
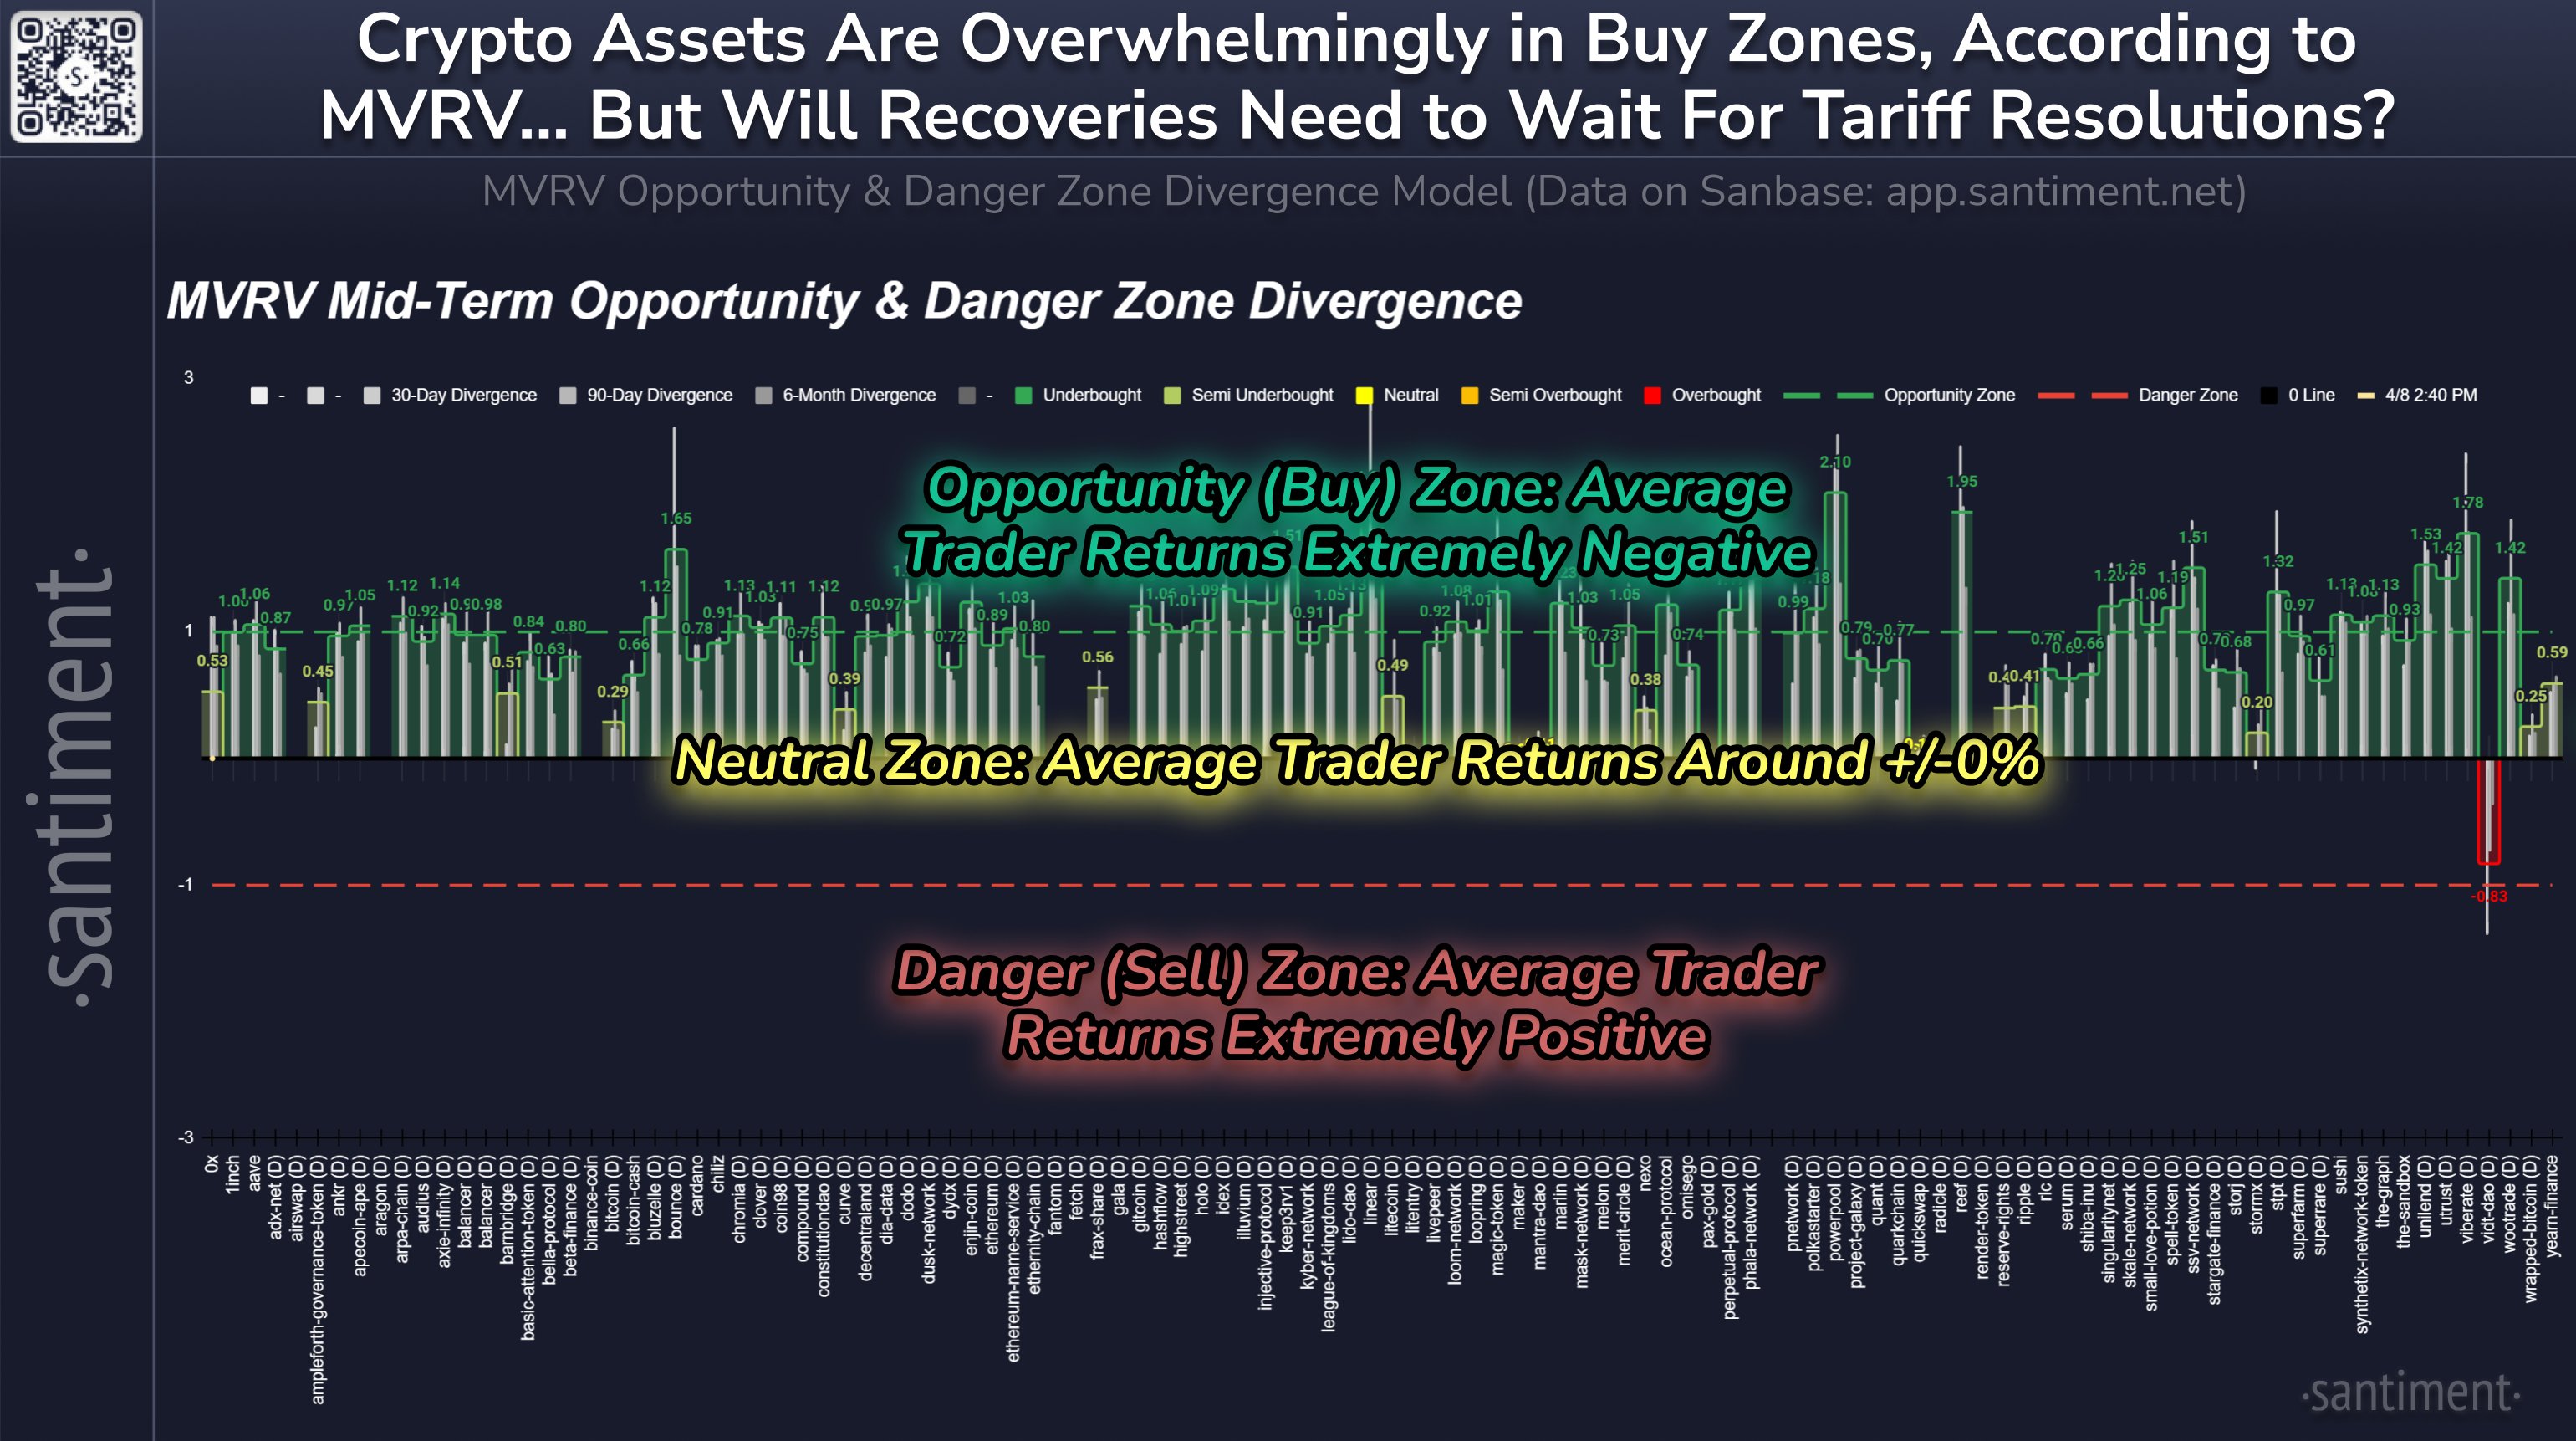
Looks like most of the sector is currently in the buy region | Source: Santiment on X
In this model, a value greater than zero suggests average trader returns are negative for that timeframe and that below it is positive. This is the opposite orientation of what it’s like in the MVRV Ratio, with the zero level taking the role of the 1 mark from the indicator.
From the graph, it’s visible that almost all of the altcoins have their MVRV divergence greater than zero on the different timeframes. Out of these, most of them have their mid-term MVRV divergence greater than 1. The opportunity zone mentioned earlier lies beyond this mark, so the model is currently showing a buy signal for the majority of the altcoins.
The average negative returns have come for these coins as the market has been in turmoil following the news related to tariffs. While the model may be showing a buy signal for the altcoins, it’s possible that this uncertainty will continue to haunt the market. As Santiment explains,
If and when a global tariff solution is reached, it would undoubtedly trigger a very rapid cryptocurrency recovery,” notes However, this is currently a very big “if” based on the latest media coverage on what is quickly being referred to as a full-fledged “trade war” between the US and the majority of the world.
BTC Price
At the time of writing, Bitcoin is floating around $76,900, down more than 9% in the last seven days.
The price of the coin has already erased its attempt at recovery | Source: BTCUSDT on TradingView
Featured image from Dall-E, Santiment.net, chart from TradingView.com
Editorial Process for bitcoinist is centered on delivering thoroughly researched, accurate, and unbiased content. We uphold strict sourcing standards, and each page undergoes diligent review by our team of top technology experts and seasoned editors. This process ensures the integrity, relevance, and value of our content for our readers.
Analyst Reveals How XRP Price Can Hit $22 If BTC Rallies To This Level

Meme Coin FARTCOIN Hits Two-Month High, Could It Reach $1?

Will Q2 2025 Mark the Return of Altcoin Season?

XRP Price Forms Rounded Bottom Within Descending Channel, Target Set Above $3

RSR Price Climbs 22% After Paul Atkins Gets Named SEC Chair

Is Trump’s Tariff Delay Masking a Crypto Dead Cat Bounce?

2.52 Million Altcoins Are Ruining Crypto’s Future

Animoca Brands Valuation Tanks 75% In Two Years, Here’s Why

Crypto exchange BingX hacked for $43 million

Are The Big Players Losing Interest?

Hong Kong’s Securities Association Tips Authorities On Crypto Self-Regulation

Coinbase cbBTC Set to go Live on Solana
2.52 Million Altcoins Are Ruining Crypto’s Future
Animoca Brands Valuation Tanks 75% In Two Years, Here’s Why
Crypto exchange BingX hacked for $43 million
Are The Big Players Losing Interest?
Hong Kong’s Securities Association Tips Authorities On Crypto Self-Regulation
Coinbase cbBTC Set to go Live on Solana
-
 Bitcoin12 hours ago
MicroStrategy Bitcoin Dump Rumors Circulate After SEC Filing
-

 Altcoin16 hours ago
NFT Drama Ends For Shaquille O’Neal With Hefty $11 Million Settlement
-
 Market12 hours ago
XRP Primed for a Comeback as Key Technical Signal Hints at Explosive Move
-
 Regulation12 hours ago
US Senate Confirms Pro-Crypto Paul Atkins As SEC Chair
-
 Altcoin23 hours ago
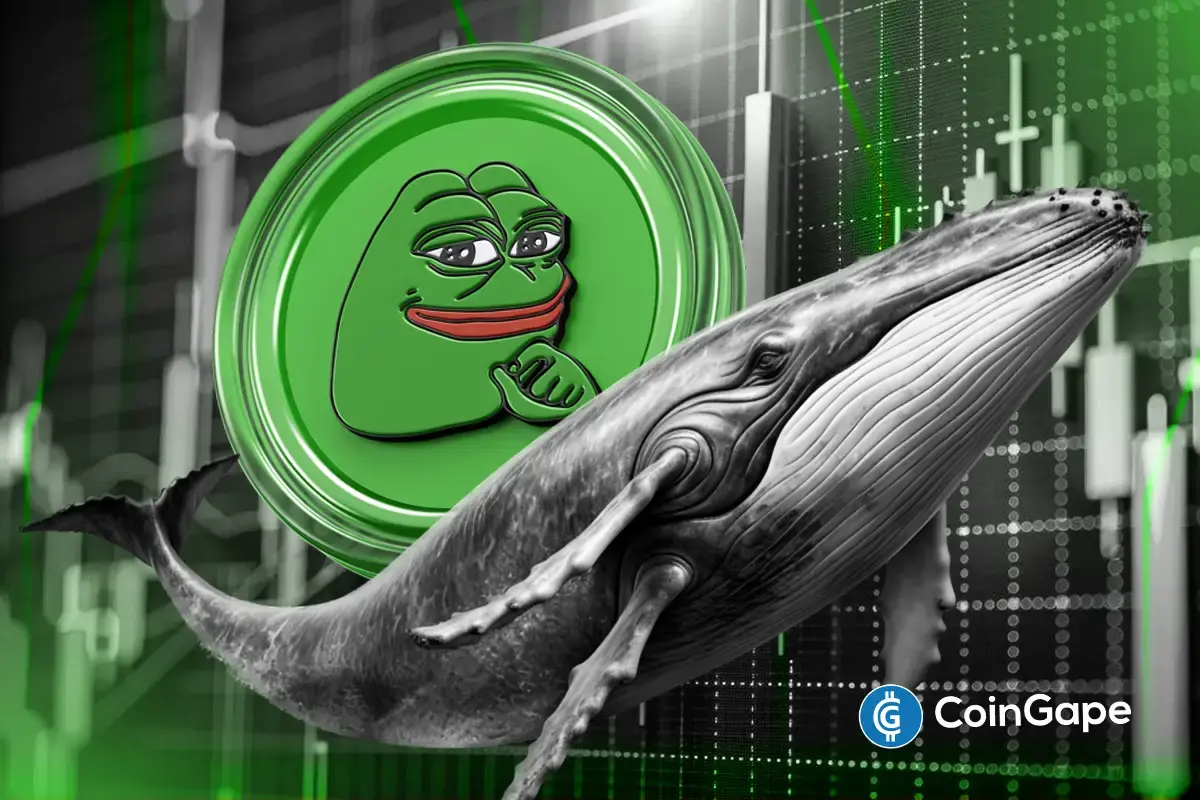
Pepe Coin Whales Offload Over 1 Trillion PEPE
-

 Bitcoin21 hours ago
Will the Corporate Bitcoin Accumulation Trend Continue in 2025?
-
 Altcoin15 hours ago
Is Dogecoin Price Levels About To Bounce Back?
-
 Market21 hours ago
Paul Atkins SEC Confirmation Vote
✓ Share: