
Market
Crypto Researcher Reveals Why XRP Price Reaching $1,000 Is Not A Pipe Dream

The XRP price has struggled for the last three years, staying down even when Bitcoin and other altcoins rallied to possible new all-time highs. However, even through this, the XRP community has remained steadfast in their belief that the altcoin’s price will reach new peaks. Forecasts have ranged from reaching $1 to as high as $1,000. The latter has been hotly debated among crypto investors. However, one crypto researcher believes that the XRP price will be able to touch $1,000 eventually, giving reasons for why this could happen.
Dominating Global Banking Systems
The selling point of the XRP token has always been the fact that it is to be integrated into the world banking systems, allowing for cheaper, faster, and smoother transactions. The expectations for the token’s use in banking were the initial reason behind its meteoric rise, and this has continued to foster belief in its future.
Related Reading
Crypto researcher CryptoTank took to X (formerly Twitter), to reiterate the value proposal of this for the XRP Price, alluding to this utility. The researcher points out that SWIFT is already integrating the RippleNet into its systems, and given SWIFT’s volume, it could mean a lot of inflow for the token.
They point out that SWIFT currently does around $5-$7 trillion in daily volume, even with high fees of $20-$50 per transaction. However, compared to this, using RippleNet would bring fees down to pennies, allowing the payment platform to save hundreds of billions of dollars yearly. Furthermore, the researcher explains that even if Ripple were to only get 10% of SWITF’s trading volume, it would mean a substantial $500 billion at least passing through RippleNet daily.
At this rate, the low XRP price would not be adequate to handle the volume from SWIFT alone. Thus, the researcher believes that the XRP price would rise to be able to compensate for this new volume. “XRP has to be very high to move just 10% of Swifts daily volume,” the researcher said. “When you start adding the other banks in it gets crazy how high XRP will go.”
XRP Price To $1,000 Debate
The recent debate surrounding the XRP price reaching $1,000 began with the Uphold crypto exchange asking the community what they would do if the XRP price were to hit $1,000. This sparked speculations on whether or not the altcoin can actually reach this price, triggering input from various angles.
Related Reading
However, on-chain investigator TruthLabs debunked this possibility, citing how much the market cap would have to grow for it to hit this target. According to the investigator, the XRP market cap would have to reach $100 trillion, whi
Featured image created with Dall.E, chart from Tradingview.com
ch is 50x the current market cap of the entire crypto market.
Featured image created with Dall.E, chart from Tradingview.com


Ethereum price started a fresh increase above the $3,220 zone. ETH is rising and aiming for more gains above the $3,350 resistance.
- Ethereum started a fresh increase above the $3,220 and $3,300 levels.
- The price is trading above $3,250 and the 100-hourly Simple Moving Average.
- There is a short-term contracting triangle forming with resistance at $3,360 on the hourly chart of ETH/USD (data feed via Kraken).
- The pair could gain bullish momentum if it clears the $3,385 resistance zone.
Ethereum Price Regains Traction
Ethereum price remained supported above $3,000 and started a fresh increase like Bitcoin. ETH gained pace for a move above the $3,150 and $3,220 resistance levels.
The bulls pumped the price above the $3,300 level. It gained over 10% and traded as high as $3,387. It is now consolidating gains above the 23.6% Fib retracement level of the recent move from the $3,036 swing low to the $3,387 high.
Ethereum price is now trading above $3,220 and the 100-hourly Simple Moving Average. On the upside, the price seems to be facing hurdles near the $3,350 level. There is also a short-term contracting triangle forming with resistance at $3,360 on the hourly chart of ETH/USD.

The first major resistance is near the $3,385 level. The main resistance is now forming near $3,420. A clear move above the $3,420 resistance might send the price toward the $3,550 resistance. An upside break above the $3,550 resistance might call for more gains in the coming sessions. In the stated case, Ether could rise toward the $3,650 resistance zone or even $3,880.
Another Decline In ETH?
If Ethereum fails to clear the $3,350 resistance, it could start another decline. Initial support on the downside is near the $3,300 level. The first major support sits near the $3,250 zone.
A clear move below the $3,250 support might push the price toward $3,220 or the 50% Fib retracement level of the recent move from the $3,036 swing low to the $3,387 high. Any more losses might send the price toward the $3,150 support level in the near term. The next key support sits at $3,050.
Technical Indicators
Hourly MACD – The MACD for ETH/USD is gaining momentum in the bullish zone.
Hourly RSI – The RSI for ETH/USD is now above the 50 zone.
Major Support Level – $3,250
Major Resistance Level – $3,385
Ethereum price started a fresh increase above the $3,220 zone. ETH is rising and aiming for more gains above the $3,350 resistance.
- Ethereum started a fresh increase above the $3,220 and $3,300 levels.
- The price is trading above $3,250 and the 100-hourly Simple Moving Average.
- There is a short-term contracting triangle forming with resistance at $3,360 on the hourly chart of ETH/USD (data feed via Kraken).
- The pair could gain bullish momentum if it clears the $3,385 resistance zone.
Ethereum Price Regains Traction
Ethereum price remained supported above $3,000 and started a fresh increase like Bitcoin. ETH gained pace for a move above the $3,150 and $3,220 resistance levels.
The bulls pumped the price above the $3,300 level. It gained over 10% and traded as high as $3,387. It is now consolidating gains above the 23.6% Fib retracement level of the recent move from the $3,036 swing low to the $3,387 high.
Ethereum price is now trading above $3,220 and the 100-hourly Simple Moving Average. On the upside, the price seems to be facing hurdles near the $3,350 level. There is also a short-term contracting triangle forming with resistance at $3,360 on the hourly chart of ETH/USD.
The first major resistance is near the $3,385 level. The main resistance is now forming near $3,420. A clear move above the $3,420 resistance might send the price toward the $3,550 resistance. An upside break above the $3,550 resistance might call for more gains in the coming sessions. In the stated case, Ether could rise toward the $3,650 resistance zone or even $3,880.
Another Decline In ETH?
If Ethereum fails to clear the $3,350 resistance, it could start another decline. Initial support on the downside is near the $3,300 level. The first major support sits near the $3,250 zone.
A clear move below the $3,250 support might push the price toward $3,220 or the 50% Fib retracement level of the recent move from the $3,036 swing low to the $3,387 high. Any more losses might send the price toward the $3,150 support level in the near term. The next key support sits at $3,050.
Technical Indicators
Hourly MACD – The MACD for ETH/USD is gaining momentum in the bullish zone.
Hourly RSI – The RSI for ETH/USD is now above the 50 zone.
Major Support Level – $3,250
Major Resistance Level – $3,385

GOAT price has skyrocketed 214.29% in one month, recently breaking into the $1 billion market cap and securing its place as the 10th largest meme coin. It now stands just ahead of MOG, which closely trails its position in the rankings.
However, recent indicators suggest that GOAT’s uptrend may be weakening, raising questions about whether it can sustain its rally or face a potential correction.
GOAT BBTrend Is Negative For The First Time In 4 Days
GOAT BBTrend has turned negative for the first time since November 17, now sitting at -0.54. This shift suggests that bearish momentum is beginning to take hold, with the asset’s recent upward trajectory starting to weaken potentially.
BBTrend measures the strength and direction of price trends using Bollinger Bands, with positive values indicating an uptrend and negative values signaling a downtrend. A negative BBTrend reflects increased downward pressure, which could indicate the start of a broader market shift.
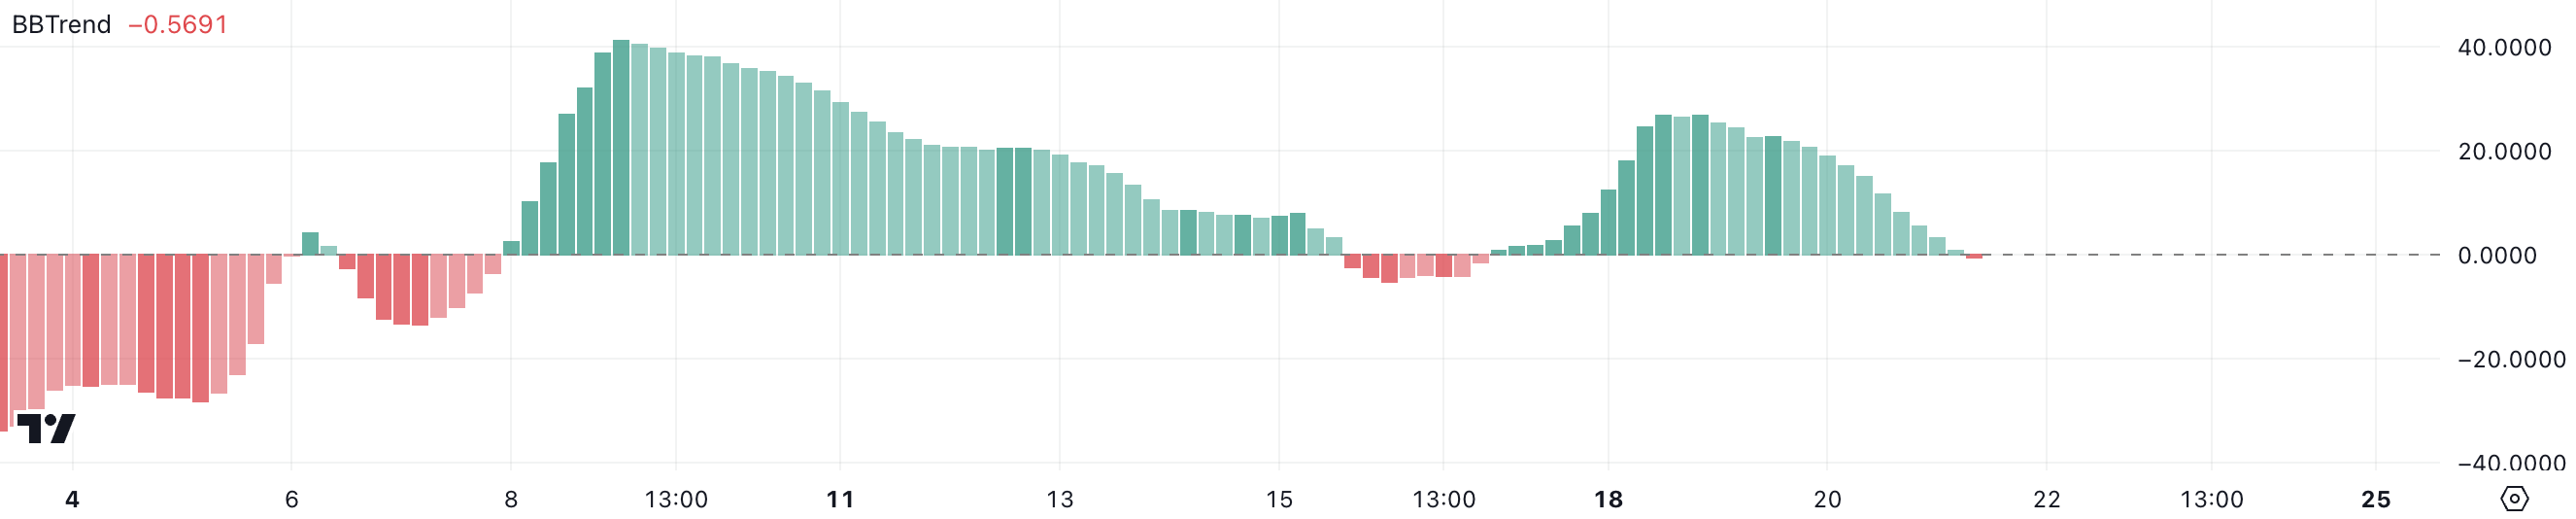
GOAT has had an impressive November, gaining 61% and reaching a new all-time high on November 17.
However, the current negative BBTrend, if it persists and grows, could signal the potential for further bearish momentum.
GOAT Is In A Neutral Zone
GOAT’s RSI has dropped to 52, down from over 70 a few days ago when it reached its all-time high. This decline indicates that buying momentum has cooled off, and the market has moved out of the overbought zone.
The drop suggests a shift toward a more neutral sentiment as traders consolidate gains and the strong bullish pressure seen earlier subsides.
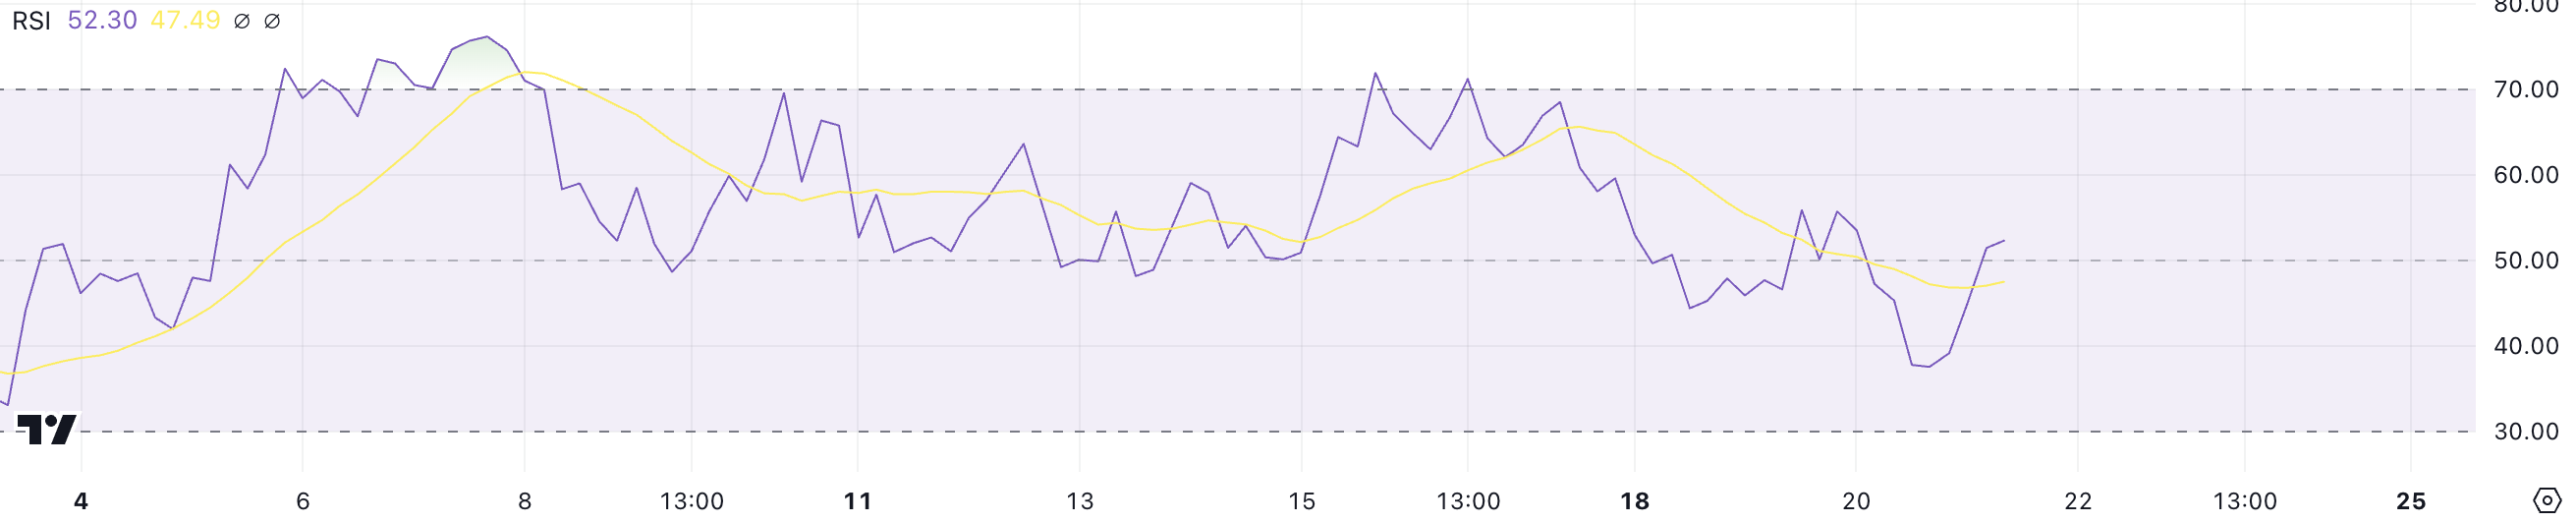
RSI measures the strength and velocity of price changes, with values above 70 indicating overbought conditions and below 30 signaling oversold levels. At 52, GOAT’s RSI is in a neutral zone, neither signaling strong bullish nor bearish momentum.
This could mean the current uptrend is losing strength, and the price may consolidate or move sideways unless renewed buying pressure reignites upward momentum.
GOAT Price Prediction: A New Surge Until $1.50?
If GOAT current uptrend regains strength, it could retest its all-time high of $1.37, establishing its market cap above $1 billion, a fundamental threshold for being among the biggest meme coins in the market today.
Breaking above this level could pave the way for further gains, potentially reaching the next thresholds at $1.40 or even $1.50, signaling renewed bullish momentum and market confidence.
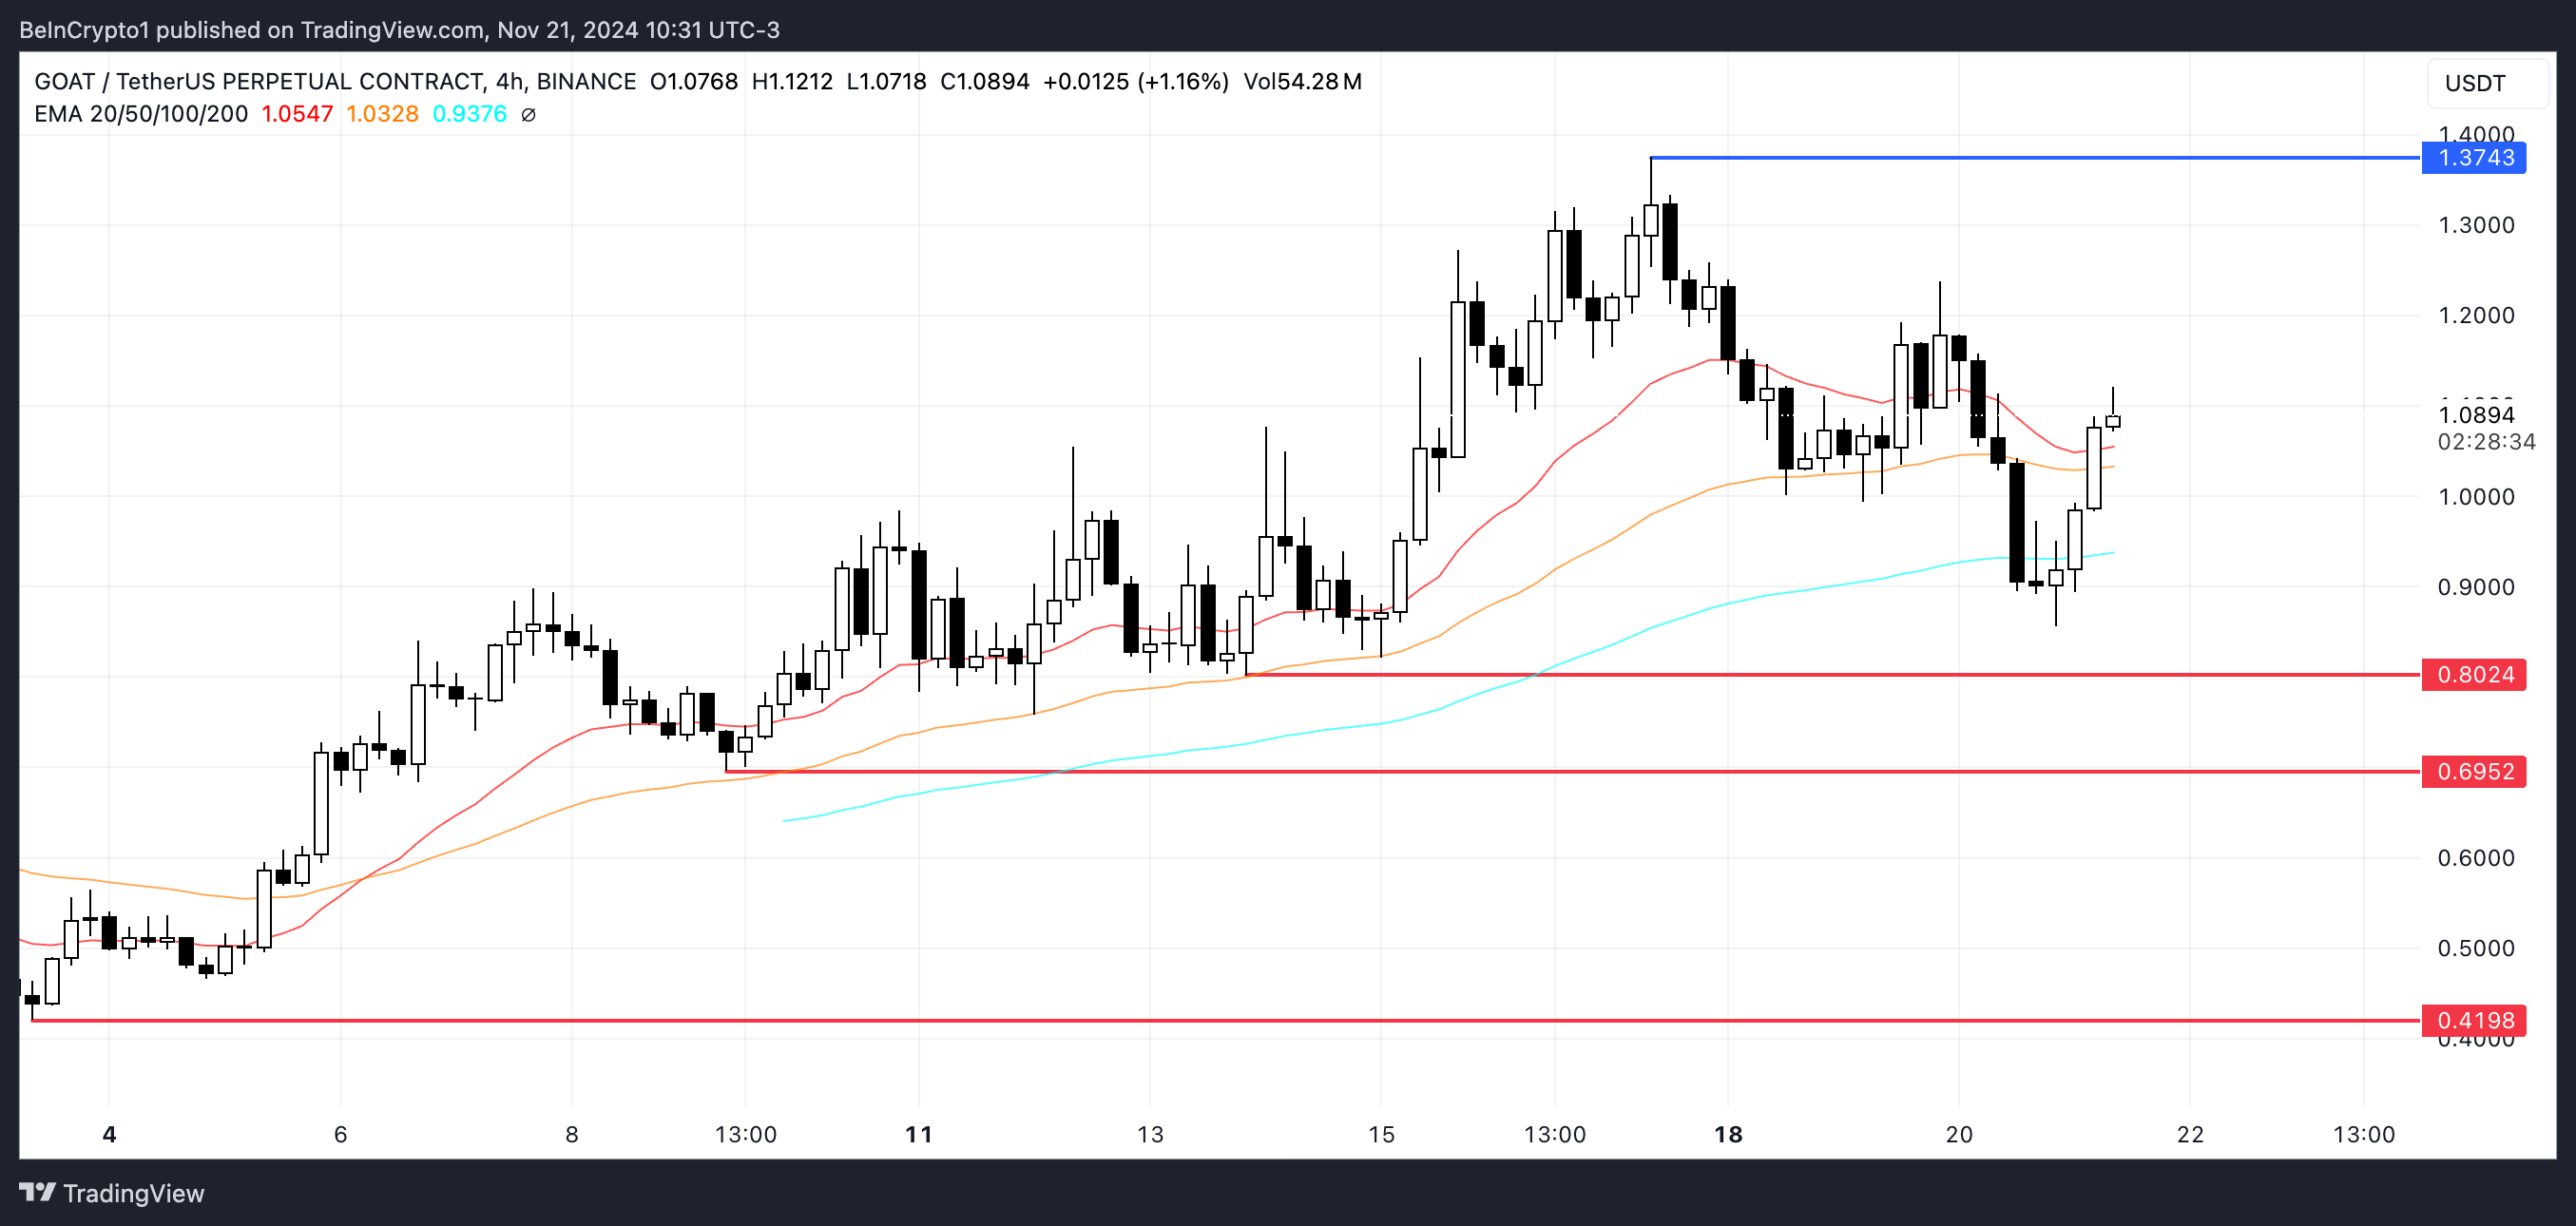
However, as shown by indicators like RSI and BBTrend, the uptrend may be losing steam. If a downtrend emerges, GOAT price could test its nearest support zones at $0.80 and $0.69.
Should these levels fail to hold, the price could fall further, potentially reaching $0.419, putting its position in the top 10 ranking of biggest meme coins at risk.
Disclaimer
In line with the Trust Project guidelines, this price analysis article is for informational purposes only and should not be considered financial or investment advice. BeInCrypto is committed to accurate, unbiased reporting, but market conditions are subject to change without notice. Always conduct your own research and consult with a professional before making any financial decisions. Please note that our Terms and Conditions, Privacy Policy, and Disclaimers have been updated.

BTC Surges to $99K, ETH Shoots, XRP Jumps 25%

Rallies 10% and Targets More Upside
Rallies 10% and Targets More Upside

“Crypto Dad” Chris Giancarlo Emerges Top For White House Crypto Czar Role
Dogecoin Code Appears In CyberTruck And Model 3 Website, Will Tesla Accept DOGE Payments For Cars Soon?

GOAT Price Sees Slower Growth After Reaching $1B Market Cap

2.52 Million Altcoins Are Ruining Crypto’s Future

Animoca Brands Valuation Tanks 75% In Two Years, Here’s Why

Crypto exchange BingX hacked for $43 million

Are The Big Players Losing Interest?

Hong Kong’s Securities Association Tips Authorities On Crypto Self-Regulation

Coinbase cbBTC Set to go Live on Solana
2.52 Million Altcoins Are Ruining Crypto’s Future
Animoca Brands Valuation Tanks 75% In Two Years, Here’s Why
Crypto exchange BingX hacked for $43 million
Are The Big Players Losing Interest?
Hong Kong’s Securities Association Tips Authorities On Crypto Self-Regulation
Coinbase cbBTC Set to go Live on Solana
-

 Market24 hours ago
This is Why MoonPay Shattered Solana Transaction Records
-

 Ethereum21 hours ago
Fundraising platform JustGiving accepts over 60 cryptocurrencies including Bitcoin, Ethereum
-
 Altcoin24 hours ago
BTC Reaches $97K, Altcoins Gains
-

 Market17 hours ago
South Korea Unveils North Korea’s Role in Upbit Hack
-

 Market22 hours ago
Cardano’s Hoskinson Wants Brian Armstrong for US Crypto-Czar
-
 Altcoin15 hours ago
Sui Network Back Online After 2-Hour Outage, Price Slips
-

 Market21 hours ago
Litecoin (LTC) at a Crossroads: Can It Rebound and Rally?
-
 Altcoin14 hours ago
Dogecoin Whale Accumulation Sparks Optimism, DOGE To Rally 9000% Ahead?