
Bitcoin
Google Searches For Bitcoin Keyword Crashes, Why This Is Bullish For Price

The Google searches for the Bitcoin keyword have crashed, indicating a lack of interest among internet users in the flagship crypto. However, crypto analyst Ali Martinez has stated that this is bullish for the Bitcoin price.
Why The Crash In Bitcoin Google Searches Is Bullish
In an X post, Martinez revealed that nobody is searching for Bitcoin (BTC) according to Google trends. He added that this is bullish, meaning that this is a good thing for the BTC price. Typically, a surge in the search for the BTC keyword indicates a massive interest among retail investors.

However, the lack of interest based on Google trends indicates that retail investors have yet to come en masse into the crypto space for this bull run. Therefore, it is bullish, as there is still more room for Bitcoin and other cryptocurrencies to rise to the upside following an influx of these retail investors.
The on-chain analytics platform Santiment also provided insights into why a lack of interest in Bitcoin is usually bullish. They suggested that the flagship crypto will likely hit a new all-time high (ATH) when expectations are low, or there is a lack of interest among crypto enthusiasts.
The platform revealed there are currently 1.8 bullish posts toward BTC for every bearish post. According to Santiment, the market historically moves opposite to the crowd’s expectations. This essentially means that Bitcoin turns out to be most bullish when market participants and even non-crypto natives are bearish.

Santiment reaffirmed this stance in a more recent X post. The platform stated that the crowd’s sentiment toward Bitcoin had been particularly bullish, indicating a high top probability for crypto markets. With BTC retracing below $65,000 on September 30, they expect that there will be some panic sells. Santiment added that if FOMO turns to FUD, the bull market will resume quickly.
How BTC Price Could Move In The Coming Weeks
Martinez has also provided insights into what to expect from the Bitcoin price in the coming weeks. He claimed that the best thing would be for the flagship crypto to drop to $60,000, rebound to $66,000, retrace back to $57,000, and finally break out to a new ATH at $78,000.
The analyst again alluded to this price thesis in a recent X post, suggesting that he is confident this will happen. However, historical trends indicate that BTC could reach a new ATH this month. October is one of Bitcoin’s best months, with the flagship crypto recording double-digit monthly returns most of the time. Therefore, the crypto could reach new highs as the ‘Uptober’ rally begins.

At the time of writing, Bitcoin is trading at around $63,800, down in the last 24 hours, according to data from CoinMarketCap.
Featured image created with Dall.E, chart from Tradingview.com


In an interview with Bitcoin commentator Natalie Brunell, Senator Cynthia Lummis (R-WY) reaffirmed her commitment to establishing a US Strategic Bitcoin Reserve (SBR), disclosing that the Treasury Department is probing its legal authority to purchase and custody BTC on behalf of the federal government. The senator believes such a move could significantly reduce the national debt over the long term.
Senator Lummis Pushes Bitcoin Reserve
Lummis pointed to roughly 200,000 BTC in the US Marshals Service’s asset forfeiture program as a possible starting point: “Working with Treasury, and the Treasury Secretary, we’re trying to find out which assets among those could become the basis of the first year’s investment in a strategic Bitcoin reserve.”
Further clarifying her stance, the senator noted she is determining whether a new law is required or if the administration already has the authority: “What I’m trying to figure out right now is whether it needs to be done legislatively or whether the Treasury Secretary has the authority to do it right now.”
Lummis proposes converting the seized BTC into an official “base investment,” which she says would be the foundation of a larger BTC reserve. If successful, this would mark the first time the US government deliberately and openly accumulated Bitcoin as a strategic asset.
One of Lummis’ main arguments for a SBR is its capacity to trim the federal debt, which she deems “irresponsibly high.” Under her Bitcoin Act, the US could also revalue its gold certificates—currently listed at a decades-old official price of $42 per ounce, far below market value—and deploy the difference toward purchasing BTC in a budget neutral way:
“My legislation would provide that we could take our gold certificates… bring them up to current fair market value for gold and then use that to buy Bitcoin, thereby creating a 1 million Bitcoin reserve over five years.”
She contends that holding this million BTC over a 20-year horizon could “cut the current national debt in half.” Citing extensive modeling—some from advocates like Michael Saylor—she believes the price appreciation of BTC has the potential to deliver significant gains to taxpayers.
New Episode Out Now! 🇺🇸
U.S. Senator Cynthia Lummis is leading the Bitcoin Revolution in Washington.
Her bold plans for America through Bitcoin & digital asset policy promise to reshape the financial system—reduce U.S. debt, protect Bitcoin self-custody, and reinforce dollar… pic.twitter.com/G1Rvl1ORDb
— Natalie Brunell ⚡️ (@natbrunell) April 1, 2025
The senator lauded President Trump’s recent executive orders that aim to make the United States “the digital asset capital of the world” by fostering a favorable environment for BTC mining, regulatory clarity, and a strategic reserve. According to Lummis, those moves stand in stark contrast to prior administrations, where “people neither knew nor wanted to talk about digital assets.”
However, Lummis also underscored the need for bipartisan collaboration, suggesting that while Bitcoin has now garnered interest in Republican circles, it should not become a strictly partisan endeavor: “We want to keep that momentum… We worked extremely hard to keep it bipartisan, so I can’t flip my brain and start to think of it as a partisan issue.”
At press time, BTC traded at $84,202.

Featured image from YouTube, chart from TradingView.com
Editorial Process for bitcoinist is centered on delivering thoroughly researched, accurate, and unbiased content. We uphold strict sourcing standards, and each page undergoes diligent review by our team of top technology experts and seasoned editors. This process ensures the integrity, relevance, and value of our content for our readers.

The market cap of tokenized gold has surpassed $1.2 billion, driven by soaring gold prices and a growing appetite for blockchain-based assets.
Rising interest in tokenized gold is part of a broader movement to modernize storage, trading, and utilization in financial markets.
Gold Meets Blockchain Amid Tokenization Revolution
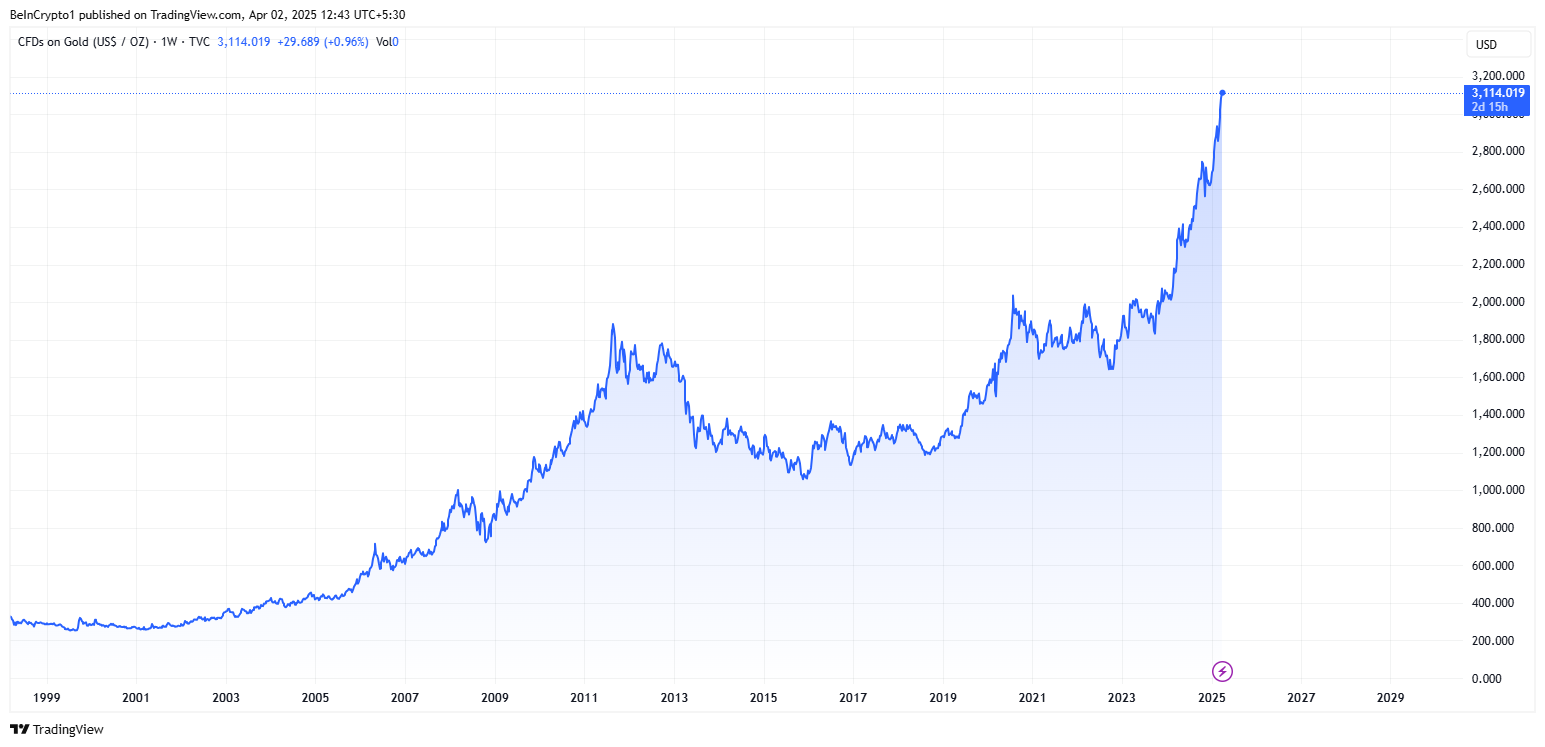
Gold price has reached historic highs above $3,000 per ounce. With this surge, digital representations of precious metals, such as Tether Gold (XAUT) and Paxos Gold (PAXG), capture investor interest.
Don Tapscott, co-founder of Blockchain Research Institute, argues that tokenized gold could transform the $13 trillion gold market by bringing transparency, liquidity, and new financial models.
Based on this assumption, he questioned why gold is still stored in vaults as it was in the 1800s. Meanwhile, assets like Bitcoin (BTC) and stablecoins have gone digital. He believes blockchain technology can revolutionize gold’s role in finance.
“The US government could even tokenize its gold reserves, track them immutably, and use them in innovative ways,” Tapscott explained.
He stated that such an outcome would enable fractional ownership, on-chain verification, and increased accessibility to investors worldwide.
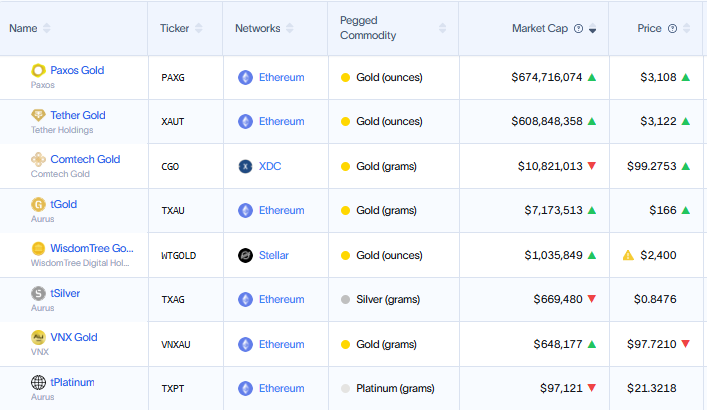
Meanwhile, companies such as Paxos and Tether lead the charge in tokenized gold offerings. Paxos holds a 51.74% market share, while Tether’s holdings follow closely behind at 46.69%.
Publicly listed Matador Technologies is taking a unique approach by tokenizing gold on the Bitcoin blockchain. This offers investors a digital claim on both physical gold and limited-edition digital art.
“We believe that the next generation of financial powerhouses will likely emerge from the tokenization revolution. It’s still early, and the playing field is wide open. Matador and others have the bull by the horns,” Tapscott noted in a recent article.
Gold Tokenization in the US: A Bold Policy Shift?
The momentum behind tokenized gold has also reached the US government. Following President Trump’s March 5 executive order to establish a Strategic Bitcoin Reserve (SBR), policymakers are exploring ways to modernize gold holdings.
Treasury Secretary Scott Bessent has indicated that the US will move to “monetize its assets,” leading some to speculate that Fort Knox gold could be tokenized.
“US Treasury Secretary Scott Bessent says, all the GOLD is there, as he has no plans to visit Fort Knox or to revalue GOLD reserves in a sovereign wealth fund. He speaks on “Bloomberg Surveillance,” Erik Yeung noted.
Senator Cynthia Lummis has also proposed swapping some of the US government’s gold reserves for Bitcoin. US gold reserves are held at a book value of $42 per ounce—unchanged since 1973—despite the market price exceeding $3,000 per ounce.
While the US explores tokenization, geopolitical rivals China and Russia may take an even bolder step—launching a gold-backed stablecoin. Bitcoin maximalist Max Keiser recently highlighted BRICS’ plans to introduce a gold-backed stablecoin.
“The BRICS, principally Russia, China & India, will counter any attempt by the US to introduce a hegemonic, USD-backed stablecoin — with a Gold-backed stablecoin. The majority of the global market will favor a Gold-backed coin since it’s inflation-proof (unlike the USD) and doesn’t boost unwelcome US hegemony. India already runs on a defacto Gold standard and Sharia law in Muslim countries would dictate Gold over a USD riba-coin as well. To be clear, a BTC-backed stablecoin is not fit for purpose due to volatility,” Keiser stated.
Further, Keiser suggested that a stablecoin backed by gold would outcompete USD-backed stablecoins in global markets. He argues that gold is more trusted than the US dollar, tracks inflation effectively, and remains minimally volatile compared to Bitcoin’s price swings.
Russia’s recent rejection of Bitcoin for its National Wealth Fund in favor of gold and the Chinese yuan adds weight to this theory.
With an estimated 50,000 tonnes of combined gold reserves, China and Russia could leverage blockchain technology to introduce a new gold-backed digital asset. Such an action would challenge the US dollar’s dominance in global trade.
Gold vs. Bitcoin: The Safe Haven Debate Intensifies
Gold’s record-breaking rally has reignited debates over its role as a safe-haven asset compared to Bitcoin. Some analysts speculate that Bitcoin could soon follow gold’s trajectory, setting new all-time highs.
However, in economic uncertainty and President Trump’s 2025 tariff policies, gold remains the preferred safe-haven asset. Historically, gold has been the go-to store of value during trade wars and inflationary periods. Meanwhile, Bitcoin’s volatility raises concerns for risk-averse investors.
Despite these differences, the rise of tokenized gold highlights a convergence between traditional and digital finance. As financial markets advance and investors rebalance their portfolios, gold and Bitcoin will likely coexist in a contemporary monetary system.
Whether through tokenization, gold-backed stablecoins, or government-led blockchain initiatives, the financial playing field is shifting.
As traditional institutions increasingly adopt blockchain, the stage is set for transforming how the world perceives, trades, and stores gold relative to Bitcoin.
Disclaimer
In adherence to the Trust Project guidelines, BeInCrypto is committed to unbiased, transparent reporting. This news article aims to provide accurate, timely information. However, readers are advised to verify facts independently and consult with a professional before making any decisions based on this content. Please note that our Terms and Conditions, Privacy Policy, and Disclaimers have been updated.

Bitcoin ETFs (exchange-traded funds) continue to record negative flows this week as President Trump’s Liberation Day countdown continues.
Sentiment is cautious across crypto markets, with traders and investors adopting a wait-and-see approach.
Bitcoin ETF See Outflows Amid Investor Caution
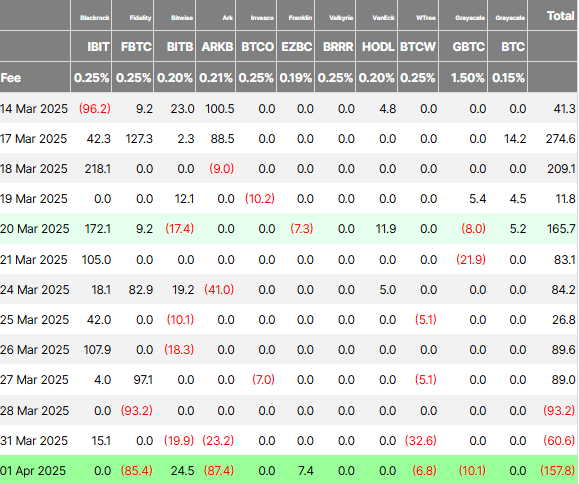
Data on Farside Investors shows two consecutive days of net outflows for Bitcoin ETFs since Monday. Financial instruments from Bitwise (BITB), Ark Invest (ARKB), and WisdomTree (BTCW) were in the frontline for Monday’s $60.6 million outflows, with only BlackRock’s IBIT seeing positive flows.
Meanwhile, Tuesday saw even more outflows, approaching $158 million, with Bitwise and Ark Invest leading the charge. Then, on April 1, BlackRock’s IBIT recorded zero flows. Meanwhile, Ethereum ETFs recorded net outflows of $3.6 million, data on Farside shows. This suggests a cautious sentiment among institutional investors.
“The Spot Bitcoin ETFs saw $157.8 million outflow yesterday. The Spot Ethereum ETFs saw a $3.6 million outflow. Institutions are reducing risk ahead of today’s tariff announcement,” analyst Crypto Rover noted.
Indeed, sentiment suggests traders are exercising caution, choosing to remain in “wait-and-see” mode. The caution comes ahead of Trump’s Liberation Day announcement, which is due later in the day on April 2.
With POTUS poised to unveil sweeping new tariffs, traders and investors across financial playing fields wait to see the scope of an onslaught that could spark a global trade war. Specifically, there is generally very little information about the tariffs’ specifics, which creates uncertainty regarding their impact on the broader economy and the crypto market.
“The White House has not reached a firm decision on their tariff plan,” Bloomberg reported, citing people close to the matter.
Despite the lack of clarity, it is understandable why investors would be cautious considering the impact of previous tariff announcements on Bitcoin price. Meanwhile, analysts predict extreme market volatility, with potential stock and crypto crashes reaching 10-15% if Trump enforces broad tariffs.
“April 2nd is similar to election night. It is the biggest event of the year by an order of magnitude. 10x more important than any FOMC, which is a lot. And anything can happen,” economic analyst Alex Krüger predicted.
While sentiment is cautious in the crypto market, some investors are channeling toward gold as a safe haven. A Bank of America survey showed that 58% of fund managers prefer gold as a trade war safe haven, while only 3% back Bitcoin.
These findings came as institutional investors cite Bitcoin’s volatility and limited crisis-time liquidity as key barriers to its safe-haven adoption. Trade tensions have historically driven capital into safe-haven assets.
With Trump’s Liberation Day announcement looming, investors preemptively position themselves again, favoring gold over Bitcoin.
Nevertheless, despite Bitcoin’s struggle to capture institutional safe-haven flows, its long-term narrative remains intact. This is seen with Bitcoin supply on exchanges dropping to just 7.53%, the lowest since February 2018.
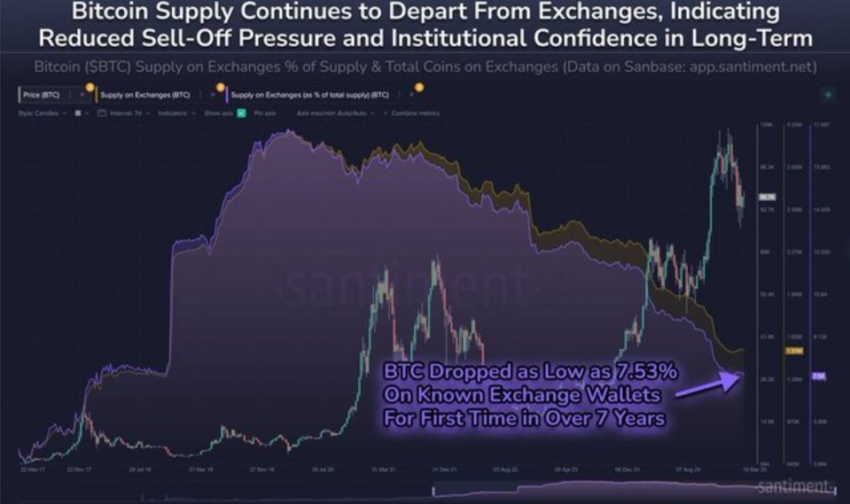
When an asset’s supply on exchanges reduces, investors are unwilling to sell, suggesting strong long-term holder confidence.
Disclaimer
In adherence to the Trust Project guidelines, BeInCrypto is committed to unbiased, transparent reporting. This news article aims to provide accurate, timely information. However, readers are advised to verify facts independently and consult with a professional before making any decisions based on this content. Please note that our Terms and Conditions, Privacy Policy, and Disclaimers have been updated.

Binance Sidelines Pi Network Again In Vote To List Initiative, Here’s All

XRP Price Reversal Toward $3.5 In The Works With Short And Long-Term Targets Revealed

First Digital Trust Denies Justin Sun’s Allegations, Claims Full Solvency

Will Cardano Price Bounce Back to $0.70 or Crash to $0.60?

Why A Massive Drop To $1,400 Could Rock The Underperformer

How Will Elon Musk Leaving DOGE Impact Dogecoin Price?

2.52 Million Altcoins Are Ruining Crypto’s Future

Animoca Brands Valuation Tanks 75% In Two Years, Here’s Why

Crypto exchange BingX hacked for $43 million

Are The Big Players Losing Interest?

Hong Kong’s Securities Association Tips Authorities On Crypto Self-Regulation

Coinbase cbBTC Set to go Live on Solana
2.52 Million Altcoins Are Ruining Crypto’s Future
Animoca Brands Valuation Tanks 75% In Two Years, Here’s Why
Crypto exchange BingX hacked for $43 million
Are The Big Players Losing Interest?
Hong Kong’s Securities Association Tips Authorities On Crypto Self-Regulation
Coinbase cbBTC Set to go Live on Solana
-

 Market24 hours ago
Bitcoin Price Bounces Back—Can It Finally Break Resistance?
-

 Market19 hours ago
BNB Price Faces More Downside—Can Bulls Step In?
-
 Altcoin24 hours ago
Tether Expands Bitcoin Reserves with 8,888 BTC Buy—What’s the Plan?
-

 Market21 hours ago
XRP Recovery Stalls—Are Bears Still In Control?
-
 Altcoin21 hours ago
Pi Network Faces Community Backlash, Is Pi Coin Price Heading to Zero?
-

 Market20 hours ago
VanEck Sets Stage for BNB ETF with Official Trust Filing
-

 Bitcoin19 hours ago
Tokenized Gold Market Cap Tops $1.2 Billion as Gold Prices Surge
-

 Market23 hours ago
Ethereum Price Approaches Resistance—Will It Smash Through?