
Market
Will Bullish Momentum Hold Amid Resistance Levels?
Dogecoin (DOGE) price has recently displayed both promising gains and potential warning signs. While it has enjoyed some impressive upward movements, uncertainty remains about whether it can sustain this momentum. Traders are paying close attention as the coin approaches important resistance levels that could shape its next steps.
At the same time, there are hints that DOGE may face challenges in maintaining its recent strength. The coming days will likely be pivotal in determining its short-term trajectory.
DOGE BBTrend Reached Its Biggest Level Since May
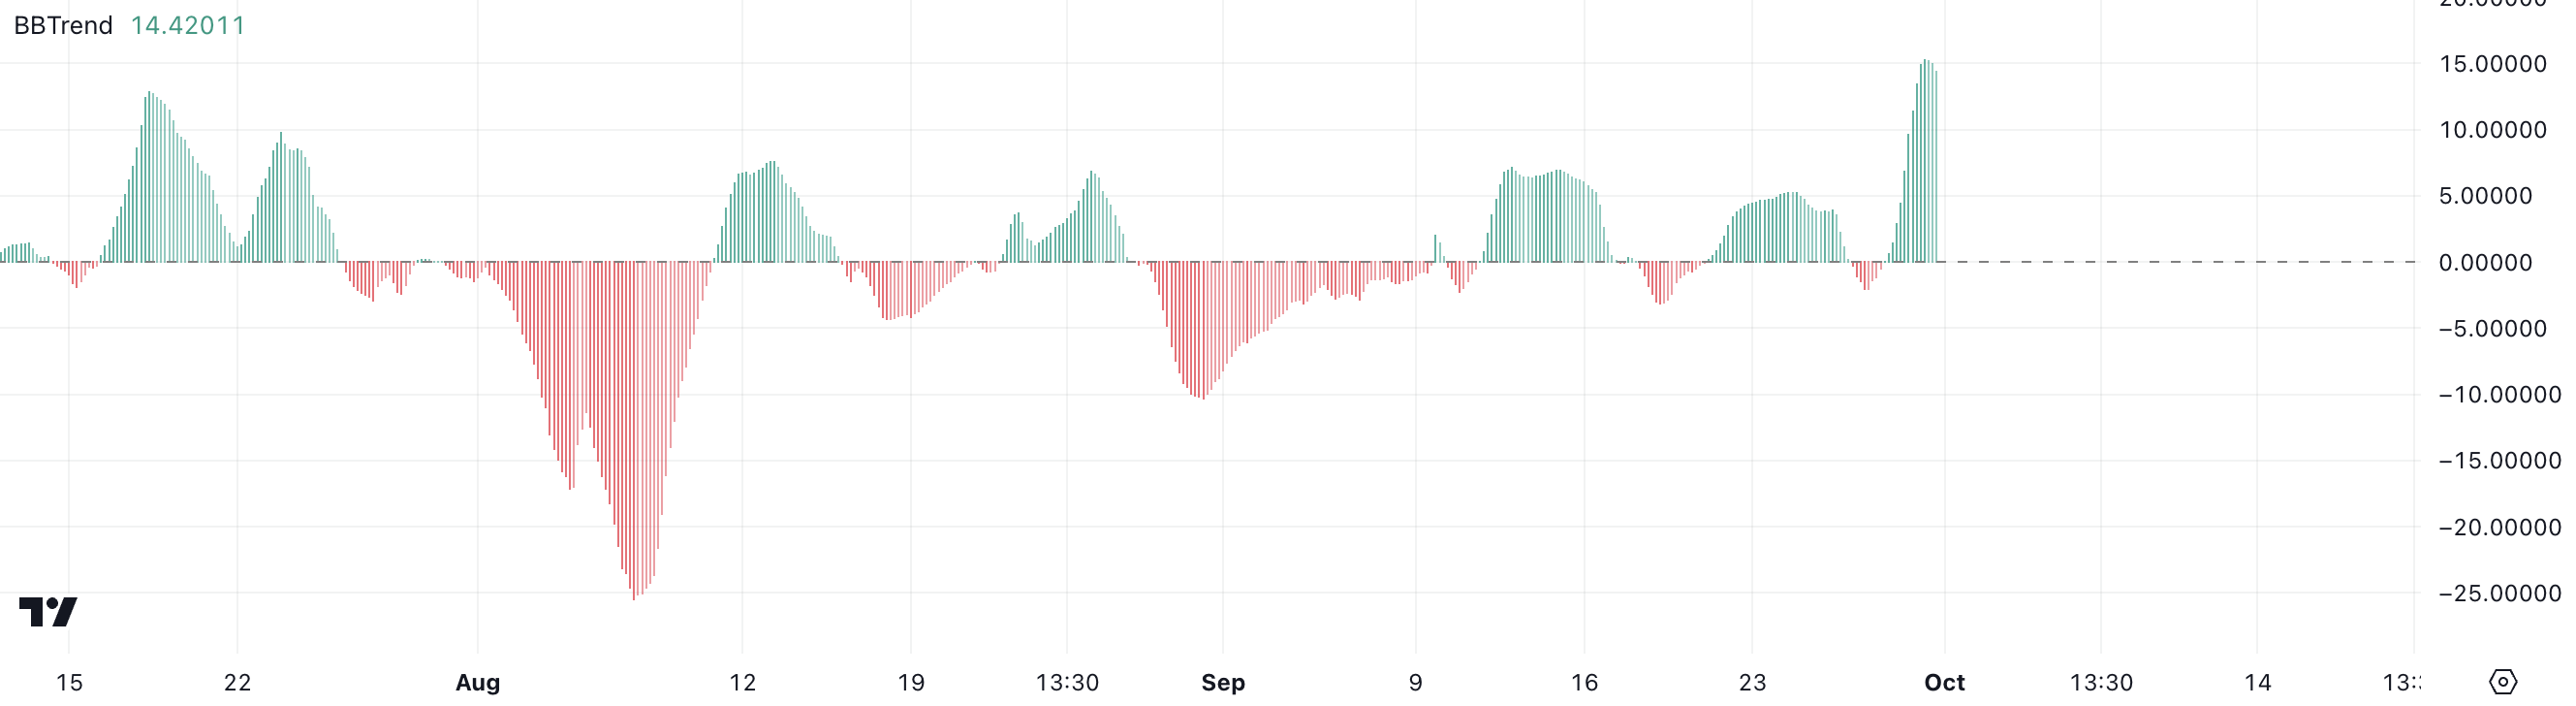
DOGE’s BBTrend recently surged to its highest level since May 2024, surpassing 15, a clear signal of significant bullish momentum. This peak marked a strong upward force in the market, where DOGE was riding on heightened buying interest and volatility.
However, following this impressive climb, the BBTrend began to dip slightly, although it remains close to 15, indicating that the trend hasn’t yet reversed but could be at a critical moment.
The BBTrend, or Bollinger Bands Trend, is a key technical indicator that measures the strength and sustainability of price movements by analyzing how far the price deviates from the Bollinger Bands. Historically, DOGE’s BBTrend has crossed above 12 during its last major rallies, signaling the continuation of upward momentum.
Read more: How to Buy Dogecoin (DOGE) Anonymously: A Step-by-Step Guide
If the BBTrend remains above this critical level, it suggests that DOGE could extend its uptrend and maintain its current strength. However, the recent pullback from the 15-mark also raises concerns about potential exhaustion.
While a BBTrend above 12 is often a bullish signal, this slight decline could indicate that DOGE’s momentum is beginning to weaken. It’s possible that the coin may be entering a phase of consolidation or even losing its steam after a prolonged rally.
Therefore, while DOGE has demonstrated strong price action, it’s essential to watch closely for whether it can sustain its BBTrend above 12 or if further declines in the metric will confirm a shift in market sentiment, potentially signaling the end of its upward run.
DOGE ADX Shows Its Uptrend Is Losing Steam
DOGE’s ADX is currently sitting at 33.68, down from a recent high of 45.69 over the last few days. This decline suggests that while the trend still holds some strength, DOGE price could be starting to lose momentum. The ADX, or Average Directional Index, is a key indicator used to measure the strength of a trend, regardless of its direction.
Typically, an ADX above 25 indicates a strong trend, while a value below 20 suggests a weak or non-trending market. Higher values, like those near 45, indicate a very powerful trend, which DOGE recently exhibited. With the ADX now dropping to 33.68, this is still a healthy level, showing that the uptrend remains in play.
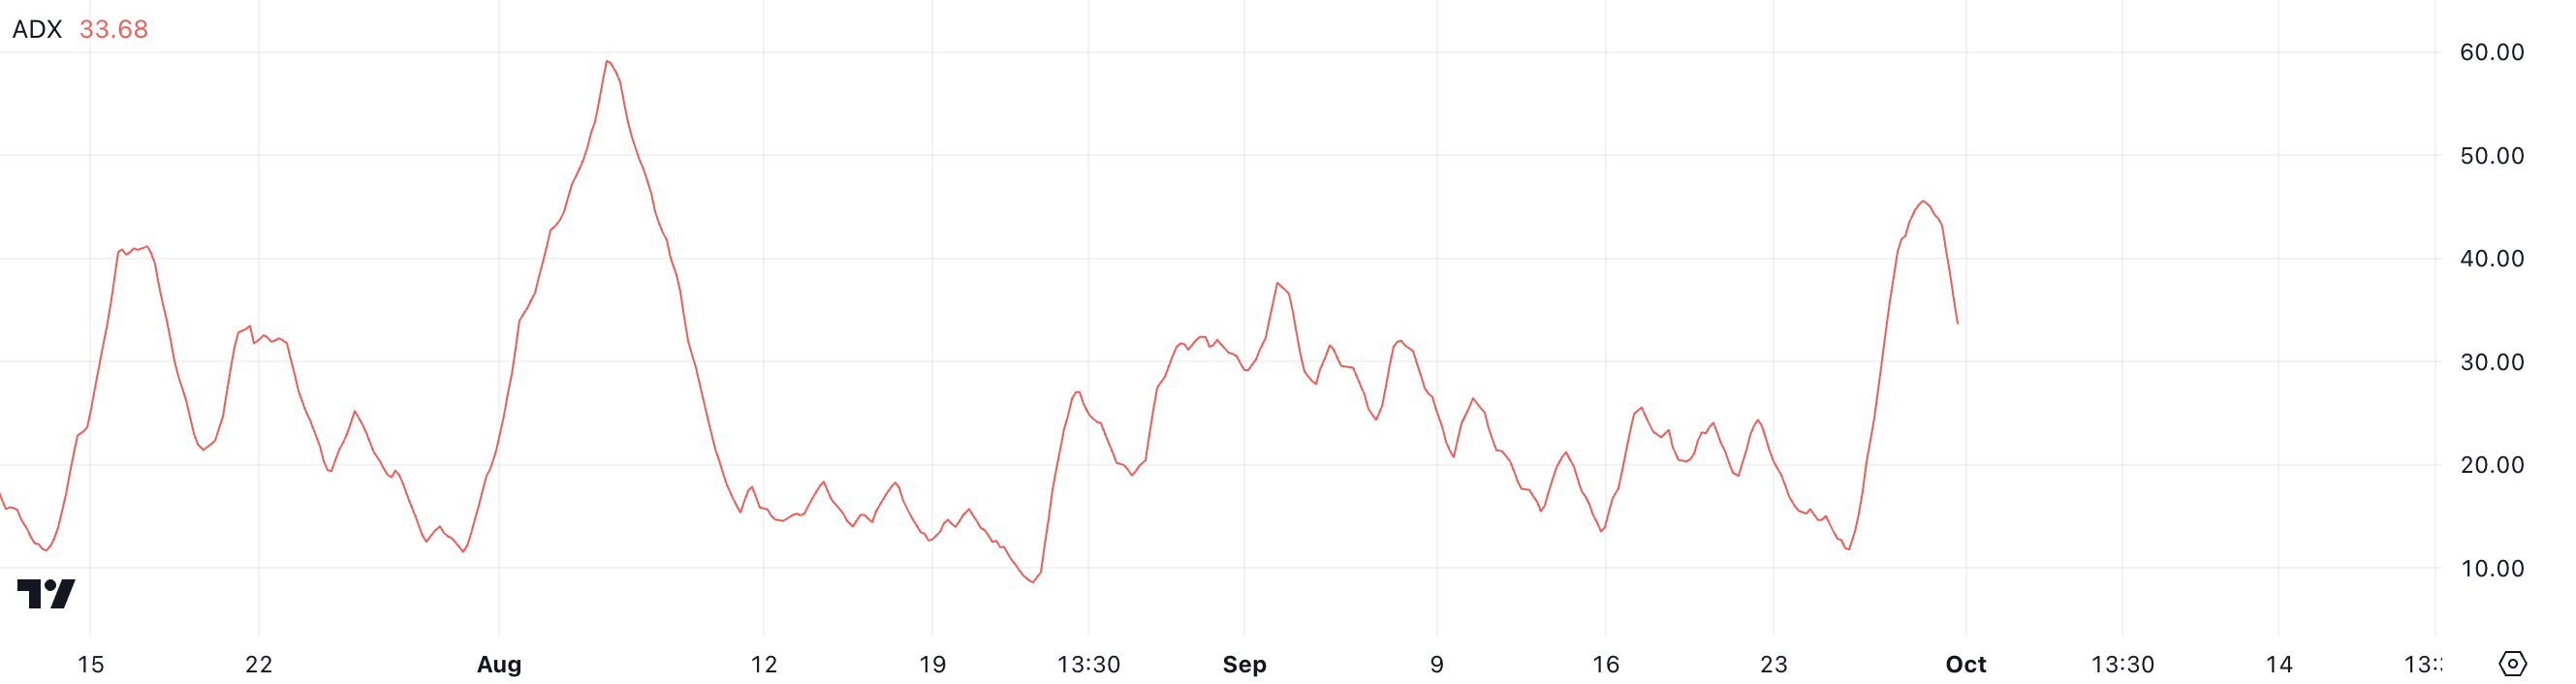
However, the noticeable drop from its higher value raises a cautionary signal. While 33.68 is still considered strong and indicates that DOGE’s price movement has not lost all its momentum, the decline from 45 could mean that the bullish energy is starting to fade.
This weakening trend strength could imply that the hype driving DOGE’s recent price rise is waning. If the ADX continues to fall, it might suggest that the uptrend is at risk of reversing or entering a consolidation phase.
DOGE Price Prediction: Can It Break The $0.14 Barrier In October?
DOGE’s EMA lines are currently in a bullish formation, having recently experienced a golden cross just a few days ago, which triggered a sharp 30% increase in price. A golden cross occurs when the short-term Exponential Moving Average (EMA) crosses above the long-term EMA, signaling a potential upward trend.
While these EMAs are still showing bullish signs, the short-term EMA has started to drop significantly over the past few days. This decline in the short-term EMA could be an early warning that DOGE’s momentum is starting to slow down.
EMA lines smooth out price data, giving more weight to recent prices, and they help traders identify trends more accurately. In DOGE’s case, these EMAs initially pointed to a strong uptrend, but with the short-term line weakening, there may be a shift in market sentiment.
Read more: Dogecoin (DOGE) vs Shiba Inu (SHIB): What’s the Difference?
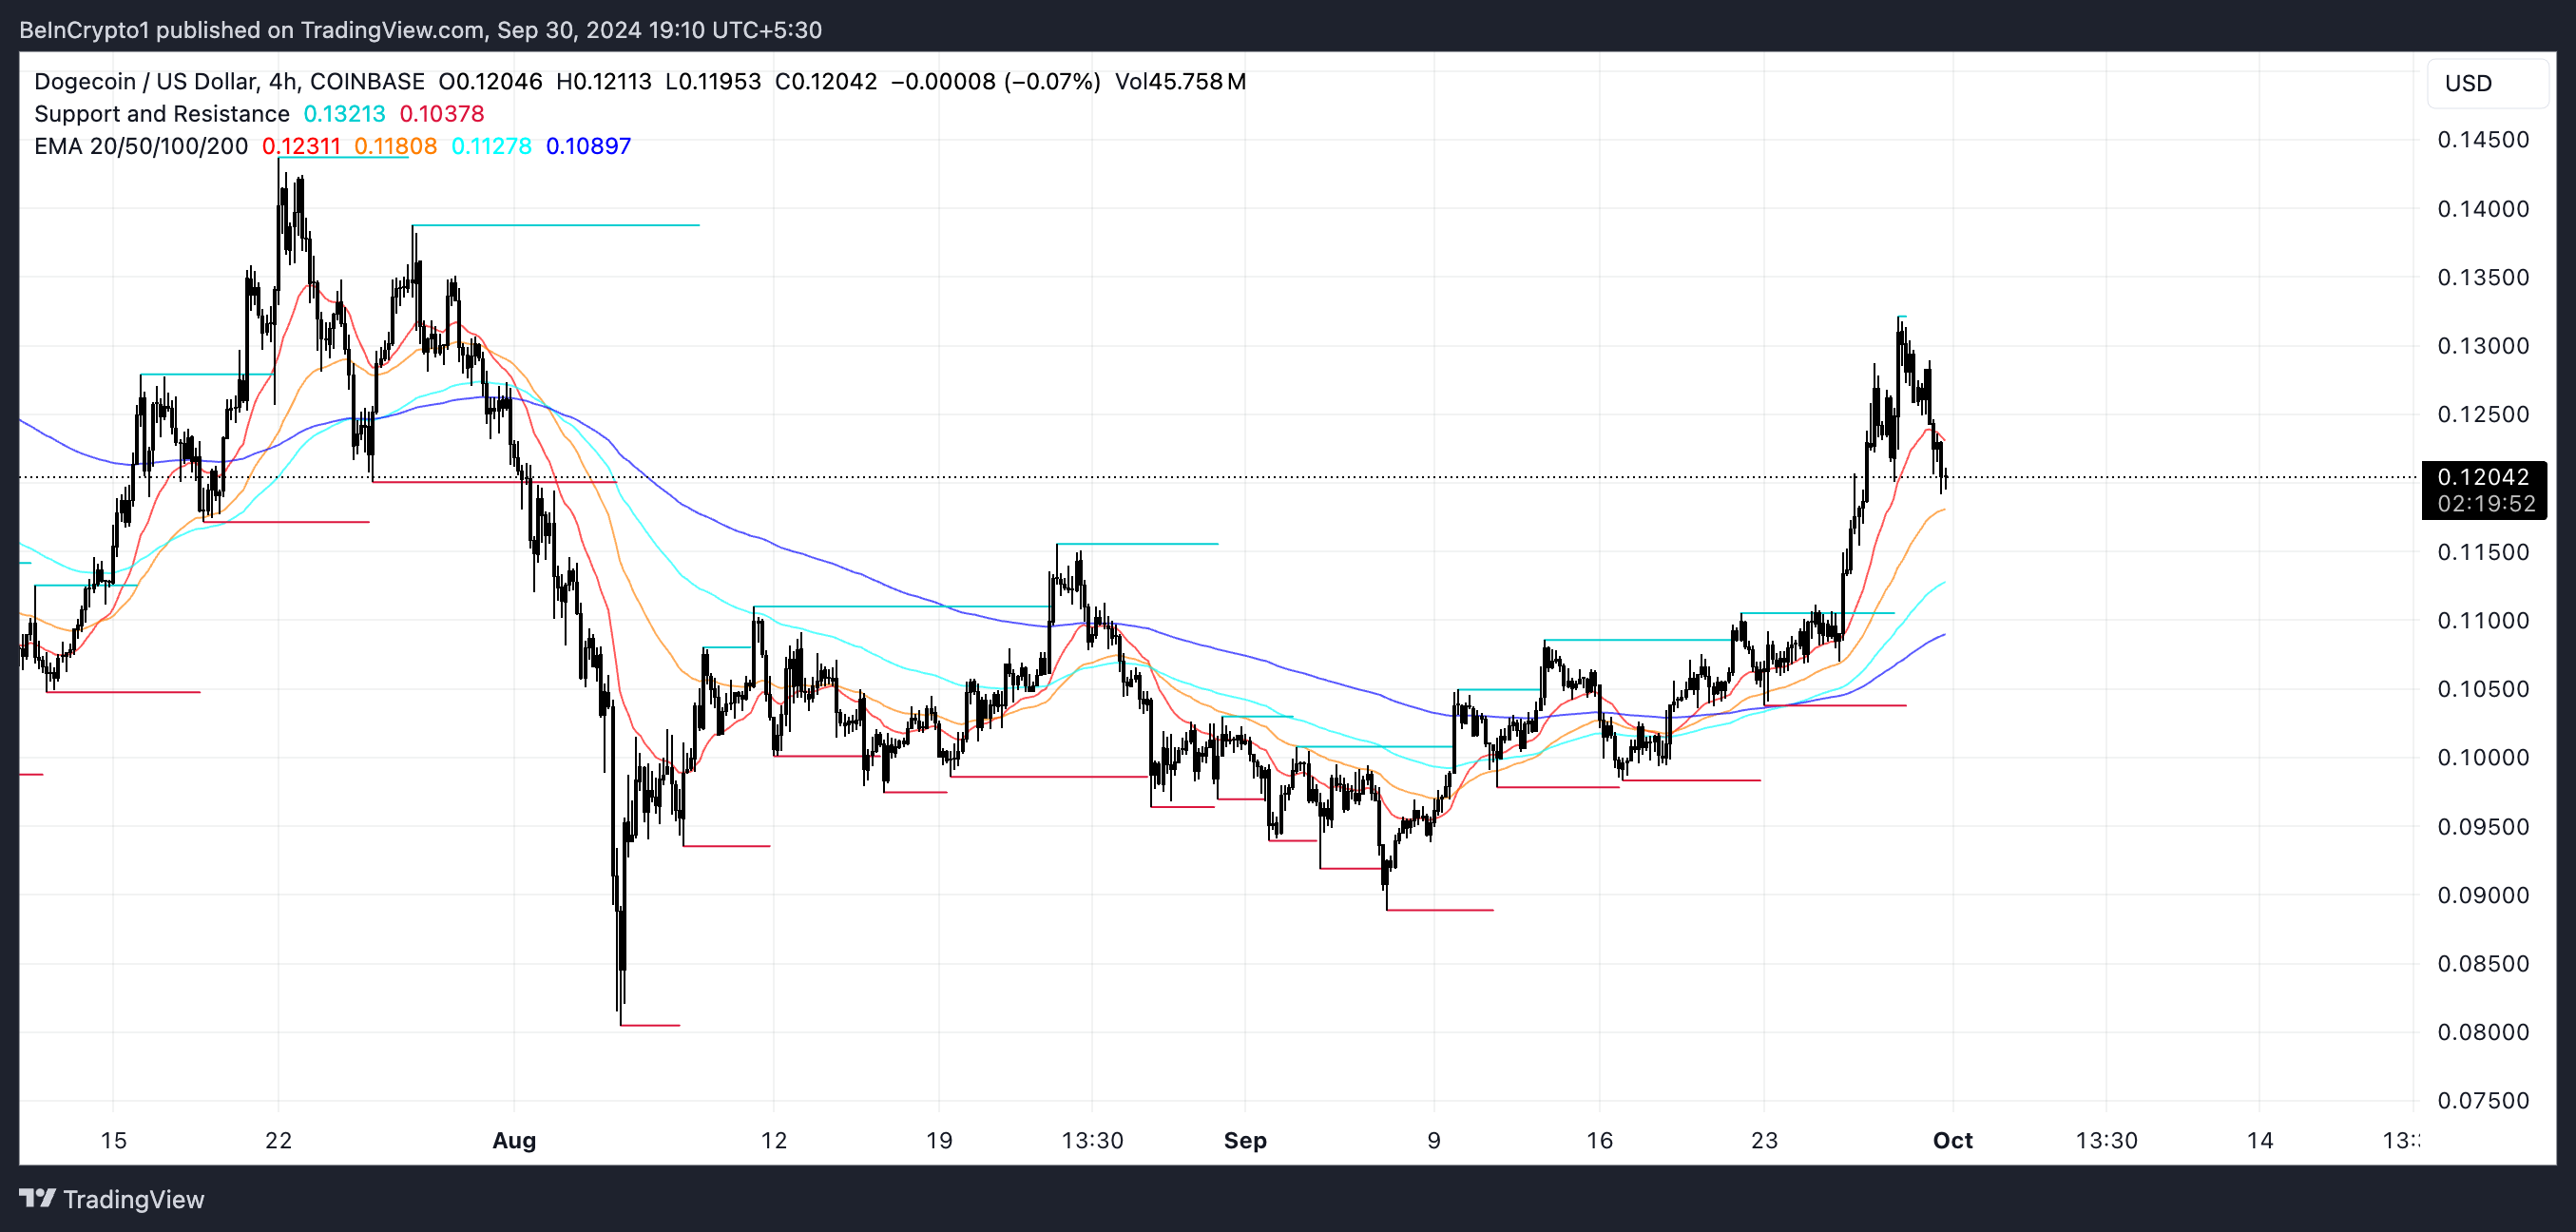
DOGE has struggled to break through key resistance levels at $0.135 and $0.128. These levels have held firm despite the recent rally, and if DOGE manages to break above them, there’s a strong chance it could quickly touch $0.14. However, the weakening ADX, which measures the strength of a trend, suggests that the bullish momentum is fading as other meme coins start to attract more attention.
With the ADX losing steam, the trend may not be strong enough to push DOGE past these resistances, and instead, a reversal could be on the horizon. If this happens, DOGE’s price could drop to $0.098 or even as low as $0.089 in the coming days.
Disclaimer
In line with the Trust Project guidelines, this price analysis article is for informational purposes only and should not be considered financial or investment advice. BeInCrypto is committed to accurate, unbiased reporting, but market conditions are subject to change without notice. Always conduct your own research and consult with a professional before making any financial decisions. Please note that our Terms and Conditions, Privacy Policy, and Disclaimers have been updated.


XRP price started a fresh decline below the $2.080 zone. The price is now recovering some losses and might face hurdles near the $2.150 level.
- XRP price started a fresh decline after it failed to clear the $2.20 resistance zone.
- The price is now trading below $2.120 and the 100-hourly Simple Moving Average.
- There is a connecting bearish trend line forming with resistance at $2.10 on the hourly chart of the XRP/USD pair (data source from Kraken).
- The pair might extend losses if it fails to clear the $2.150 resistance zone.
XRP Price Faces Resistance
XRP price failed to continue higher above the $2.20 resistance zone and reacted to the downside, like Bitcoin and Ethereum. The price declined below the $2.150 and $2.10 levels.
The pair even declined below the $2.050 zone. A low was formed at $2.023 and the price is now attempting a recovery wave. There was a move above the $2.050 level. The price cleared the 23.6% Fib retracement level of the recent decline from the $2.215 swing high to the $2.023 low.
The price is now trading below $2.120 and the 100-hourly Simple Moving Average. On the upside, the price might face resistance near the $2.10 level. There is also a connecting bearish trend line forming with resistance at $2.10 on the hourly chart of the XRP/USD pair. The trend line is near the 50% Fib retracement level of the recent decline from the $2.215 swing high to the $2.023 low.

The first major resistance is near the $2.150 level. The next resistance is $2.1680. A clear move above the $2.1680 resistance might send the price toward the $2.20 resistance. Any more gains might send the price toward the $2.220 resistance or even $2.250 in the near term. The next major hurdle for the bulls might be $2.2880.
Another Decline?
If XRP fails to clear the $2.120 resistance zone, it could start another decline. Initial support on the downside is near the $2.050 level. The next major support is near the $2.020 level.
If there is a downside break and a close below the $2.020 level, the price might continue to decline toward the $2.00 support. The next major support sits near the $1.880 zone.
Technical Indicators
Hourly MACD – The MACD for XRP/USD is now losing pace in the bearish zone.
Hourly RSI (Relative Strength Index) – The RSI for XRP/USD is now above the 50 level.
Major Support Levels – $2.050 and $2.020.
Major Resistance Levels – $2.120 and $2.150.
Brian Quintenz, the incoming Chair of the US CFTC (Commodity Futures Trading Commission), has begun meeting with Capitol Hill lawmakers before his nomination hearing.
On Monday, Quintenz met with Senator Chuck Grassley (R-IA) to discuss key regulatory issues, including the CFTC’s role in overseeing crypto spot markets.
CFTC Targets Crypto Spot Market After Derivatives
Brian Quintenz met with Republican Senator from Iowa Chuck Grassley to discuss another element in the CFTC’s crypto market structure regulation agenda. This time, the focus is on crypto spot markets.
“It was wonderful to meet with you Chuck Grassley and discuss your leadership on whistleblower issues as well as the future of the agency,” Quintenz stated.
Grassley also commented on their discussion. He highlighted the CFTC Whistleblower Protection Program for spot crypto markets as part of the agenda. Notably, Grassley is a member of the Senate AG Committee, the legislative body overseeing the CFTC.
Eleanor Terrett, host of the Crypto America podcast, indicated that the Senate AG Committee will have a significant role in part of the CFTC’s crypto regulation agenda. Specifically, it would have an outsized say in whether the CFTC could gain expanded jurisdiction over crypto spot markets.
The meeting comes as the CFTC moves closer to expanding its role in crypto regulation. US President Donald Trump tapped Quintenz, a former executive at venture capital firm Andreessen Horowitz (a16z), to lead the agency.
His appointment is part of Trump’s broader plans to reshape crypto oversight. This could potentially give the CFTC greater authority over digital asset markets.
Meanwhile, regulatory developments surrounding crypto have accelerated in recent weeks. The CFTC eased regulatory hurdles for the crypto derivatives market only days ago. The move will enhance market efficiency and attract institutional investors.
Beyond derivatives and spot markets, the CFTC is also exploring other areas of crypto oversight. The agency recently announced plans to host a roundtable discussion on prediction market regulation. It aims to address the regulation of decentralized prediction platforms.
Stablecoins are also on the agency’s radar. The CFTC also revealed a forum to discuss stablecoin regulation and potential risks associated with their widespread adoption.
Additionally, the Federal Deposit Insurance Corporation (FDIC) and the CFTC revoked previous crypto-related guidelines, signaling a shift in regulatory strategy.
Crypto markets can also not rule out the possibility of further collaboration between key agencies in the broader industry. Reports indicate that the US SEC (Securities and Exchange Commission) and the CFTC have discussed reviving a joint advisory committee to coordinate on crypto regulation.
If revived, the committee could serve as a bridge between the agencies. This would address concerns over jurisdictional overlap and streamlining oversight efforts.
As Quintenz prepares for his nomination hearing, his meetings with lawmakers suggest that crypto regulation will be a top priority for the CFTC moving forward.
Disclaimer
In adherence to the Trust Project guidelines, BeInCrypto is committed to unbiased, transparent reporting. This news article aims to provide accurate, timely information. However, readers are advised to verify facts independently and consult with a professional before making any decisions based on this content. Please note that our Terms and Conditions, Privacy Policy, and Disclaimers have been updated.
Solana started a fresh decline below the $132 support zone. SOL price is now consolidating and might struggle to recover above the $126 resistance.
- SOL price started a recovery wave from the $122 support zone against the US Dollar.
- The price is now trading below $130 and the 100-hourly simple moving average.
- There is a key rising channel forming with support at $124 on the hourly chart of the SOL/USD pair (data source from Kraken).
- The pair could start a fresh increase if the bulls clear the $126 zone.
Solana Price Faces Resistance
Solana price started a fresh decline below the $135 and $132 levels, like Bitcoin and Ethereum. SOL even declined below the $125 support level before the bulls appeared.
A low was formed at $122.64 and the price recently started a consolidation phase. There was a minor increase above the $125 level. The price tested the 23.6% Fib retracement level of the downward move from the $140 swing high to the $122 low.
Solana is now trading below $126 and the 100-hourly simple moving average. There is also a key rising channel forming with support at $124 on the hourly chart of the SOL/USD pair.
On the upside, the price is facing resistance near the $126 level. The next major resistance is near the $128 level. The main resistance could be $132 or the 50% Fib retracement level of the downward move from the $140 swing high to the $122 low.

A successful close above the $132 resistance zone could set the pace for another steady increase. The next key resistance is $136. Any more gains might send the price toward the $142 level.
Another Decline in SOL?
If SOL fails to rise above the $128 resistance, it could start another decline. Initial support on the downside is near the $124 zone. The first major support is near the $122 level.
A break below the $122 level might send the price toward the $115 zone. If there is a close below the $115 support, the price could decline toward the $102 support in the near term.
Technical Indicators
Hourly MACD – The MACD for SOL/USD is losing pace in the bearish zone.
Hourly Hours RSI (Relative Strength Index) – The RSI for SOL/USD is above the 50 level.
Major Support Levels – $124 and $122.
Major Resistance Levels – $128 and $132.

XRP Bulls Fight Back—Is a Major Move Coming?

A Make or Break Situation As Ripple Crypto Flirts Around $2

CFTC’s Crypto Market Overhaul Under New Chair Brian Quintenz

$2,300 Emerges As The Most Crucial Resistance

Solana (SOL) Holds Steady After Decline—Breakout or More Downside?

Ethereum Price Faces a Tough Test—Can It Clear the Hurdle?

2.52 Million Altcoins Are Ruining Crypto’s Future

Animoca Brands Valuation Tanks 75% In Two Years, Here’s Why

Crypto exchange BingX hacked for $43 million

Are The Big Players Losing Interest?

Hong Kong’s Securities Association Tips Authorities On Crypto Self-Regulation

Coinbase cbBTC Set to go Live on Solana
2.52 Million Altcoins Are Ruining Crypto’s Future
Animoca Brands Valuation Tanks 75% In Two Years, Here’s Why
Crypto exchange BingX hacked for $43 million
Are The Big Players Losing Interest?
Hong Kong’s Securities Association Tips Authorities On Crypto Self-Regulation
Coinbase cbBTC Set to go Live on Solana
-

 Bitcoin23 hours ago
US Macroeconomic Indicators This Week: NFP, JOLTS, & More
-

 Market22 hours ago
Don’t Fall for These Common Crypto Scams
-
 Bitcoin15 hours ago
Strategy Adds 22,048 BTC for Nearly $2 Billion
-
 Market20 hours ago
Strategic Move for Trump Family in Crypto
-

 Market19 hours ago
Top Crypto Airdrops to Watch in the First Week of April
-
 Market14 hours ago
Trump Family Gets Most WLFI Revenue, Causing Corruption Fears
-
 Altcoin19 hours ago
$33 Million Inflows Signal Market Bounce
-

 Ethereum14 hours ago
Ethereum’s Price Dips, But Investors Seize The Opportunity To Stack Up More ETH