
Market
Mixed Signals Leave Traders Uncertain

Tron (TRX) price is showing mixed signals, leaving traders uncertain about its next move. Recent indicators suggest a balance between bullish and bearish forces, with no clear direction emerging yet.
With its market position closely tied to next movements, TRX could either push higher or face a potential decline.
TRX Aroon Indicator Shows Mixed Signals
The Aroon indicator for Tron currently shows an Aroon Up value of 64.29% and an Aroon Down value of 7.14%. These numbers suggest that TRX has experienced recent highs, but the upward trend is not particularly strong, while the lack of recent lows points to minimal bearish pressure.
The Aroon indicator is a tool used to gauge the strength of a trend by measuring the time between highs (Aroon Up) and lows (Aroon Down) over a specific period. When the Aroon Up is above 70%, it signals a strong uptrend. On the other hand, an Aroon Down above 70% suggests a strong downtrend.
Conversely, values below 30% indicate a weakening of the respective trend. In TRX’s case, the current Aroon values signal a somewhat positive momentum but not a dominant uptrend.
Read More: TRON (TRX) Price Prediction 2024/2025/2030
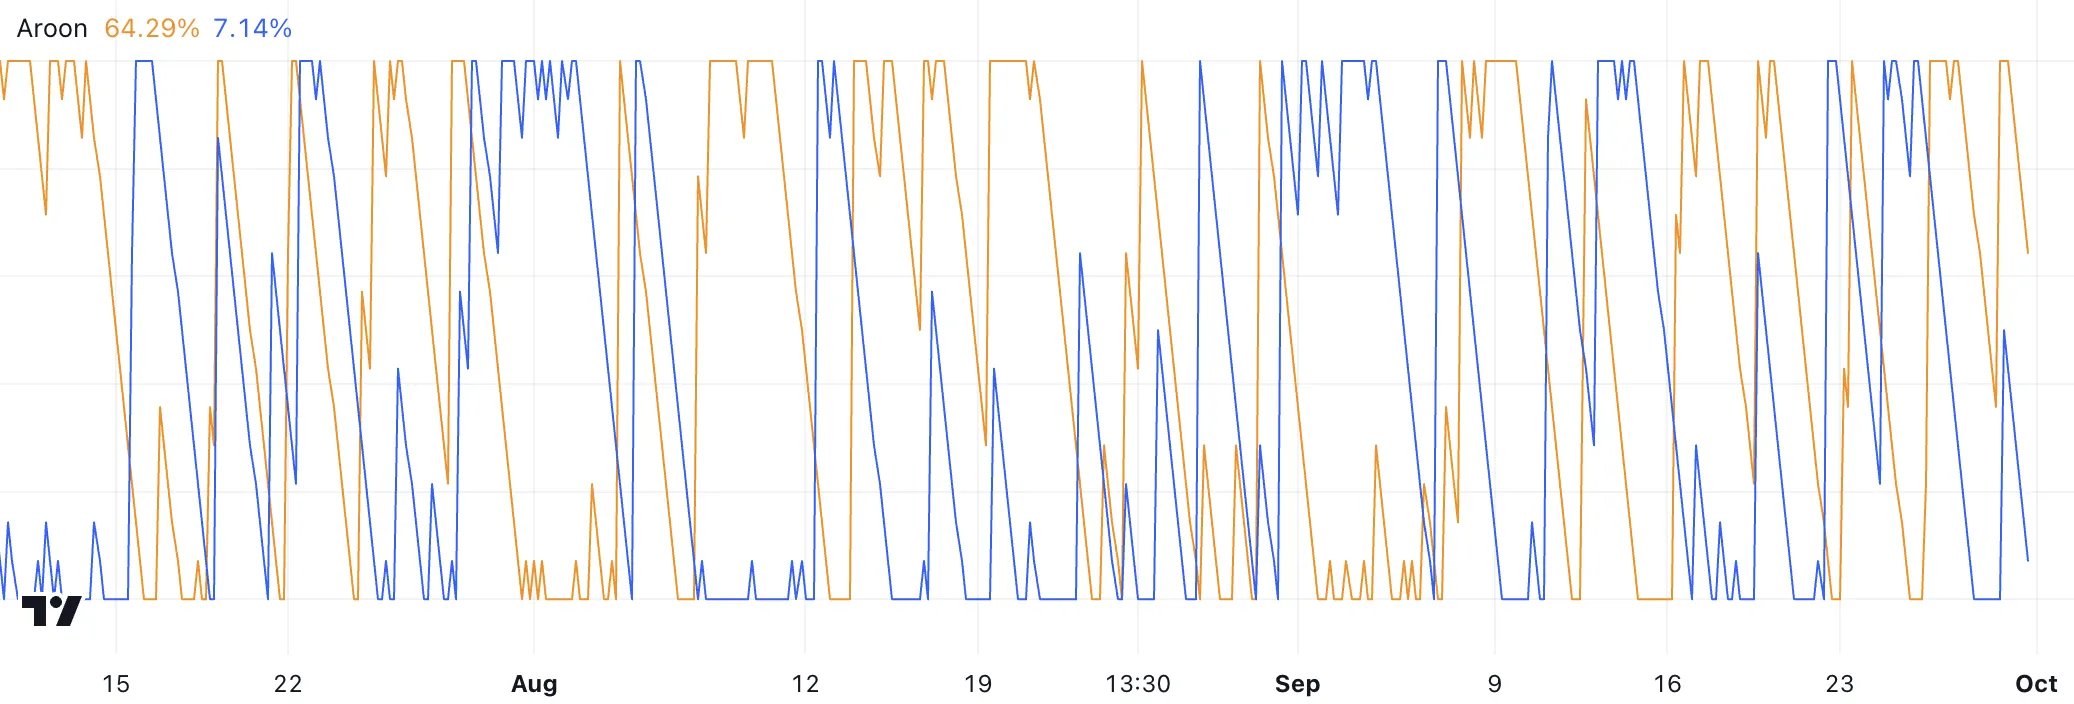
Moreover, the Aroon’s frequent oscillation between high and low values reflects an inconsistent trend, where TRX has been switching between upward and downward movements without a clear direction.
This rapid shift between Aroon Up and Aroon Down highlights indecision in the market. Neither buyers nor sellers have maintained control for an extended period.
Tron RSI Is Close to the Overbought Stage
TRX’s current RSI is 61.45, indicating that while it is above the midpoint of 50, it is not yet in overbought territory, which typically starts at 70.
The Relative Strength Index (RSI) is a momentum oscillator that measures the speed and change of price movements. It ranges from 0 to 100 and helps traders identify overbought or oversold conditions in an asset. When the RSI climbs above 70, it signals that the asset may be overbought. This often leads to a potential price pullback or correction.
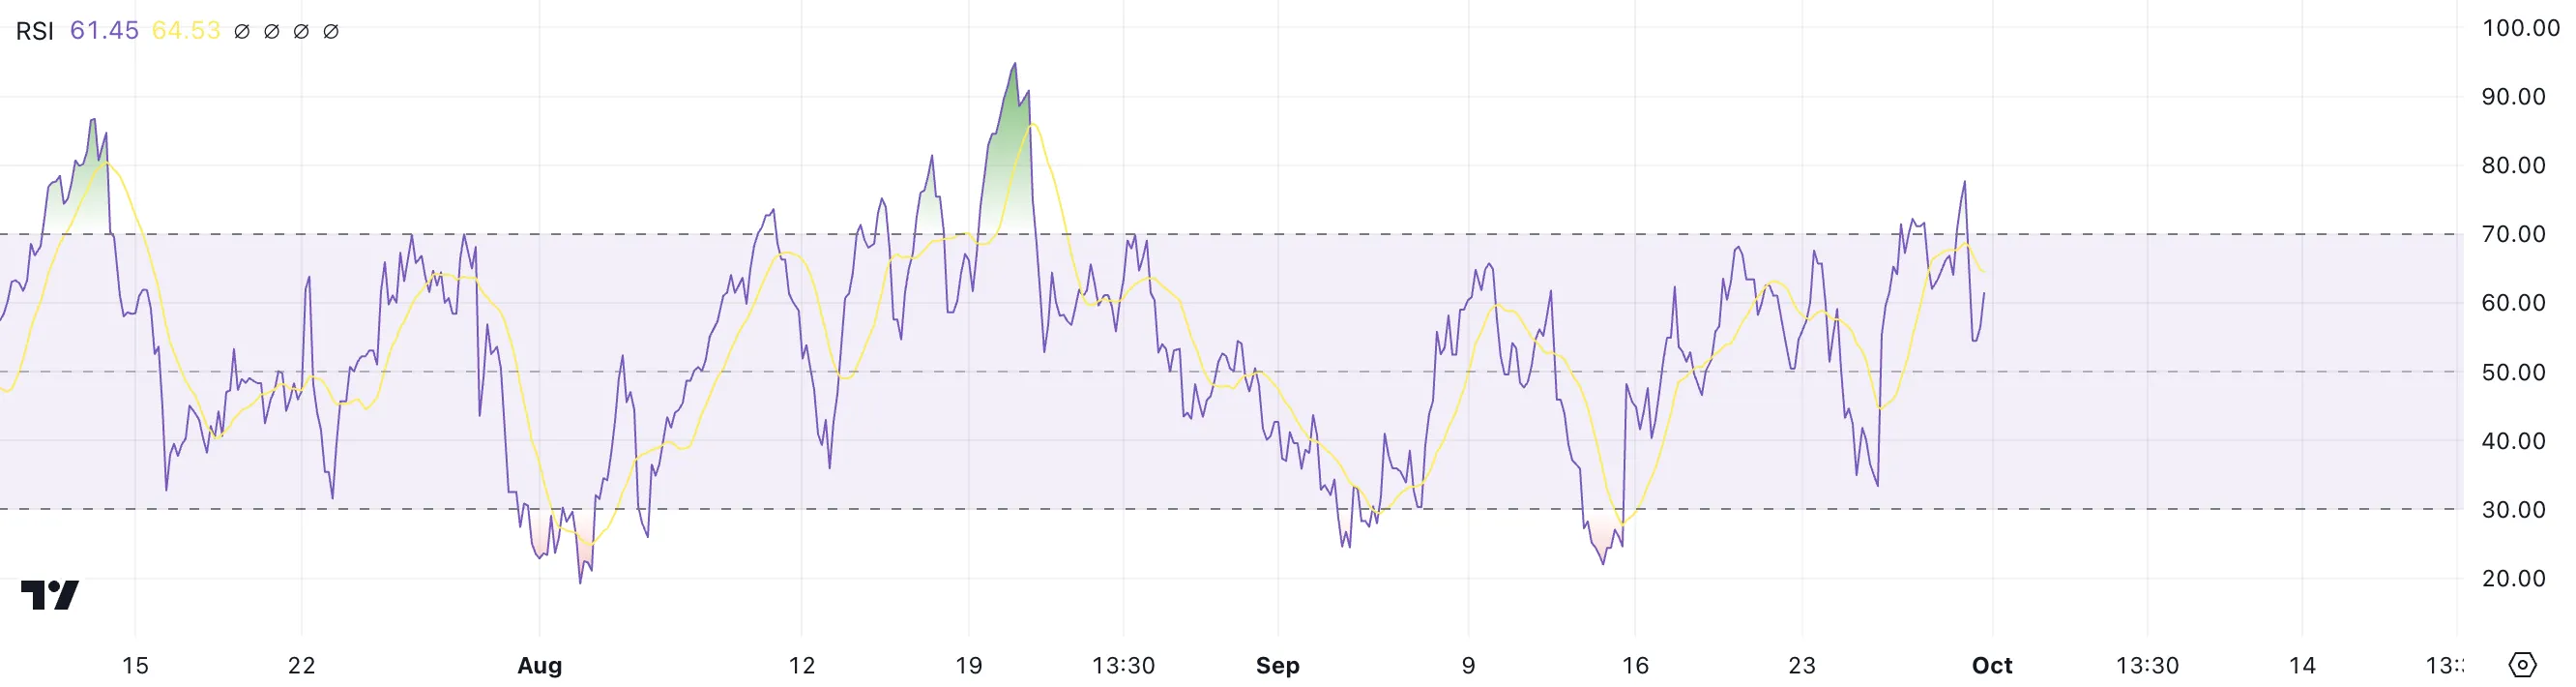
While TRX’s RSI is not yet in the overbought range, the sideways movement in price suggests indecision in the market. If the RSI continues to rise and hits the overbought threshold, it could trigger a correction.
This scenario makes it crucial to monitor TRX closely for any signs of upward pressure pushing the RSI toward 70, as such a move could spark a near-term price drop.
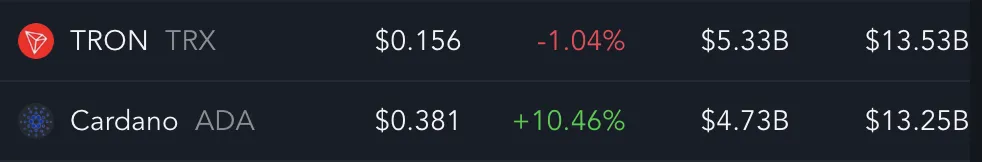
TRX Price Prediction: Could Cardano Surpass Tron?
The market cap difference between Cardano (ADA) and Tron (TRX) stands at $280 million, with TRX showing signs of losing momentum after the initial excitement brought on by SunPump. Although the EMAs for TRX still signal a bullish sentiment, the narrow gap between them reveals that the strength of this uptrend may not be as strong as it initially appeared.
EMA lines, or Exponential Moving Averages, are key tools in technical analysis. They are designed to smooth price fluctuations and assign greater importance to more recent price action. When shorter-term EMAs remain above longer-term ones, it typically suggests that the asset is in a bullish trend, reflecting sustained upward momentum.
However, when the distance between these lines is minimal, as is the case with TRX, the strength of the trend is called into question. That signals that it may not be powerful enough to sustain further significant upward moves.
Should the uptrend continue, TRX could push toward the next resistance levels at $0.1617 and $0.17, representing a potential gain of approximately 10% from current levels. These price points are critical because breaking through them could attract more buying interest and validate the bullish outlook.
Read more: 7 Best Tron Wallets for Storing TRX
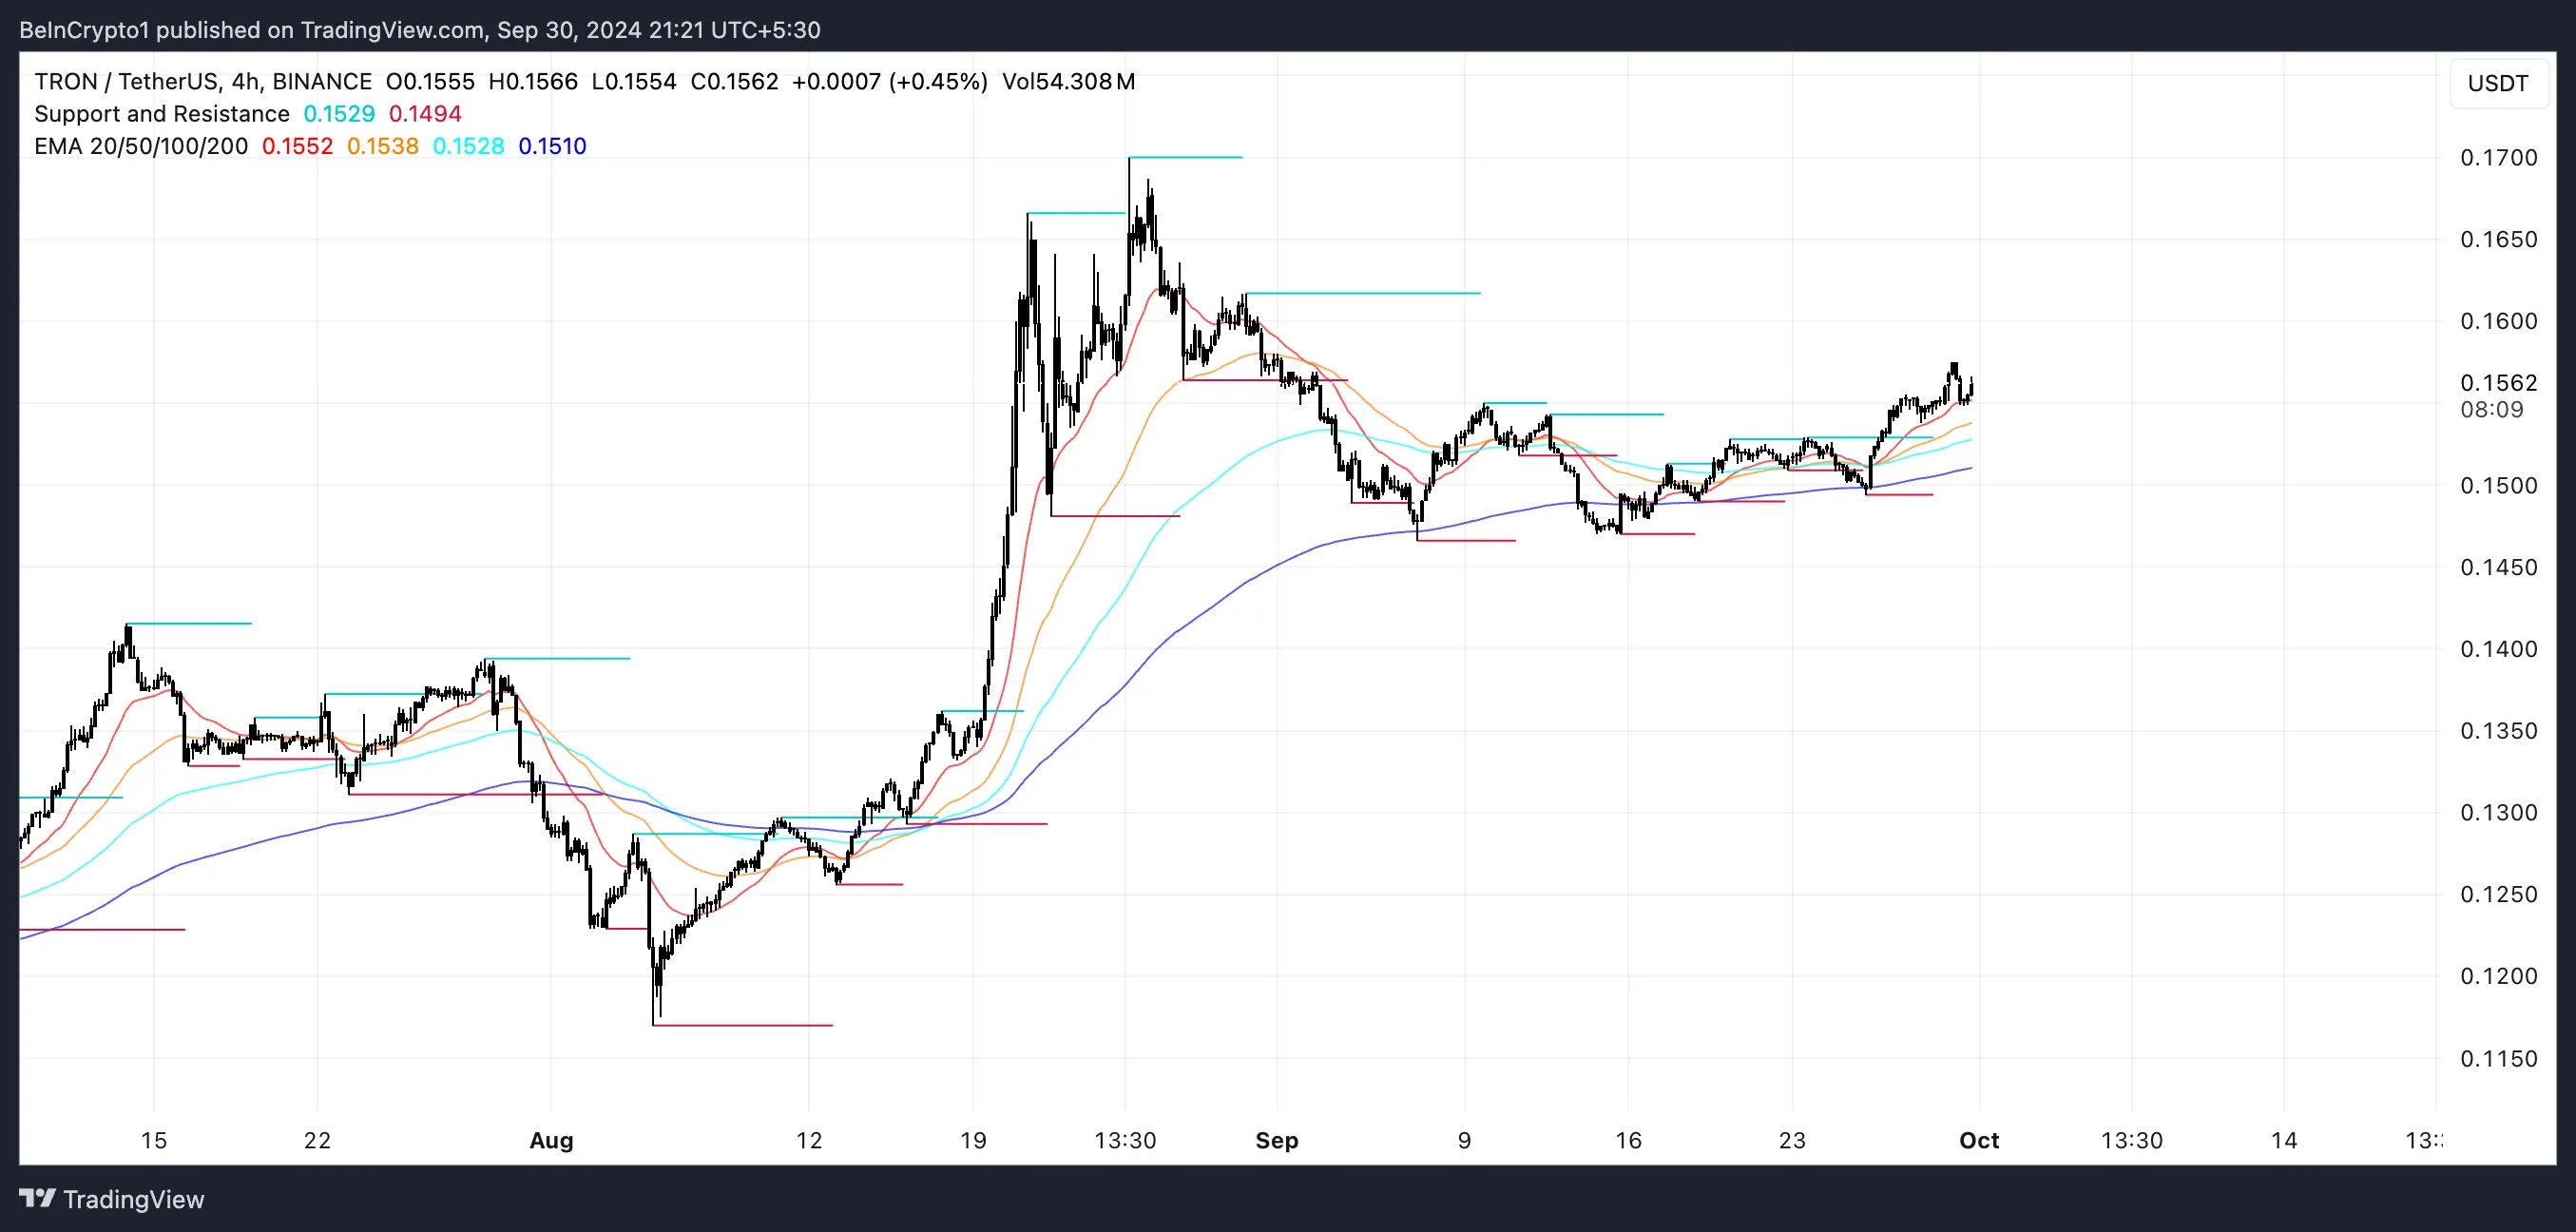
That can be triggered by news like Justin Sun announcing new features, such as a Tron-based NFT platform. However, the narrow EMA gap raises the risk that the trend may lose momentum, and if this happens, TRX might face a reversal. In such a case, the asset could experience a downturn, with potential support levels around $0.1295 and $0.1170.
A drop to these levels would be significant, as it would jeopardize TRX’s standing among the top 10 coins by market capitalization. In such a scenario, ADA could surpass TRX.
Disclaimer
In line with the Trust Project guidelines, this price analysis article is for informational purposes only and should not be considered financial or investment advice. BeInCrypto is committed to accurate, unbiased reporting, but market conditions are subject to change without notice. Always conduct your own research and consult with a professional before making any financial decisions. Please note that our Terms and Conditions, Privacy Policy, and Disclaimers have been updated.


Solana (SOL) is attempting to recover from an almost 12% correction over the past seven days. The RSI has surged into overbought territory, suggesting strong bullish momentum. However, the BBTrend remains deeply negative—though it’s beginning to ease, hinting at potential stabilization.
Meanwhile, the EMA lines are setting up for a possible golden cross, signaling that a trend reversal could be forming if key resistance levels are broken. Still, with Ethereum overtaking Solana in DEX volume for the first time in six months and critical support levels not far below, SOL remains in a delicate position.
SOL RSI Is Now At Overbought Levels
Solana’s Relative Strength Index (RSI) has surged to 72.91, up sharply from 38.43 just a day ago—indicating a rapid shift in momentum from neutral to strongly bullish territory.
The RSI is a widely used momentum oscillator that measures the speed and magnitude of price movements on a scale from 0 to 100.
Readings above 70 typically suggest an asset is overbought and may be due for a pullback, while levels below 30 indicate oversold conditions and potential for a rebound.
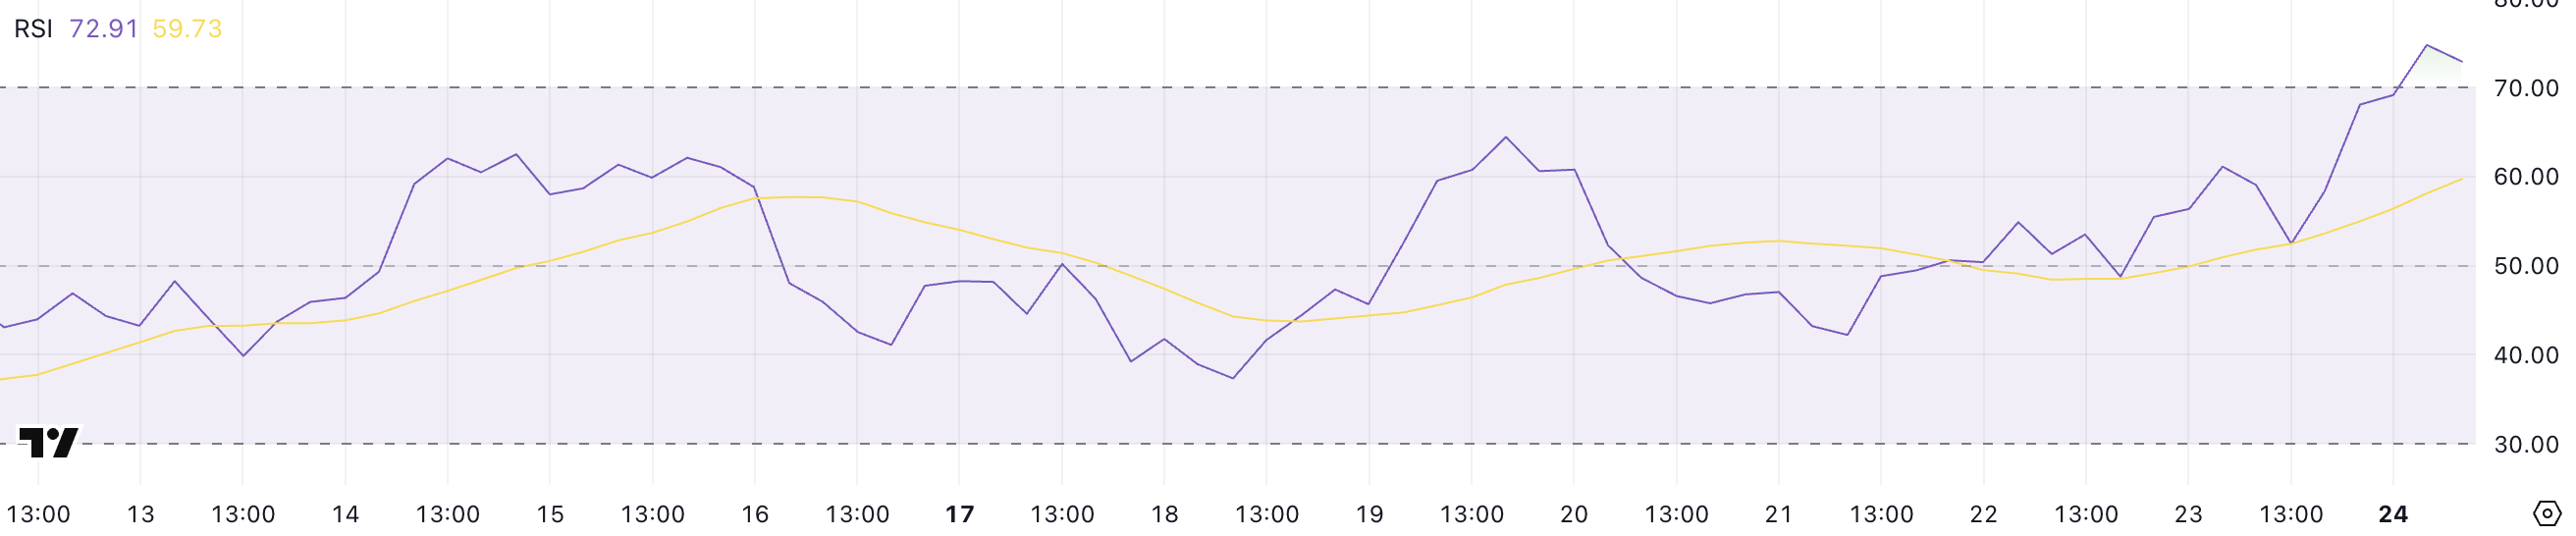
With Solana’s RSI now above 70, the asset has officially entered overbought territory, reflecting intense buying pressure in the short term.
While this can sometimes precede a correction or consolidation, it can also signal the start of a breakout rally.
Traders should watch closely for signs of continuation or exhaustion. If momentum holds, Solana could push higher, but any stalling may trigger profit-taking and short-term volatility.
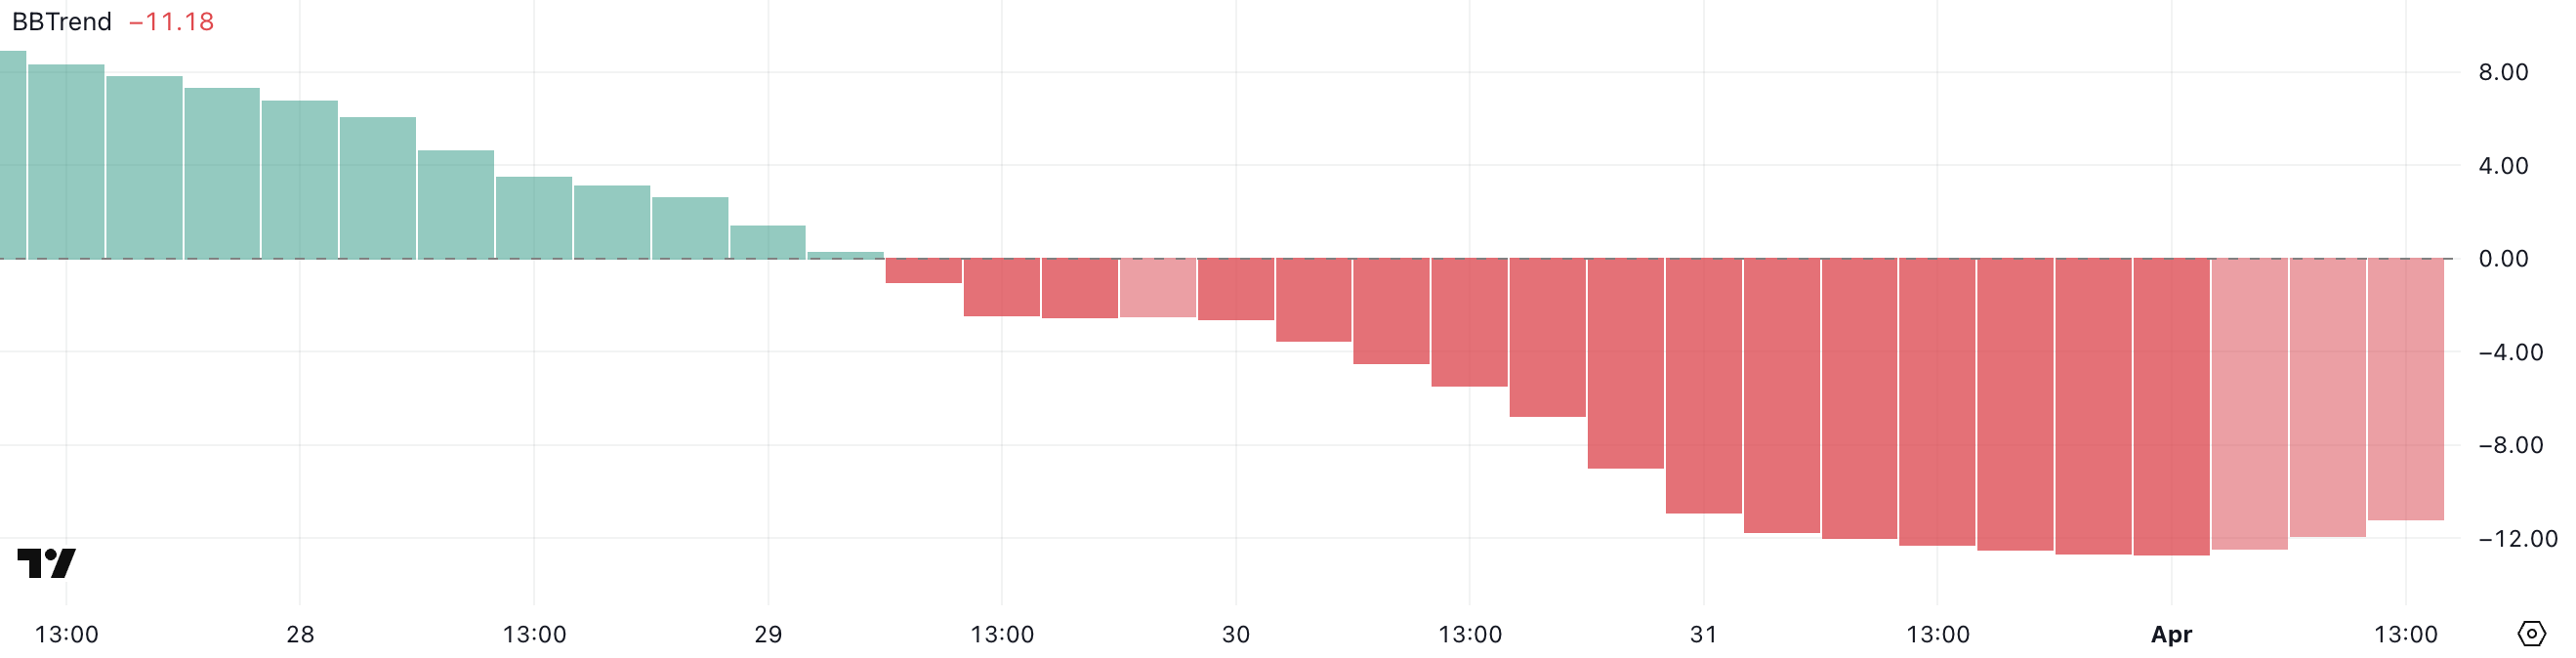
Solana BBTrend Is Decreasing, But Still Very Negative
Solana’s BBTrend indicator has climbed slightly to -11.18 after hitting a low of -12.68 earlier today. That suggests that the bearish momentum is starting to ease.
The BBTrend (Bollinger Band Trend) measures the strength and direction of a trend based on how price interacts with the Bollinger Bands.
Values below -10 typically indicate strong bearish pressure, while values above +10 reflect strong bullish momentum. A rising BBTrend from deep negative territory can be an early sign of a potential reversal or at least a slowdown in the downtrend.
With SOL’s BBTrend still in bearish territory but improving, the market may be attempting to stabilize after a period of intense selling.
However, broader ecosystem developments complicate the technical picture. For example, Ethereum recently surpassed Solana in DEX volume for the first time in six months.
While the easing BBTrend hints at recovery potential, Solana still needs a stronger confirmation to shift the trend fully in its favor. Until then, cautious optimism may be warranted, but the bears haven’t fully let go.
Solana Still Has Challenges Ahead
Solana’s EMA lines are showing signs of an impending golden cross. A golden cross occurs when a short-term moving average crosses above a long-term one. That’s often seen as a bullish signal that can mark the start of a sustained uptrend.
If this pattern is confirmed and buying momentum continues, Solana price could push up to test the resistance at $131.
A successful breakout above that level may open the door to further gains toward $136, and potentially even $147.
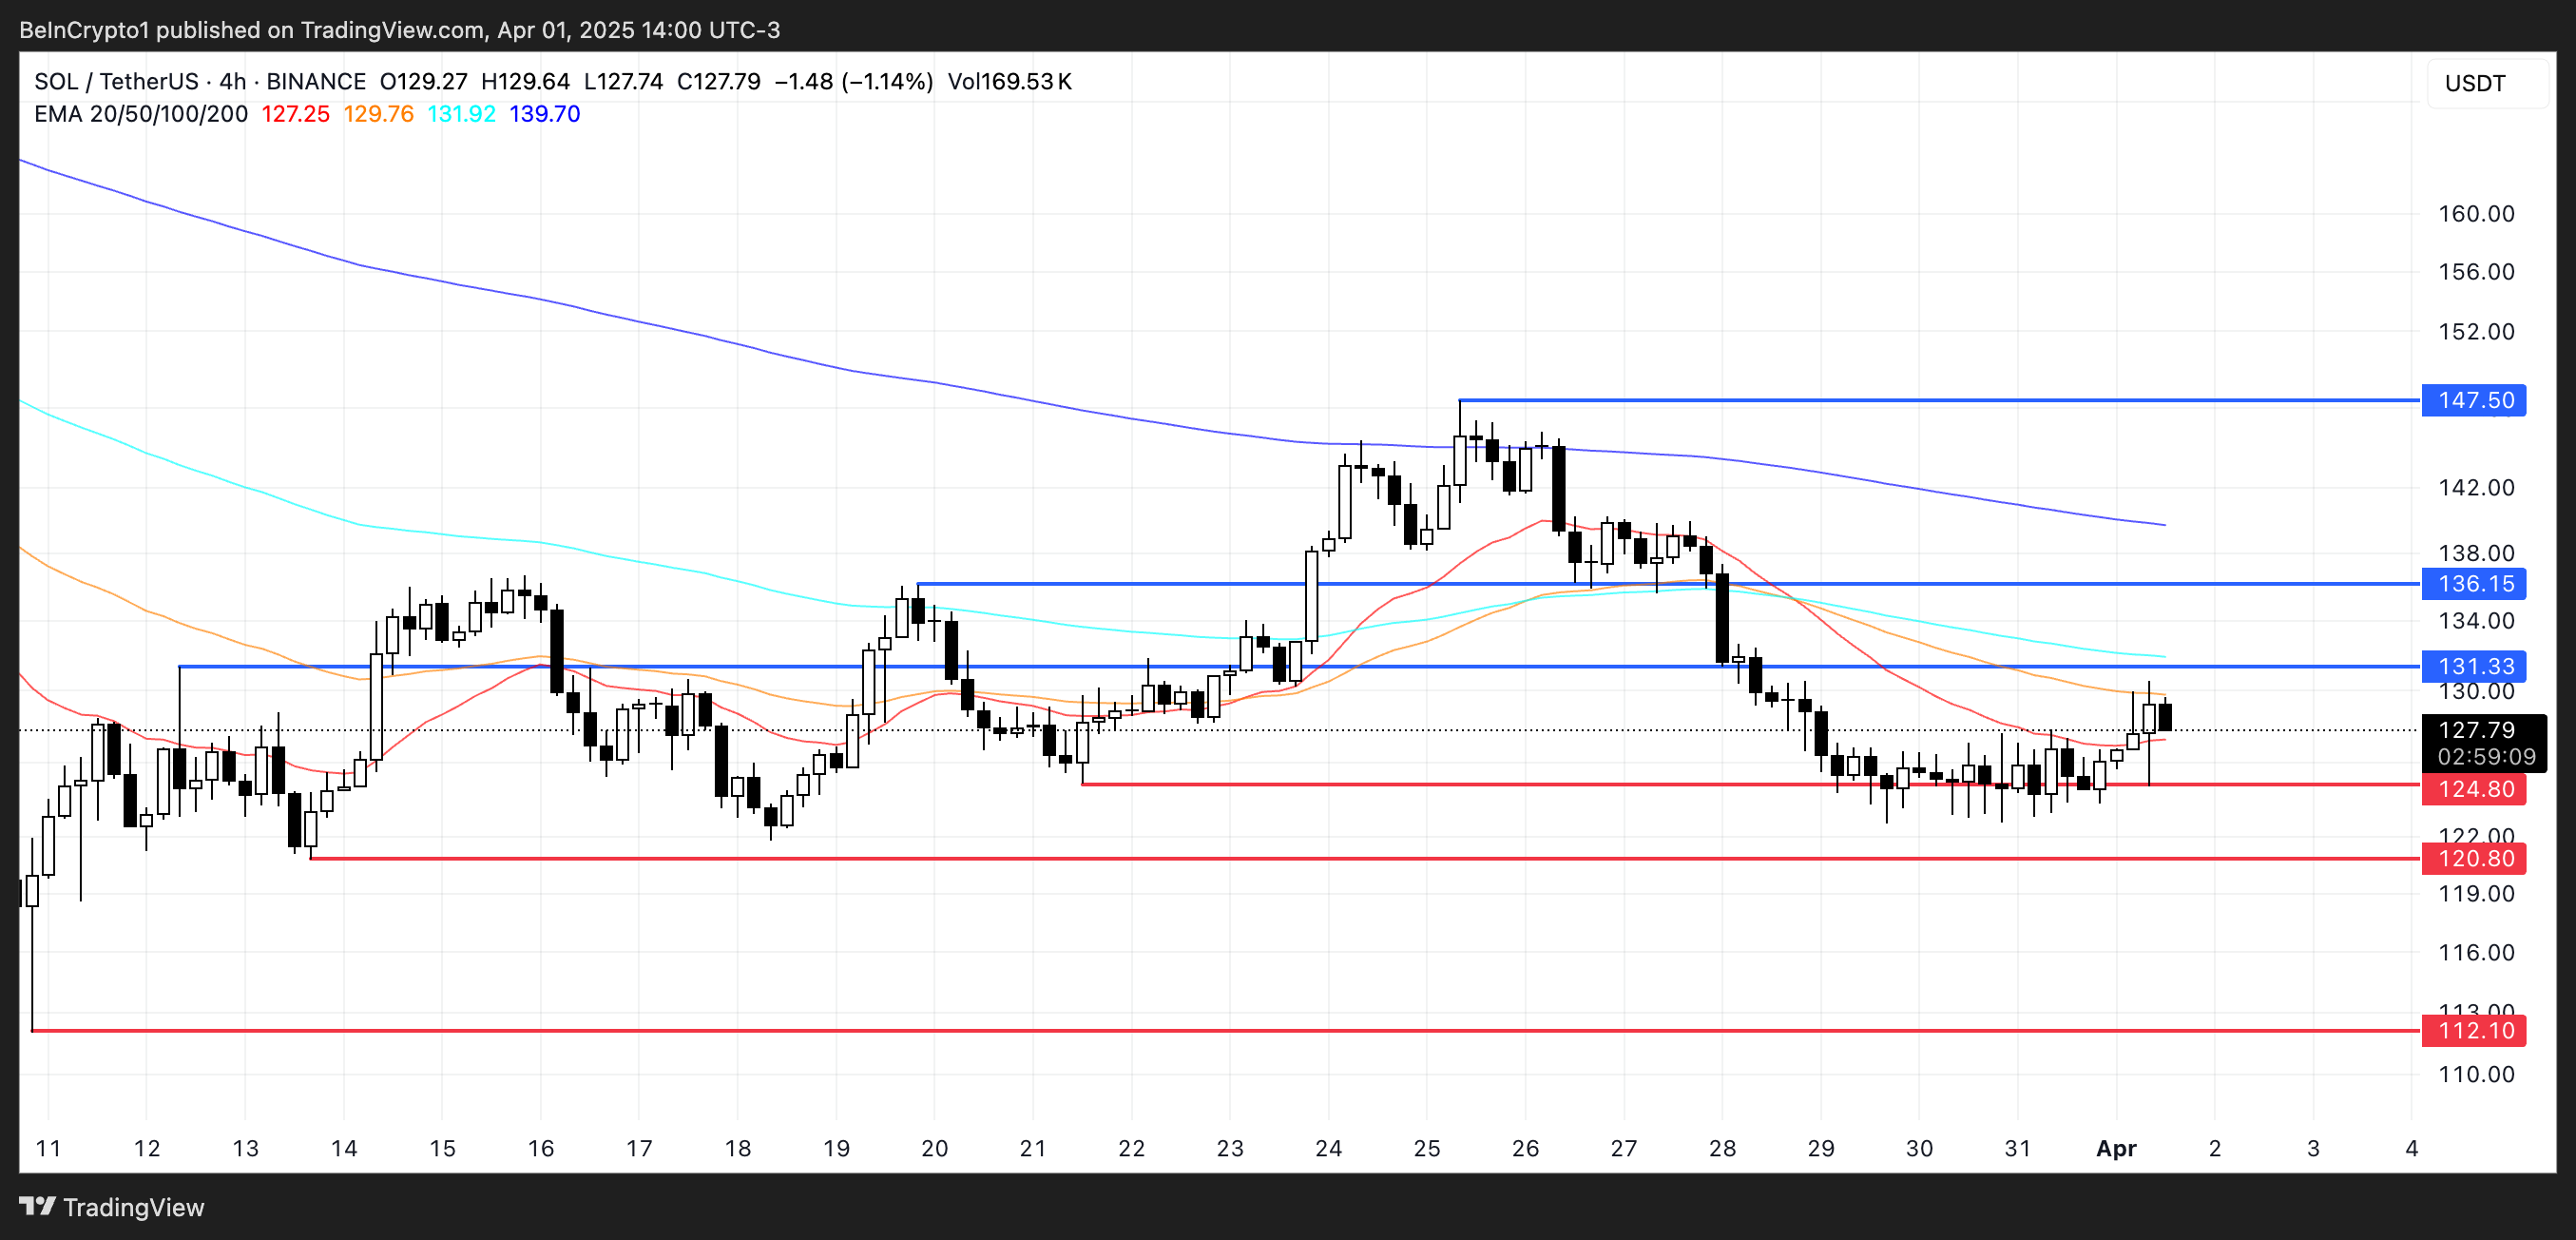
However, downside risks remain if buyers fail to hold recent gains.
If SOL pulls back and loses the key support at $124, it could trigger further selling pressure, pushing the price down to $120.
Should the downtrend gain strength from there, SOL might revisit deeper support levels around $112.
Disclaimer
In line with the Trust Project guidelines, this price analysis article is for informational purposes only and should not be considered financial or investment advice. BeInCrypto is committed to accurate, unbiased reporting, but market conditions are subject to change without notice. Always conduct your own research and consult with a professional before making any financial decisions. Please note that our Terms and Conditions, Privacy Policy, and Disclaimers have been updated.


Representative French Hill, who Chairs the House Committee on Financial Services, rejected requests to approve interest-bearing stablecoins. Coinbase CEO Brian Armstrong made a public appeal in support of this yesterday.
Hill has been a vocal supporter of new stablecoin regulations, and the crypto industry counted his Committee appointment as a victory.
French Hill Rejects Interest-Bearing Stablecoins
If there’s one topic that’s a top priority for US crypto policy, it’d be stablecoin regulations. Significant momentum is building behind pro-industry regulations, and President Trump claimed that stablecoins will play a role in dollar dominance. However, Representative French Hill pushed back on one request, saying he opposes interest-bearing stablecoins:
“I hear the point of view, but I don’t think that there’s consensus among the parties or the Houses [of Congress] on having a dollar-backed payment stablecoin pay interest to the holder of that stablecoin,” Hill told reporters earlier today.
Although Hill portrayed this position on stablecoins as a common-sense viewpoint, it represents a limit to the crypto industry’s political influence. When Hill was chosen to head the House Committee on Financial Services, crypto took it as a big win. Further, he’s been a visible presence in the fight for stablecoin regulation. So, what’s the problem?
Essentially, Coinbase CEO Brian Armstrong made an appeal to Hill and other legislators regarding interest-bearing stablecoins. Just yesterday, Armstrong called this policy a “win-win” and a huge opportunity to help consumers and the economy.
“US stablecoin legislation should allow consumers to earn interest on stablecoins. The government shouldn’t put it’s thumb on the scale to benefit one industry over another. Banks and crypto companies alike should both be allowed to, and incentivized to, share interest with consumers. This is consistent with a free market approach,” Armstrong claimed.
Since Armstrong made this public appeal yesterday, it’s remarkable that Hill rejected his vision of stablecoins so quickly. Ostensibly, Armstrong’s political influence has been on the rise, as he played a prominent role in Trump’s Crypto Summit, and the SEC dropped its suit against Coinbase.
It’s an important fact for the US crypto industry to learn: no matter how quickly its influence is growing, it’s still very new to most people. Earlier this year, a string of state-level Bitcoin Reserve proposals failed in Republican-controlled states. President Trump may support crypto, but his supporters have limits.
Disclaimer
In adherence to the Trust Project guidelines, BeInCrypto is committed to unbiased, transparent reporting. This news article aims to provide accurate, timely information. However, readers are advised to verify facts independently and consult with a professional before making any decisions based on this content. Please note that our Terms and Conditions, Privacy Policy, and Disclaimers have been updated.
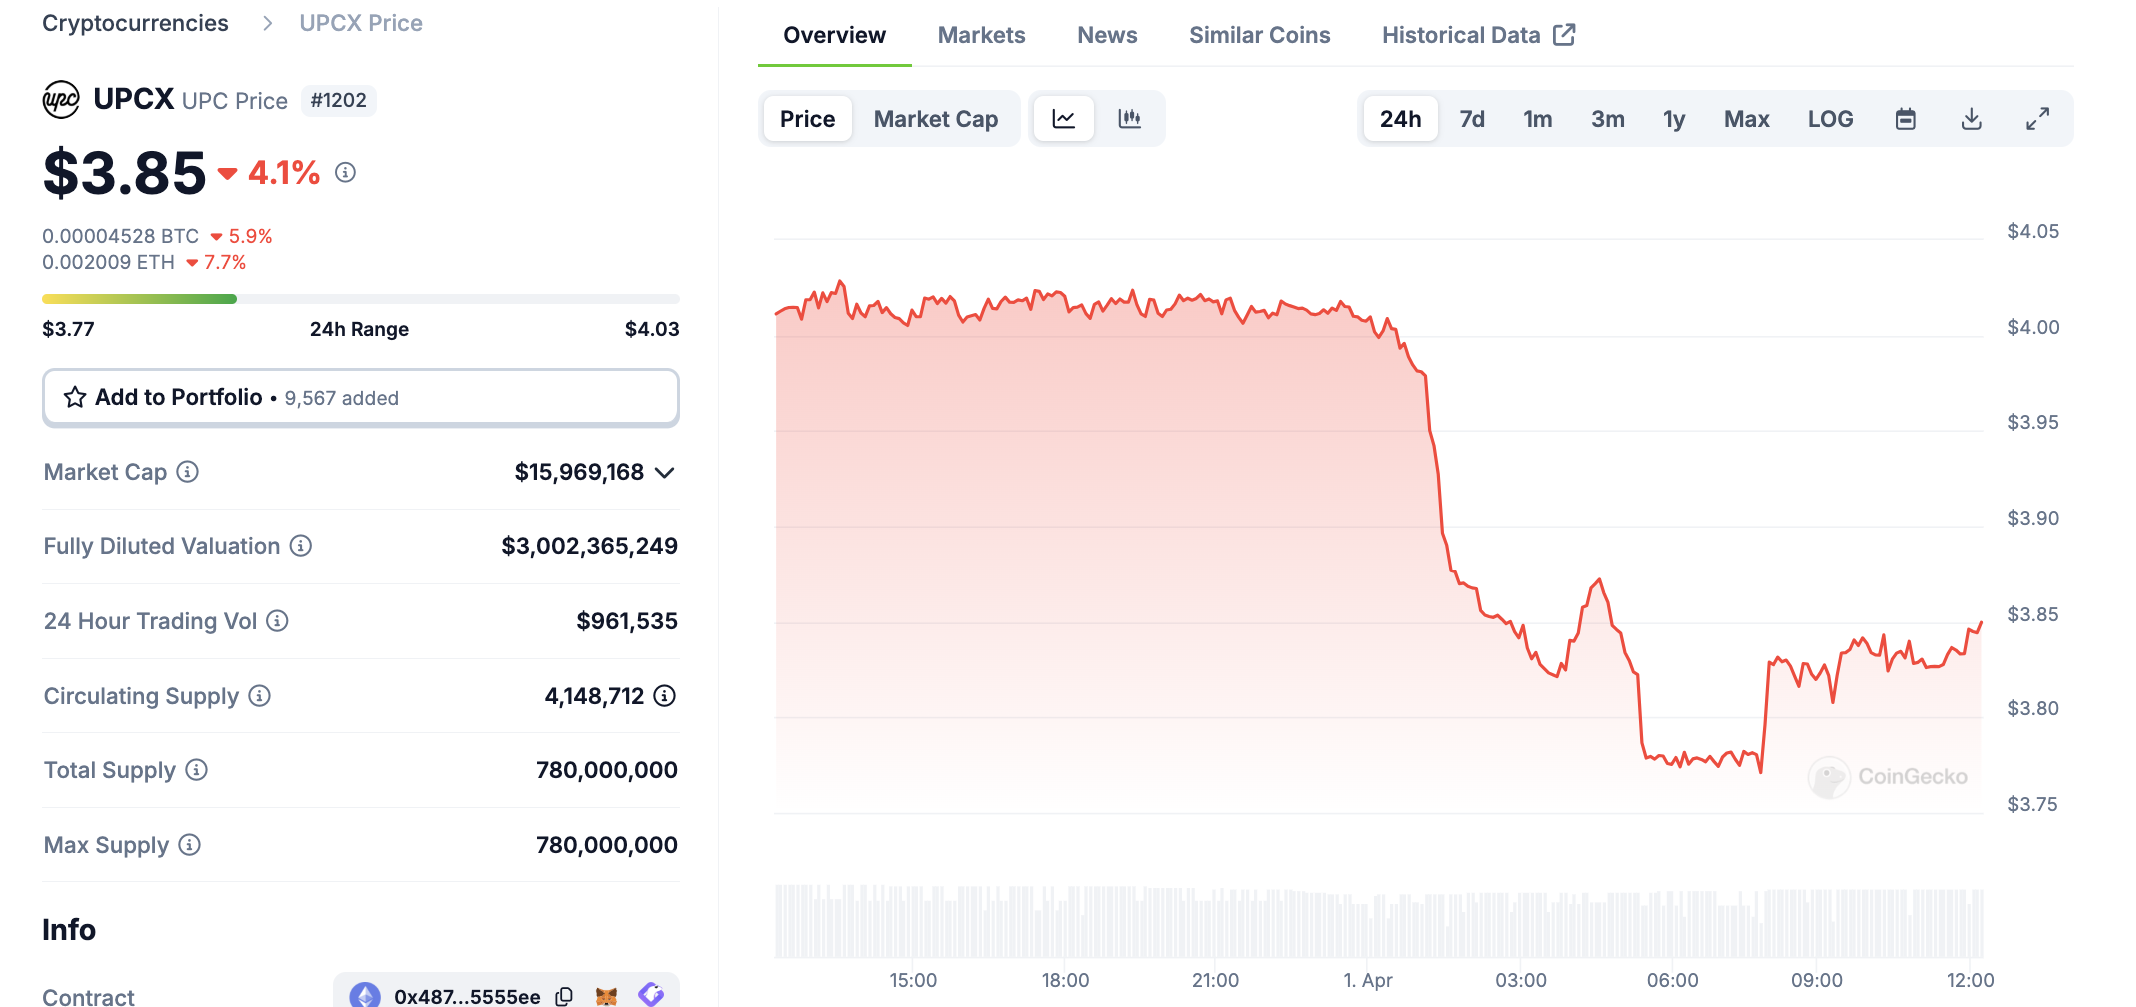
UPCX suffered a major hack today, with 18.4 million UPC tokens stolen from its management accounts. This amounts to about $70 million dollars, and the price of UPC fell drastically.
The hackers stole more UPC than is currently circulating in the markets and haven’t offloaded any assets yet. It is unclear who did this or how they will be able to secure their gains in other assets.
UPCX Suffers Major Hack
Cyvers, a crypto security firm that has tracked and uncovered several major crimes, identified a serious hack this morning. Multiple suspicious transactions took place involving UPCX’s management account, and the firm acknowledged suspicious activity. UPCX didn’t go into great detail, only describing a few security measures, but Cyvers showed the extent of the hack:
“It appears that someone gained access to the address 0x4C….3583E, upgraded the ‘ProxyAdmin’ contract, and executed the ‘withdrawByAdmin’ function, resulting in the transfer of 18.4 million UPC (approximately $70 million) from three different management accounts,” Cyvers claimed via social media.
UPCX is an open-source crypto payment system, and this hack may represent a serious blow to the company. According to CoinGecko data, the hackers stole significantly more UPC tokens than are currently available, which is around 4 million. Naturally, this caused the price to drop significantly, in an immediate drop of over 4%:
Although a $70 million hack will certainly damage UPCX individually, it’s unclear if it will actually impact the broader market much. The largest hack in crypto history took place a little over a month ago, and the community is still assessing the fallout. Meanwhile, UPCX is comparatively tiny; less than 10,000 X users viewed its post admitting to the security breach.
Since the UPCX hack took place, the recipient account hasn’t moved any of its UPC tokens. Indeed, it may be difficult for the perpetrator to convert these assets into usable fiat in the first place. If the hackers stole nearly 5x the amount of UPC tokens in circulation, any attempt to liquidate them will crash UPC’s token price even further.
Ultimately, the UPCX hack is strange for several reasons. Despite a large dollar amount, it hasn’t attracted a huge amount of buzz or impacted the market outside UPC. Hopefully, further analysis will identify the perpetrators, and possibly freeze the assets. Otherwise, the threat of a future sale could hamper UPC’s recover for the foreseeable future.
Disclaimer
In adherence to the Trust Project guidelines, BeInCrypto is committed to unbiased, transparent reporting. This news article aims to provide accurate, timely information. However, readers are advised to verify facts independently and consult with a professional before making any decisions based on this content. Please note that our Terms and Conditions, Privacy Policy, and Disclaimers have been updated.

Solana Faces Resistance While ETH Sees DEX Volume Boost

Hill Rejects Interest-Bearing Stablecoins Despite Armstrong’s Wish

How Did UPCX Lose $70 Million in a UPC Hack?

Ethereum Struggles to Break Out as Bear Trend Fades

XRP Price to $27? Expert Predicts Exact Timeline for the Next Massive Surge

Binance Megadrop Launches KernelDAO

2.52 Million Altcoins Are Ruining Crypto’s Future

Animoca Brands Valuation Tanks 75% In Two Years, Here’s Why

Crypto exchange BingX hacked for $43 million

Are The Big Players Losing Interest?

Hong Kong’s Securities Association Tips Authorities On Crypto Self-Regulation

Coinbase cbBTC Set to go Live on Solana
2.52 Million Altcoins Are Ruining Crypto’s Future
Animoca Brands Valuation Tanks 75% In Two Years, Here’s Why
Crypto exchange BingX hacked for $43 million
Are The Big Players Losing Interest?
Hong Kong’s Securities Association Tips Authorities On Crypto Self-Regulation
Coinbase cbBTC Set to go Live on Solana
-
 Altcoin23 hours ago
Charles Hoskinson Reveals How Cardano Will Boost Bitcoin’s Adoption
-

 Market23 hours ago
Hedera (HBAR) Bears Dominate, HBAR Eyes Key $0.15 Level
-

 Market24 hours ago
Coinbase Tries to Resume Lawsuit Against the FDIC
-

 Market22 hours ago
This is Why PumpSwap Brings Pump.fun To the Next Level
-

 Market21 hours ago
Cardano (ADA) Whales Hit 2-Year Low as Key Support Retested
-

 Market14 hours ago
XRP Bulls Fight Back—Is a Major Move Coming?
-
 Market13 hours ago
Is CZ’s April Fool’s Joke a Crypto Reality or Just Fun?
-

 Market12 hours ago
Bitcoin Price Battles Key Hurdles—Is a Breakout Still Possible?