
Market
Altcoins to Watch in October 2024: 3 Underrated Gems

October is historically a bullish month for the crypto market. Because of this, investors might be on the lookout for hidden gem altcoins that could bring significant gains.
These lesser-known cryptocurrencies sometimes have strong fundamentals and increasing community support, which could make them worth monitoring. As such, this analysis uncovers three under-the-radar altcoins that show promising signs of a major pump in October.
Echelon Prime (PRIME)
PRIME, the native token of the decentralized finance and gaming web3 project, tops this list of altcoins. One reason for its inclusion is the assertion that gaming tokens could be one of the trending narratives next month and throughout the rest of the year.
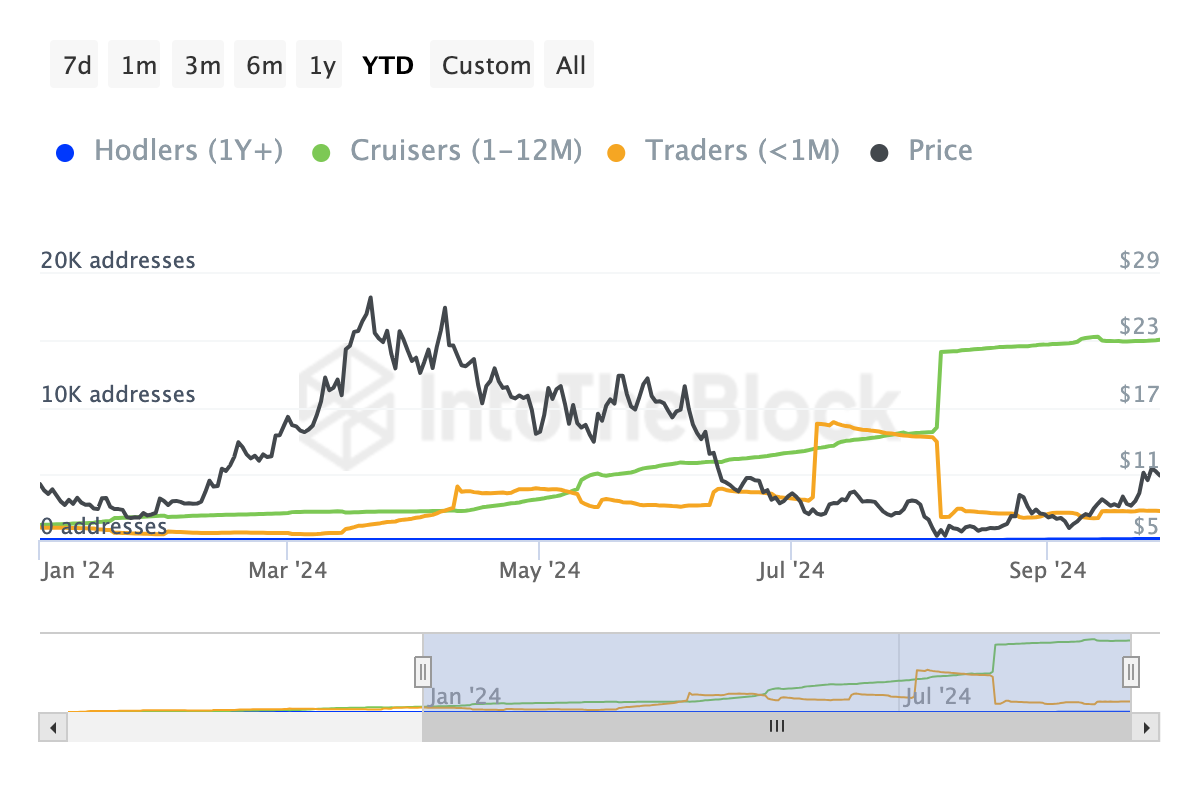
Built on the Ethereum blockchain, PRIME’s price has increased by 35.39% in the last 30 days, with the most gains coming from the recent token unlock.
Furthermore, a look at the addresses by time held shows that many investors who have owned the token within the last month through the last 365 days have refrained from selling it. Thus, this suggests a high conviction in its short to long-term potential and that PRIME might not undergo a major price correction.
On the daily chart, PRIME’s prime jumped above $12 on September 28. This surge could be attributed to the breakout from the descending triangle, which is due to the formation of lower highs and a horizontal support level.
PRIME’s price has decreased to $10.20. However, the Money Flow Index (MFI) reveals that substantial capital is still flowing into the altcoins. As a result, a major rebound could occur from its current price.
Read more: 5 Best Crypto Payment Gateways Every Business Should Know
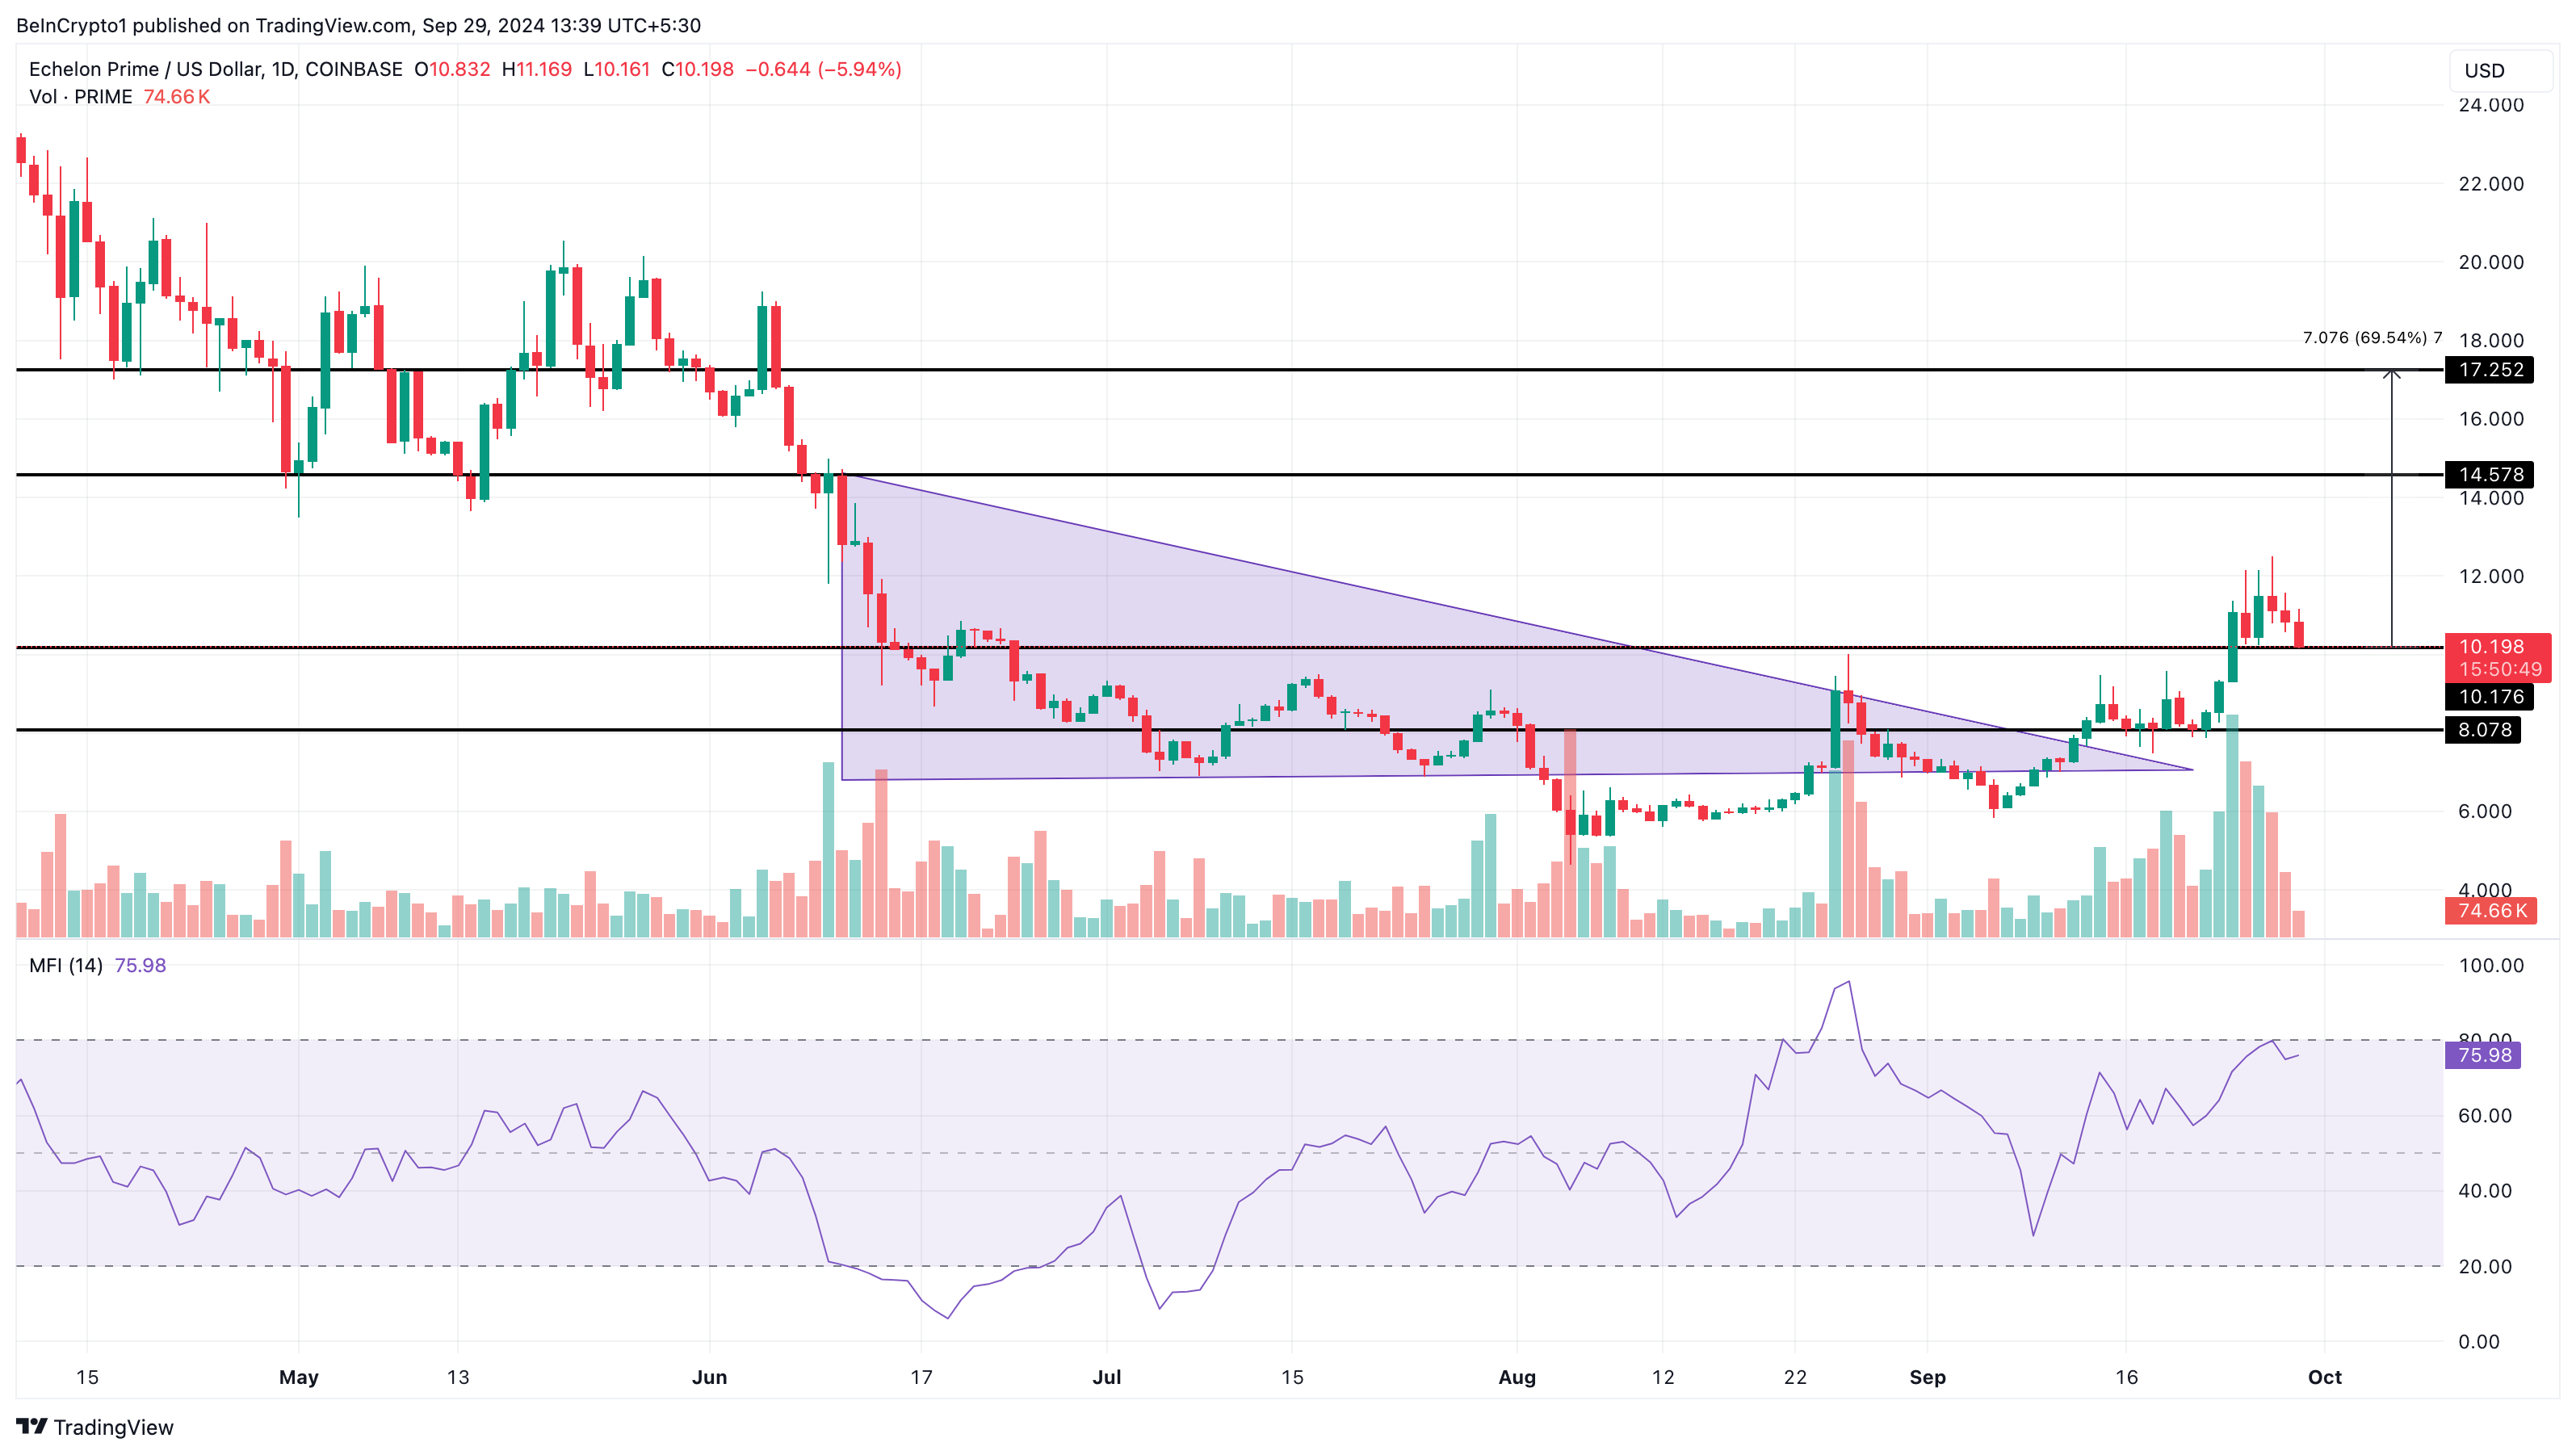
If that happens, PRIME’s value might surge by 70% in October, potentially reaching $17.25 before the month ends. On the other hand, the altcoin’s price might face a notable downturn if it drops below $10.17. In that scenario, the price could fall to $8.07.
Celo (CELO)
Celo is ranked the 159th most valuable crypto in terms of market capitalization. It is built on Ethereum and focuses on real-world stablecoin utility. On September 25, Ethereum co-founder Vitalik Buterin applauded Celo for surpassing Tron in terms of stablecoin activity.
This development implied improved user engagement on the Ethereum layer-2 project. Apart from that, digital asset management firm Grayscale added CELO to the list of altcoins, which it expects to perform well during this year’s last quarter.
Based on the daily chart, CELO’s price climbed over 50% in less than two weeks after the formation of an inverse head and shoulder pattern. This technical pattern is a bearish-to-bullish reversal, which usually brings about a staggering price increase.
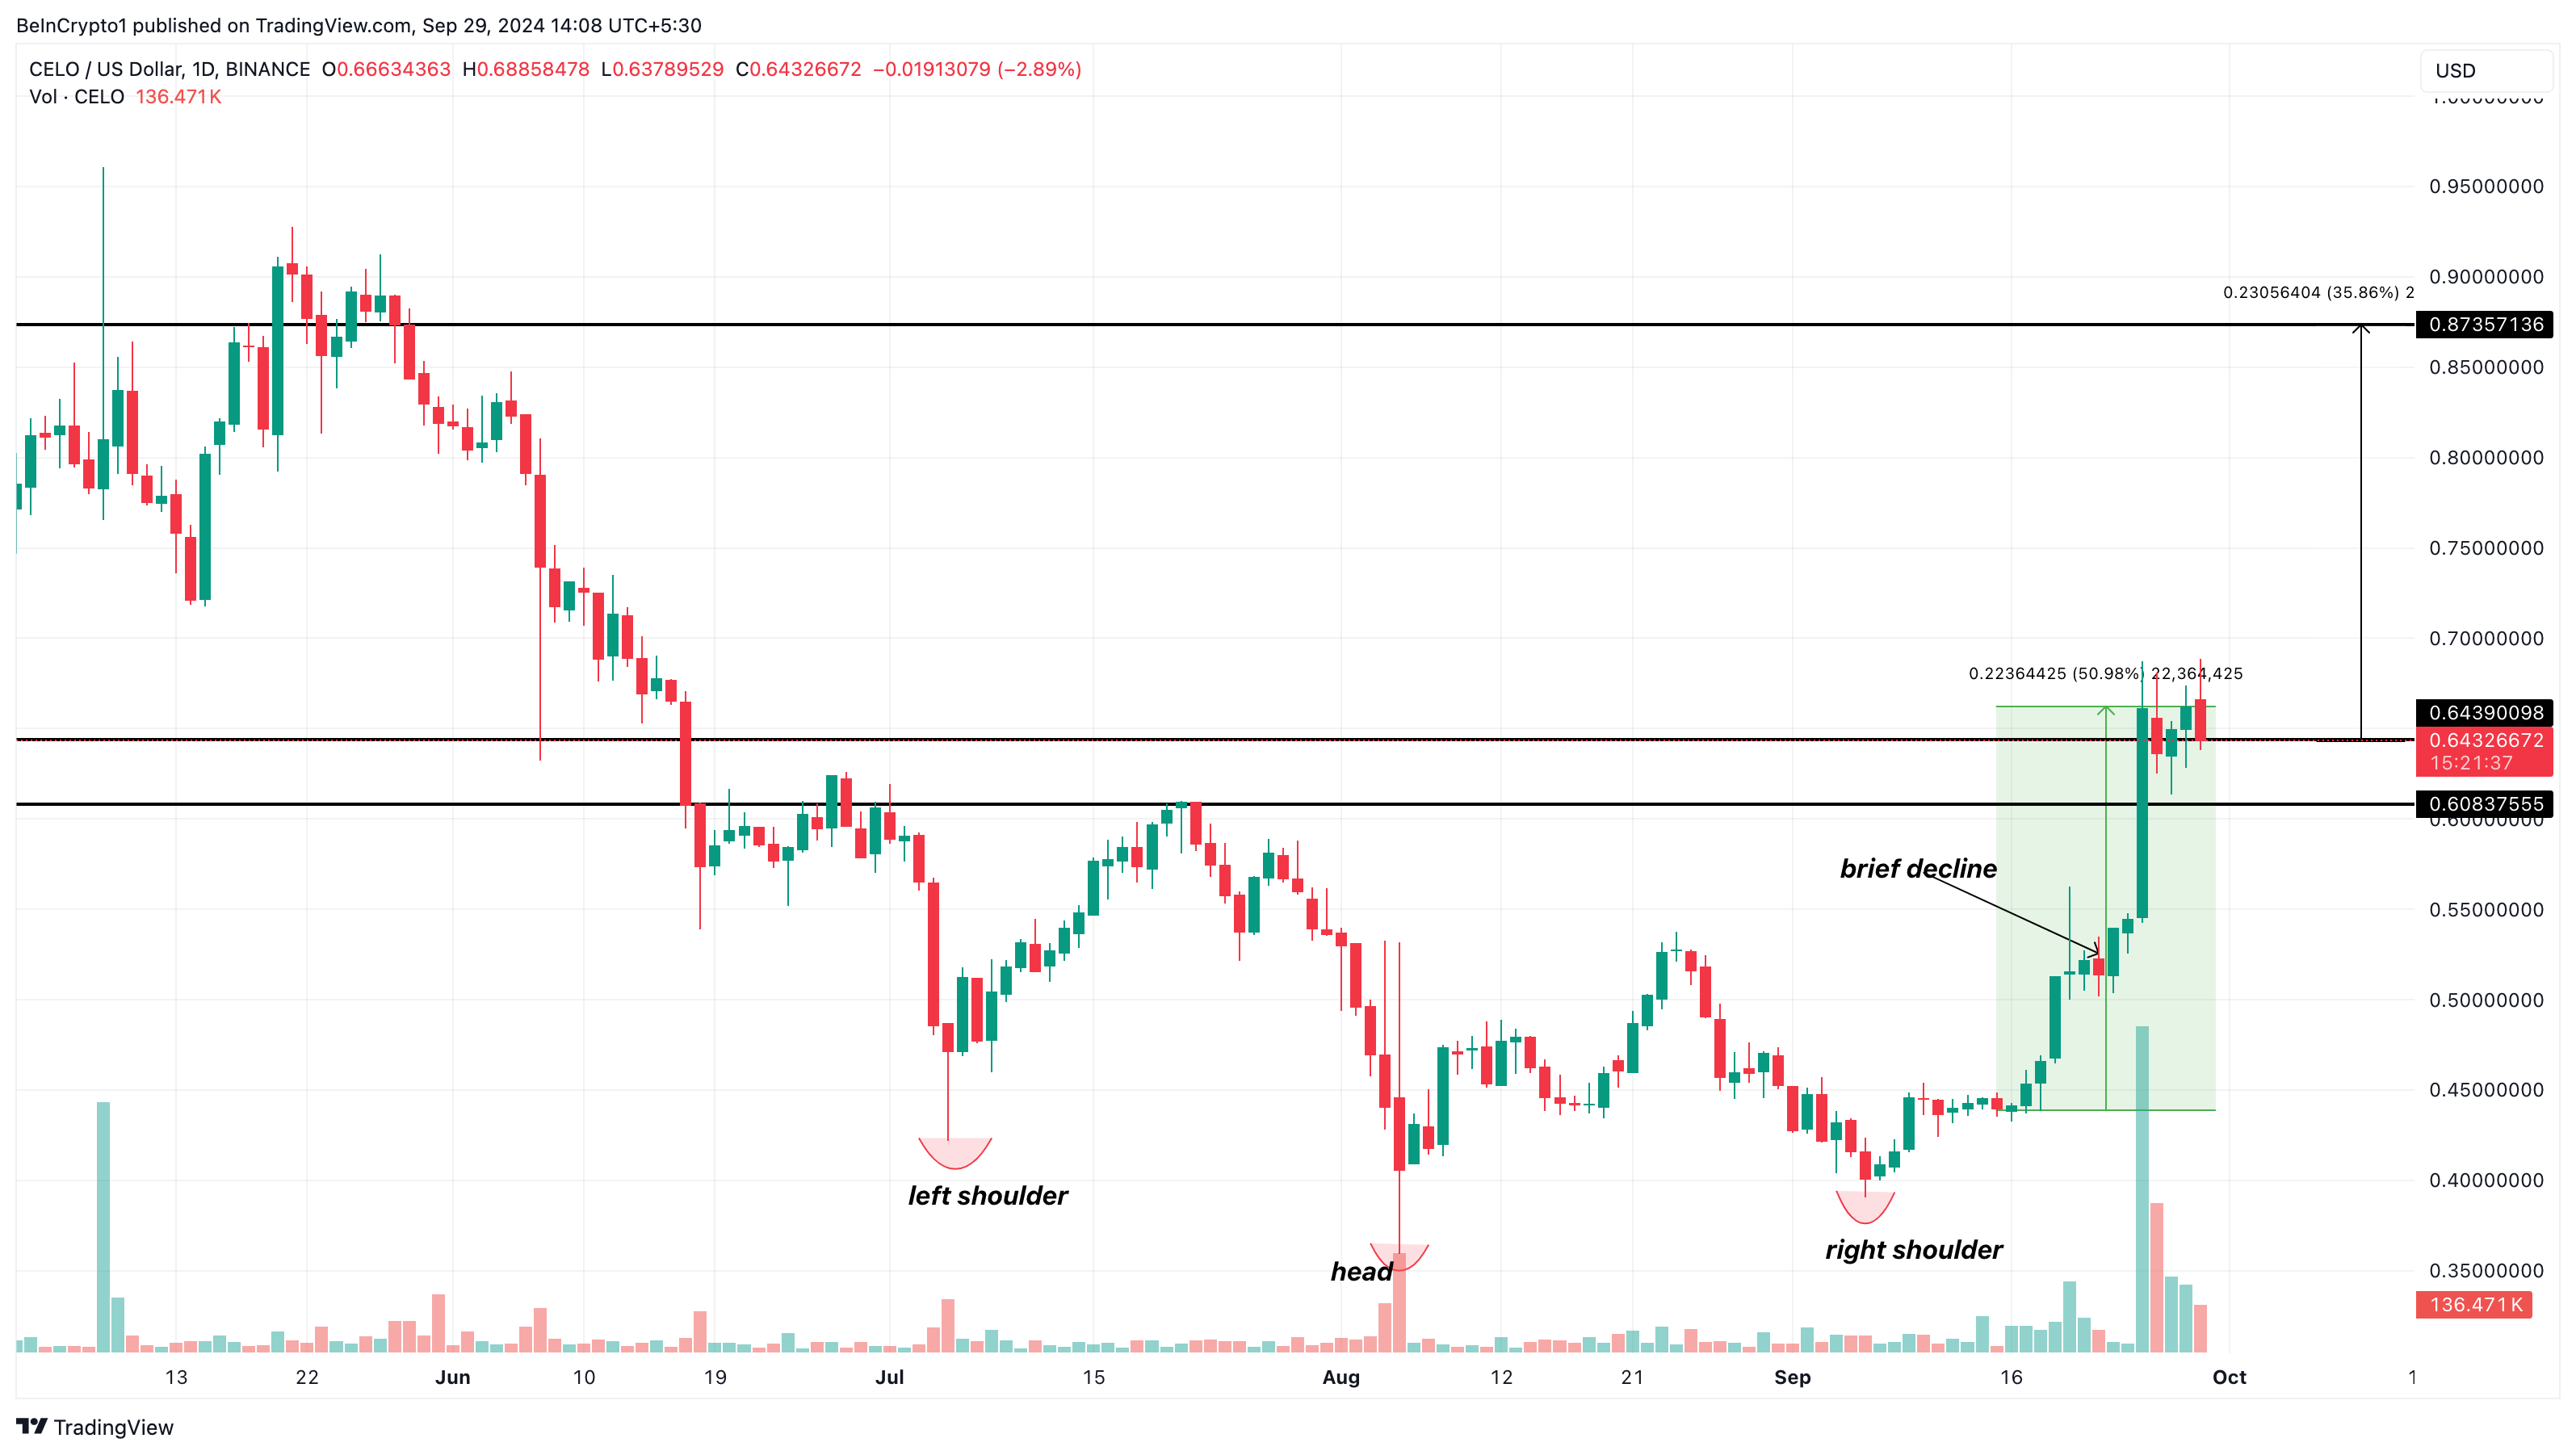
As of this writing, CELO’s price is 0.64. However, as it happened during the uptrend, this decline could be a brief drawdown, and a rebound might likely be likely in the coming days.
Once validated, CELO might increase by nearly 36% and hit $0.87 in October. However, if CELO’s price slips below $0.60, it might end the month in a net negative.
Aethir (ATH)
As a Decentralized Physical Infrastructure Network (DePIN) project, Aethir (ATH) enhances the distribution of AI chips. With its structure, the ATH is also a gaming token, reinforcing the notion that AI tokens, as well as gaming altcoins, could perform well in October.
Interestingly, ex-BitMEX CEO Arthur Hayes appears to share a similar value, especially after he dumped other altcoins for the token. Based on the daily chart, the 20-day Exponential Moving Average (EMA) — in blue has crossed over the 50 EMA (yellow) for the first time in a long while.
The EMA measures trend direction. When the longer EMA crosses above the shorter one, the trend is bearish. Therefore, the current situation (golden cross) with ATH trading at $0.065 means that the altcoin trend is bullish.
Read more: 10 Best Altcoin Exchanges In 2024
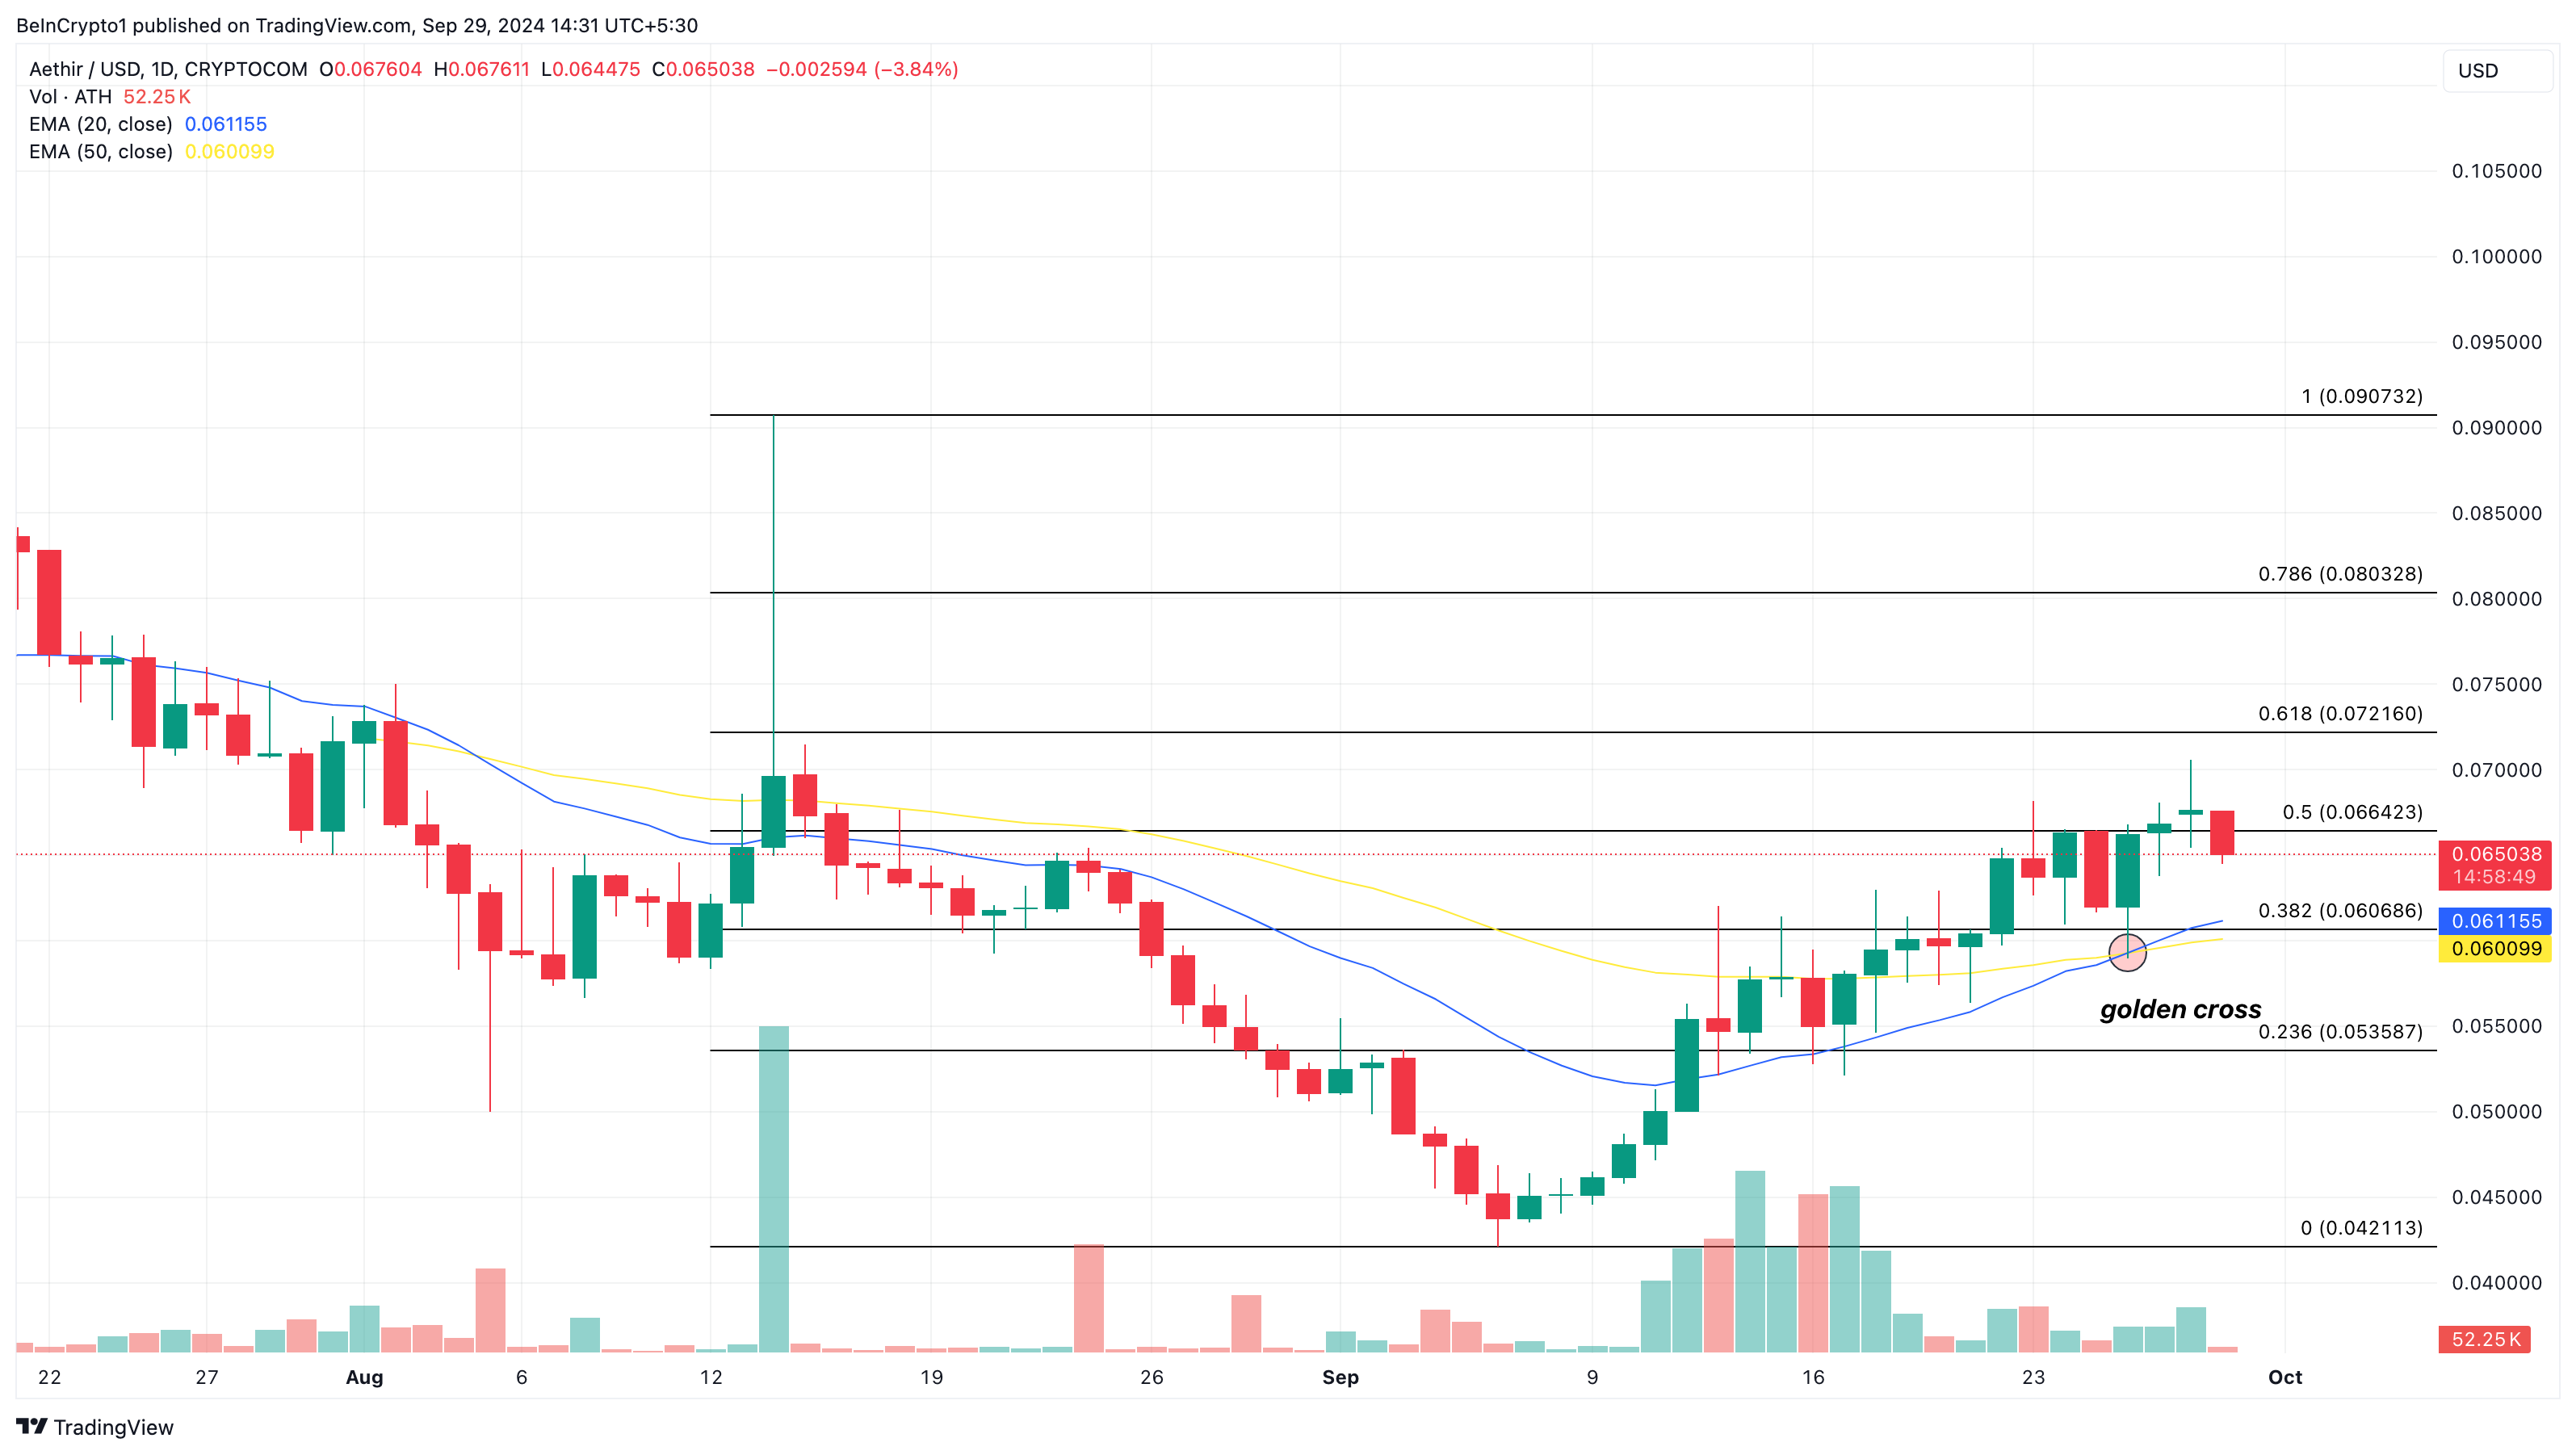
Despite a recent decline, the Golden Cross formation suggests that ATH’s price might return northward. If that happens, then ATH could rise toward $0.090 next month. On the flip side, Aethir’s price could decrease to $0.053 if the 50 EMA rises above the 20 EMA again, invalidating the bullish prediction.
Disclaimer
In line with the Trust Project guidelines, this price analysis article is for informational purposes only and should not be considered financial or investment advice. BeInCrypto is committed to accurate, unbiased reporting, but market conditions are subject to change without notice. Always conduct your own research and consult with a professional before making any financial decisions. Please note that our Terms and Conditions, Privacy Policy, and Disclaimers have been updated.


XRP gained only 2% in the past week, signaling weak momentum and fading interest from buyers in the short term.Technical indicators like the RSI, Ichimoku Cloud, and EMA lines are all starting to reflect increased bearish pressure. Here’s a breakdown of what the charts are saying and what could come next for XRP.
XRP RSI Shows Buyers Are Losing Control
XRP’s Relative Strength Index (RSI) has declined to 46.34, a noticeable drop from 57.30 just one day ago. This sharp move suggests a clear shift in momentum, with buying pressure cooling off significantly in the short term.
When the RSI drops this quickly, it can often indicate that traders are taking profits or beginning to rotate out of a position, especially after a period of modest gains.
While XRP hasn’t entered oversold territory yet, the drop below the 50 mark is typically viewed as a bearish signal, pointing to a potential shift in sentiment from bullish to neutral or bearish.
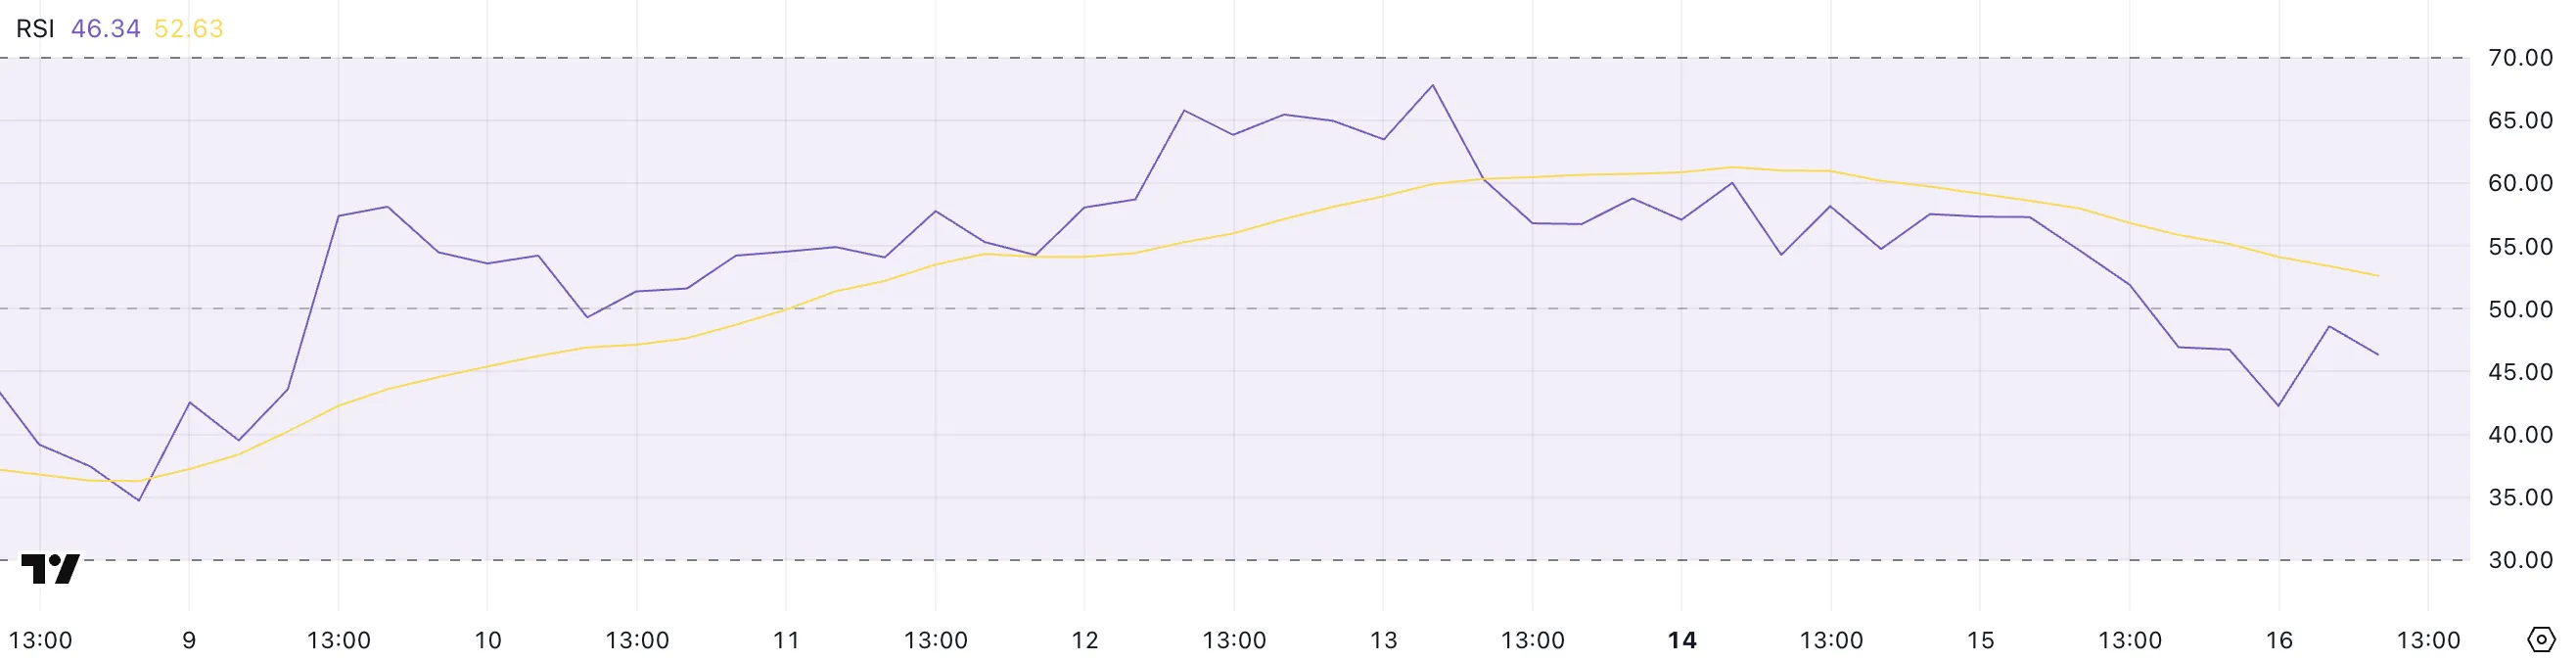
The RSI, or Relative Strength Index, is a widely used technical indicator that helps traders gauge the strength of a price trend. It ranges from 0 to 100, with readings above 70 considered overbought and readings below 30 considered oversold.
When the RSI is above 50, momentum is typically bullish, while levels below 50 reflect increasing bearishness. With XRP now sitting at 46.34, it suggests the asset is losing upward momentum and may be at risk of further downside unless buying interest returns soon.
If selling pressure continues and RSI trends lower, XRP could test key support levels in the near future.
XRP Ichimoku Cloud Shows Momentum Is Shifting
XRP’s Ichimoku Cloud chart currently shows a shift toward short-term bearish momentum.
The price has fallen below both the blue Tenkan-sen (conversion line) and the red Kijun-sen (baseline), which is typically viewed as a bearish signal.
When the price trades beneath these two lines, it often suggests weakening momentum and increasing downside risk unless a quick recovery follows.
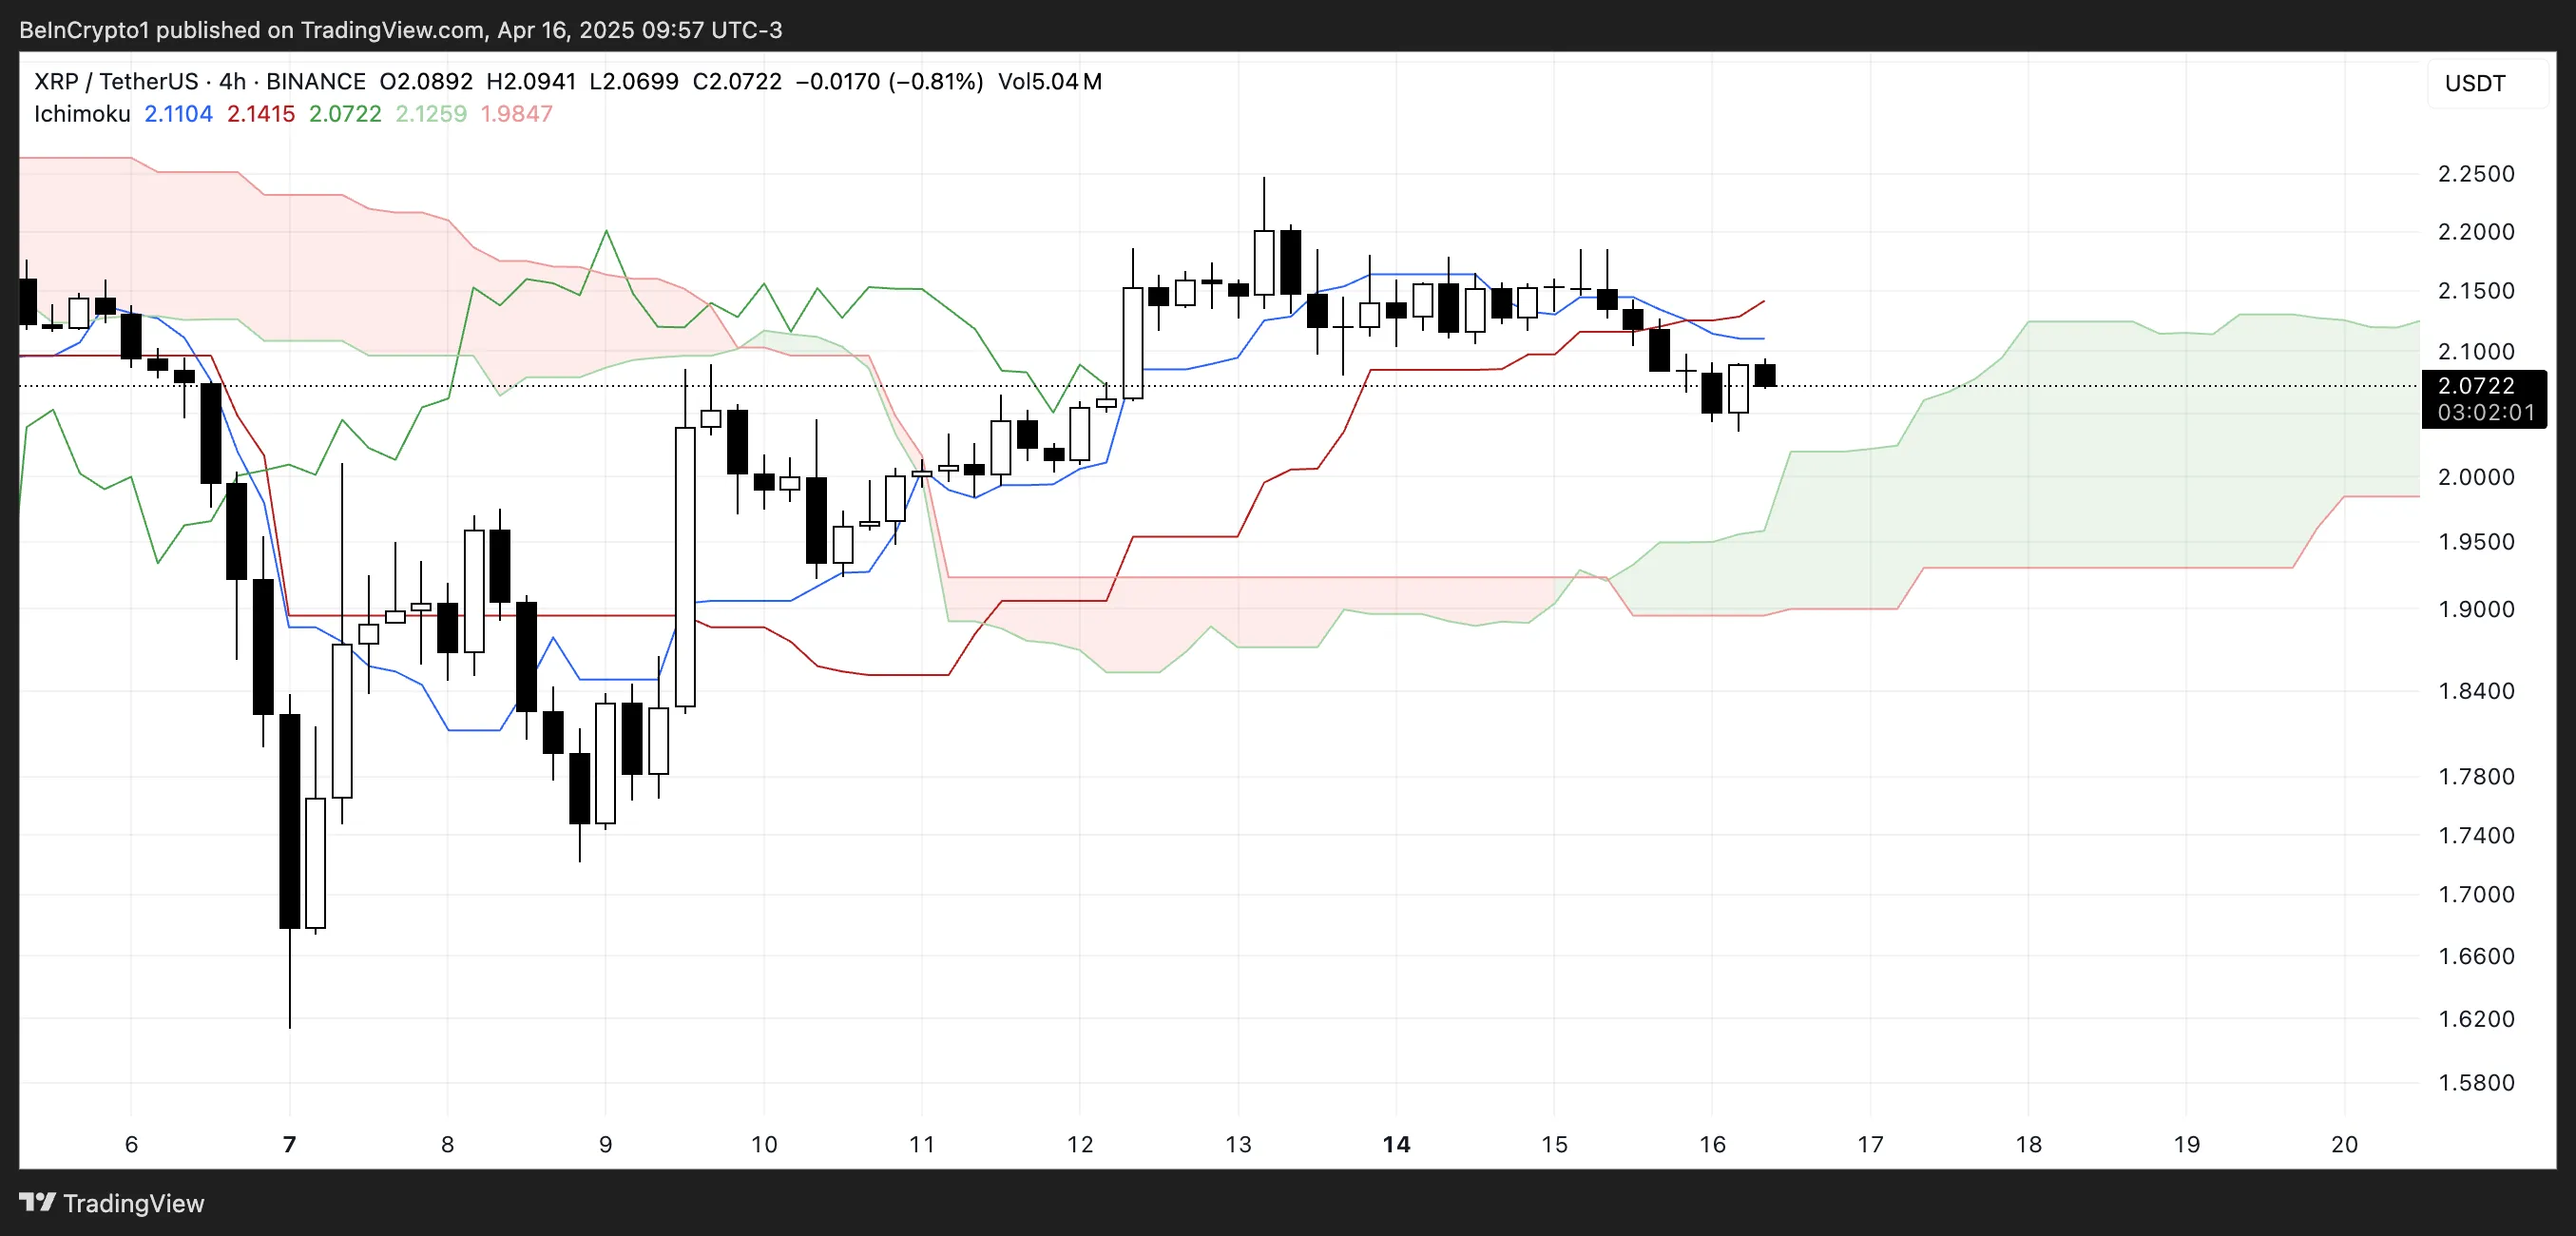
Additionally, the price is now entering the green cloud (Kumo), which represents a zone of uncertainty or consolidation. The cloud ahead is relatively flat and wide, indicating potential support but also a lack of strong upward momentum.
The green Senkou Span A (leading span A) remains above the red Senkou Span B (leading span B), signaling that the broader trend is still slightly bullish—but if price action stays inside or breaks below the cloud, that trend may begin to reverse.
Overall, the Ichimoku setup points to caution for bulls unless XRP reclaims the Tenkan and Kijun lines convincingly.
EMA Lines Suggest XRP Could Fall Below $2
XRP’s EMA lines are showing signs of weakness, with XRP price repeatedly failing to break through the resistance near $2.17—even amid speculation about a potential partnership with Swift.
This repeated rejection at the same level indicates strong selling pressure. The EMAs suggest momentum is fading as the shorter-term average is beginning to bend downward.
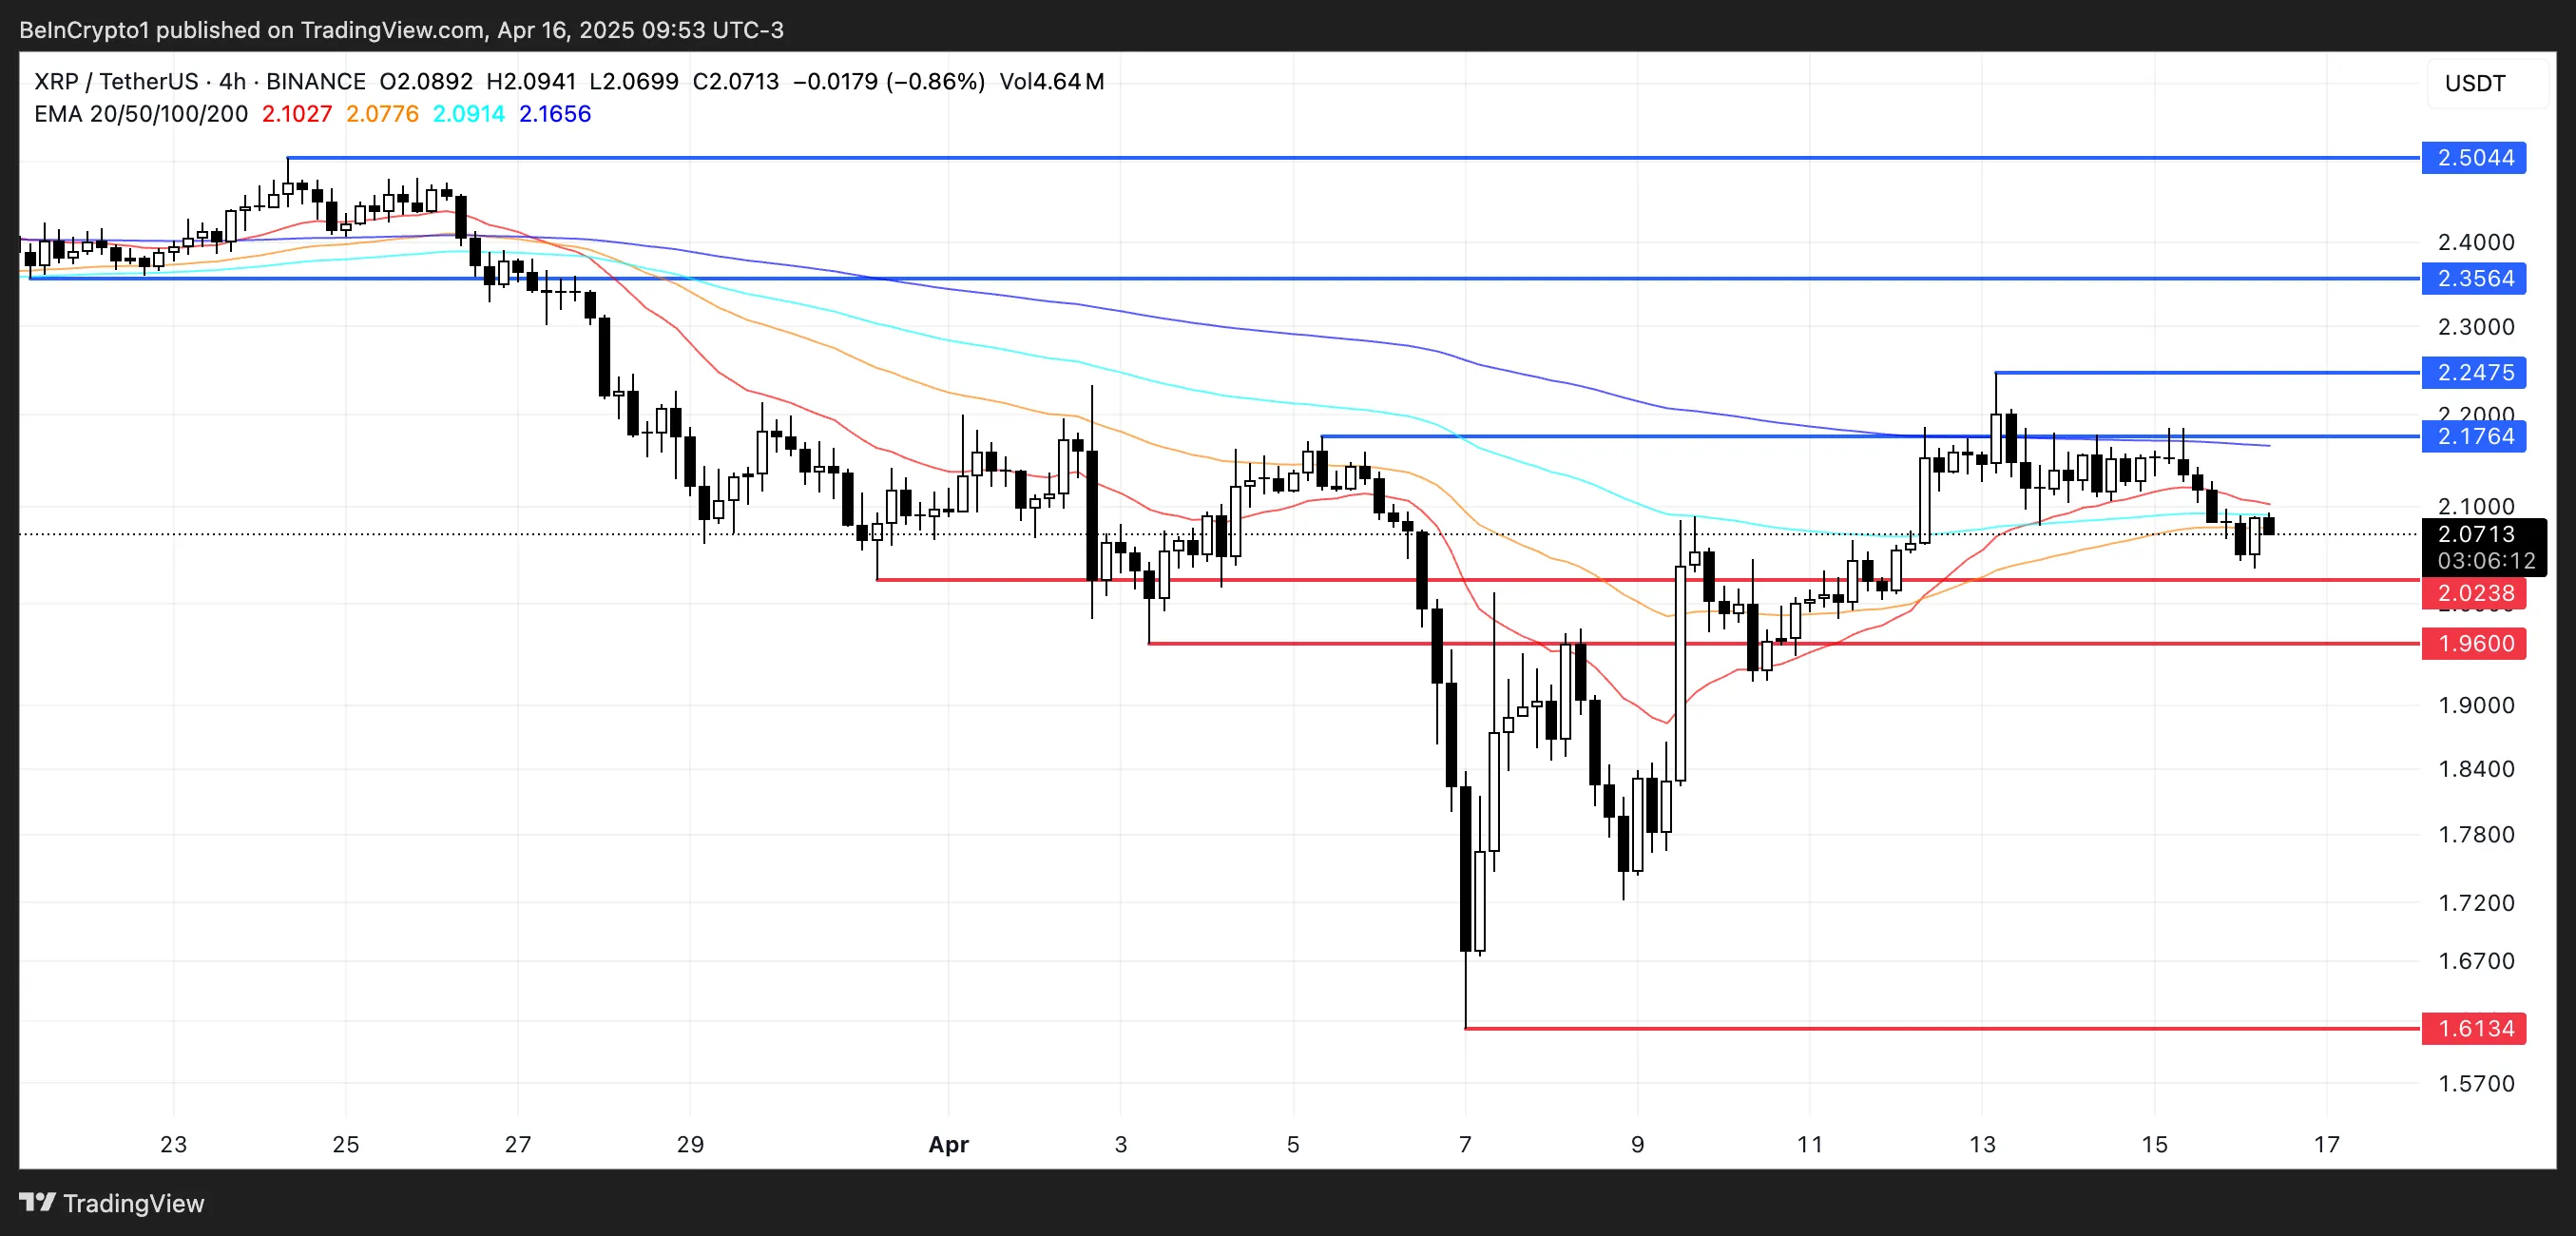
A potential death cross, where the short-term EMA crosses below the long-term EMA, appears to be forming. If confirmed, it could signal a deeper correction ahead, with XRP possibly retesting support levels at $2.02 and $1.96.
A breakdown below these levels could lead to a drop toward $1.61. However, if bulls manage to reclaim $2.17, the next resistance at $2.24 becomes the key target.
A clean break above that could trigger a stronger rally, potentially pushing XRP to $2.35 or even $2.50 if momentum accelerates.
Disclaimer
In line with the Trust Project guidelines, this price analysis article is for informational purposes only and should not be considered financial or investment advice. BeInCrypto is committed to accurate, unbiased reporting, but market conditions are subject to change without notice. Always conduct your own research and consult with a professional before making any financial decisions. Please note that our Terms and Conditions, Privacy Policy, and Disclaimers have been updated.

Reason to trust
![]()
Strict editorial policy that focuses on accuracy, relevance, and impartiality
Created by industry experts and meticulously reviewed
The highest standards in reporting and publishing
Strict editorial policy that focuses on accuracy, relevance, and impartiality
Morbi pretium leo et nisl aliquam mollis. Quisque arcu lorem, ultricies quis pellentesque nec, ullamcorper eu odio.
PEPE’s price action has been relatively quiet in the past few weeks. The meme coin has been quietly going through a continued wave of selloffs amidst the volatility in the wider crypto market.
However, an interesting technical analysis shows that the chart structure of PEPEUSDT is pointing to a massive move to the upside, one that could send the token soaring by as much as 796% before the end of 2025. As the broader crypto market continues to move sideways, crypto analyst MasterAnanda identified a short-term higher low forming around support levels, which could act as the launchpad for a major PEPE price breakout.
Short-Term Higher Low Points To Strong Accumulation Zone
The bullish outlook on PEPE is based on the repeat of a similar price formation that played out in 2024 before its run to new price highs and eventually its current all-time high of $0.00002803. According to the price chart shared by the analyst on the TradingView platform, PEPE initially traded in a descending channel between May to September 2024 before eventually breaking out of the channel. After breaking out of the channel, PEPE went on a brief uptrend and another downside which led to the creation of a lower low, before eventually going on an extended rally that peaked in December 2024.
Related Reading
Notably, it seems the same structure is showing up again on the PEPE price chart, specifically on the daily candlestick timeframe. In the analysis, MasterAnanda marks April as the period where PEPE bottomed out within a descending channel. Since then, two distinct highs and two clear lows have shaped what appears to be a reversal structure.

Most notably, a new higher low is beginning to form a pattern that, according to previous price action, could precede a bullish wave. The analyst labels this as a important stage, especially for spot traders who are positioning for long-term growth. Although there could be weakness in the short term, which could result in one last shakeout or another downside wick, the analyst noted that this shouldn’t worry spot investors.
It may offer a final opportunity to accumulate before momentum builds toward a new cycle high. On the other hand, leveraged traders are advised to proceed with caution and risk management, given the potential volatility during the build-up to the breakout.
Fibonacci Levels Show 480% To 796% Rally Target
The chart highlights a significant confluence around Fibonacci extension levels, with the 1.618 Fib level suggesting a possible 480% move and the more ambitious 2.618 extension pointing to a 796% upside. Interestingly, MasterAnanda noted that the numbers are huge.
Related Reading
Although these targets are just projections, they align with the previous rally seen in late 2024. If this prediction structure holds, the next rally could push PEPE beyond the 1.618 Fib level at $0.0004264, surpassing all prior highs and printing a new all-time high in 2025.
At the time of writing, PEPE is trading at $0.00000708, down by 4.7% in the past 24 hours.
Featured image from Shutterstock, chart from Tradingview.com

According to CoinGecko’s quarterly report, the overall crypto market cap fell 18.6% in Q1 2025. Trading volume on centralized exchanges also fell 16% compared to the previous quarter.
This report identified a few positive trends, but most of them contained at least one significant downside. Despite the market euphoria in January, recession fears are taking a very serious toll.
Crypto Suffered Heavy Losses in Q1
The latest CoinGecko report shows just how bearish the first quarter of the year has been. Although the crypto market started January with a major bullish cycle, macroeconomic factors have heavily impacted market sentiment for the past two months.
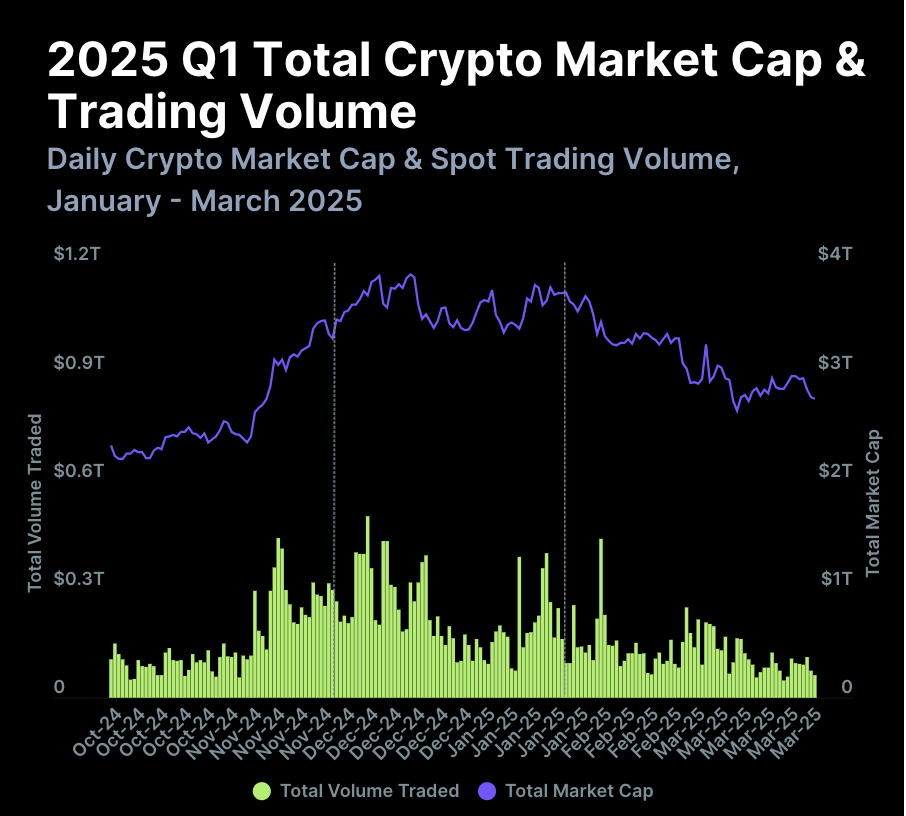
According to this report, crypto’s total market cap fell 18.6% in Q1 2025, a staggering $633.5 billion. Investor activity fell alongside token prices, as daily trading volumes fell 27.3% quarter-on-quarter from the end of 2024. Spot trading volume on centralized exchanges fell 16.3%, which CoinGecko at least partially attributes to the Bybit hack.
The report mostly focused on concrete numbers, but it pointed to a few specific events that impacted crypto. Markets hit a local high around Trump’s inauguration, thanks to market euphoria over possible friendly policies.
His TRUMP meme coin fueled a brief frenzy in Solana meme coin activity, but this quickly slumped. The LIBRA scandal had a further dampening impact.
Bitcoin increased its dominance in Q1 2025, accounting for 59.1% of crypto’s total market cap. It hasn’t maintained that share of the market since 2021, symbolizing how much more stable it’s been than altcoins.
Nevertheless, BTC also fell 11.8% and was outperformed by gold and US Treasury bonds.
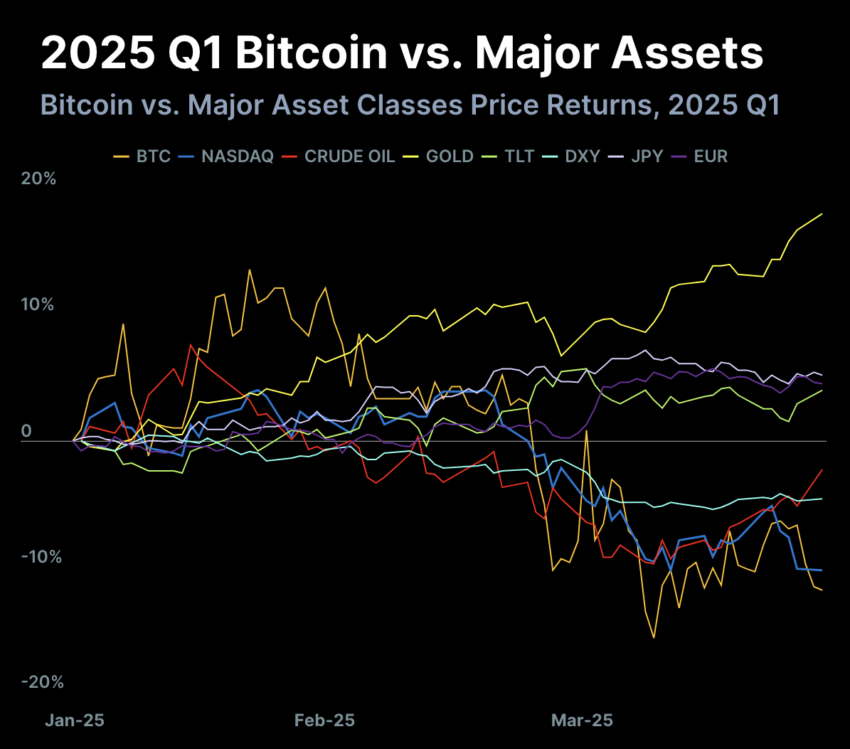
This data point is especially worrying because Trump’s tariffs have wrought havoc on Treasury yields. Even so, the report clearly shows that the rest of crypto suffered even more. Ethereum’s entire 2024 gains vanished in Q1 2025, and multichain DeFi TVL fell 27.5%. C
ountless other areas saw similar results, but they’re too numerous to easily summarize.
That is to say, almost every quantifiable positive development came with at least one major caveat. Solana dominated the DEX trade, but its TVL declined by over one-fifth.
Bitcoin ETFs saw $1 billion in fresh inflows, but total AUM fell by nearly $9 billion due to price drops. The reports reflect that recession fears are gripping the crypto market.
Disclaimer
In adherence to the Trust Project guidelines, BeInCrypto is committed to unbiased, transparent reporting. This news article aims to provide accurate, timely information. However, readers are advised to verify facts independently and consult with a professional before making any decisions based on this content. Please note that our Terms and Conditions, Privacy Policy, and Disclaimers have been updated.

Expert Reveals Hurdles For Ripple And The SEC Ahead Of Final Resolution
XRP Slides Into Bearish Zone Amid Weak Trading Signals

PEPE Price To Bounce 796% To New All-Time Highs In 2025? Here’s What The Chart Says

Crypto Market Lost $633 Billion in Q1 2025, CoinGecko Finds

Base Meme Coin Wipes $15 Million After Official Promotion

ETF Issuers Bring Stability to Bitcoin Despite Tariff Chaos

2.52 Million Altcoins Are Ruining Crypto’s Future

Animoca Brands Valuation Tanks 75% In Two Years, Here’s Why

Crypto exchange BingX hacked for $43 million

Are The Big Players Losing Interest?

Hong Kong’s Securities Association Tips Authorities On Crypto Self-Regulation

Coinbase cbBTC Set to go Live on Solana
2.52 Million Altcoins Are Ruining Crypto’s Future
Animoca Brands Valuation Tanks 75% In Two Years, Here’s Why
Crypto exchange BingX hacked for $43 million
Are The Big Players Losing Interest?
Hong Kong’s Securities Association Tips Authorities On Crypto Self-Regulation
Coinbase cbBTC Set to go Live on Solana
-

 Market24 hours ago
Bitcoin Price on The Brink? Signs Point to Renewed Decline
-
 Altcoin21 hours ago
Ripple Whale Moves $273M As Analyst Predicts XRP Price Crash To $1.90
-

 Market20 hours ago
Arbitrum RWA Market Soars – But ARB Still Struggles
-

 Bitcoin20 hours ago
Is Bitcoin the Solution to Managing US Debt? VanEck Explains
-

 Market21 hours ago
XRP Price Pulls Back: Healthy Correction or Start of a Fresh Downtrend?
-

 Market19 hours ago
Cardano (ADA) Pressure Mounts—More Downside on the Horizon?
-
 Altcoin19 hours ago
Expert Reveals Current Status Of 9 Ripple ETFs
-

 Market23 hours ago
Ethereum Leads Q1 2025 DApp Fees With $1.02 Billion
