Market
Render (RNDR) Price Strengthens, Yet Challenges Remain

Render (RNDR) price has surged by 26% over the last week, establishing it as a key player in the booming crypto AI sector. However, despite this strong price growth, RNDR is lagging behind its top competitors in critical metrics like social dominance and trading volume. Tokens such as FET, TAO, and WLD have captured more market attention, raising questions about RNDR’s long-term momentum.
Indicators, including the Bollinger Bands Trend and Global In/Out of the Money, signal that RNDR may face significant resistance ahead. As the coin’s upward momentum begins to cool, the next few weeks will be crucial for RNDR’s price.
Is RNDR Being Left Behind In the Crypto AI Race?
RNDR has solidified its position as one of the most prominent players in the crypto AI space, riding on the wave of increased interest in artificial intelligence coins. Over the last seven days, RNDR’s price has seen an impressive 26% increase, reflecting strong market demand. However, when placed alongside the top five AI coins, the picture becomes more complex.
Despite its ranking as the third-largest AI token by market cap, RNDR ranks only fourth in terms of social dominance. That suggests it’s not garnering the same level of attention or hype as some of its competitors. Players like FET, TAO, and WLD have captured more of the public’s focus, leaving RNDR to compete for visibility, only outperforming AKT in terms of attention.
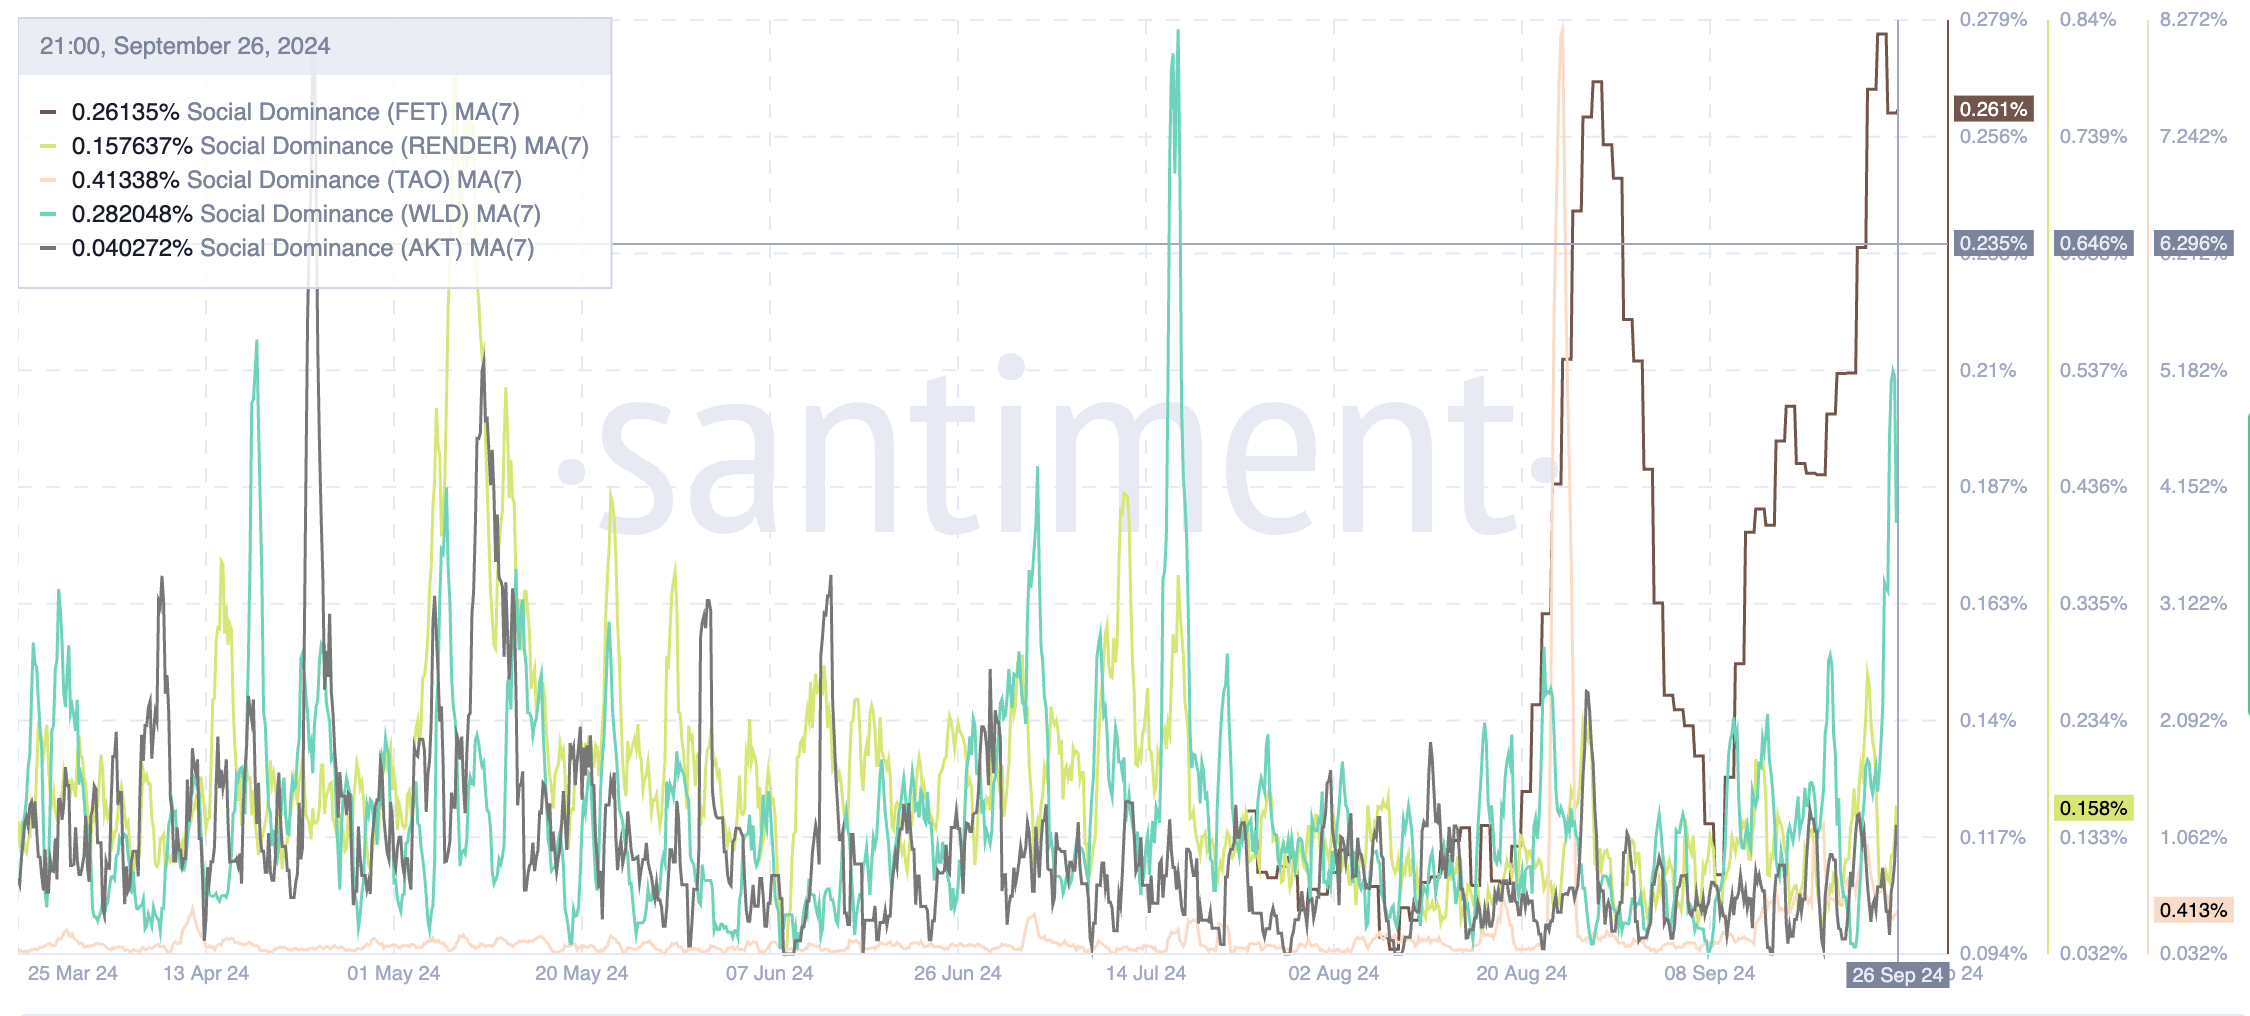
This underperformance in social dominance aligns with its relative price growth. Over the past month, RNDR has risen by 19%, a respectable gain but still lagging significantly behind FET (up 39.84%), TAO (up 81.52%), and WLD (up 37.27%).
Once again, RNDR only outpaces AKT, which trails behind the rest. The same trend can be observed when looking at trading volume.
Read More: Render Token (RNDR) Price Prediction 2024/2025/2030
While RNDR attracted $2.25 billion in trading volume last month, this figure is notably lower than that of FET, TAO, and WLD. This suggests that the broader market interest and liquidity are flowing more heavily toward its competitors.
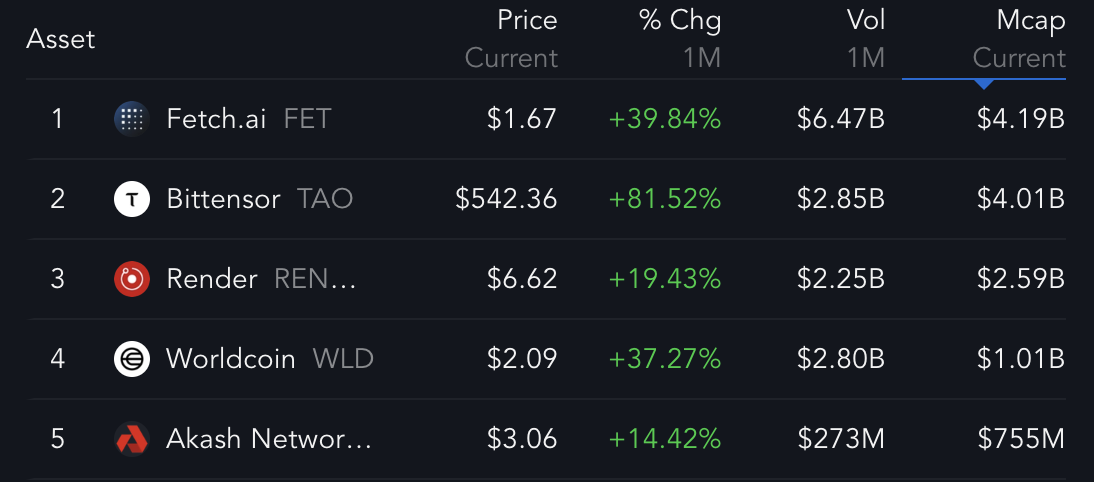
These dynamics indicate that while RNDR is undeniably a key player in the AI and crypto segment, it is struggling to maintain momentum against its fiercest rivals. This disparity in social engagement, price performance, and volume could signal potential headwinds for RNDR price in the near future.
Without a significant uptick in market attention or renewed catalysts to drive interest, RNDR’s current underperformance relative to its competitors might dampen its price trajectory in the weeks to come. In a market as sentiment-driven as crypto, the ability to capture attention is crucial. RNDR’s comparative lack of visibility could hinder its long-term performance despite its possible solid fundamentals.
RNDR Bollinger Bands Trend Could Be Cooling Off
The Bollinger Bands Trend (BBTrend) for RNDR has remained positive for the last six days, rising sharply from 0.36 to 18, mirroring its recent price growth.
Bollinger Bands Trend is a technical indicator used to measure market volatility and trend strength. It is based on the concept of Bollinger Bands, which plot two standard deviations away from a moving average.
When prices are consistently near the upper band, it suggests a strong bullish trend. However, a move toward the lower band can indicate potential bearishness.
The BBTrend specifically looks at how the bands are expanding or contracting to signal whether volatility is increasing or decreasing, which often hints at potential price movements.

While the BBTrend has shown positive growth recently and is still positive, around 12, it has started to decline in the last few days. This drop in the indicator could be a warning sign that the upward momentum might be slowing down.
If the BBTrend continues to decrease, it may suggest a potential shift in the current price trend. This shift may signal a reversal or consolidation period for RNDR.
On the other hand, if the BBTrend recovers and turns back upward, it could reinforce the bullish momentum. This shift may lead to further price gains. The coming days will be crucial in determining whether RNDR can maintain its positive trend.
RNDR Price Prediction: Correction Ahead?
The RNDR Global In/Out of the Money (GIOM) indicator reveals strong resistance levels ahead, particularly in the $6.72 to $8 range. This range indicates that a significant number of RNDR holders purchased at these price levels. As a result, there could be potential selling pressure when the price approaches these points.
GIOM is a key metric that shows how many token holders are either “in the money” (holding tokens at a profit based on current prices) or “out of the money” (holding tokens at a loss). If RNDR can break through the $7 mark, it could potentially test higher levels at $8.03 and even $9.91.
Read More: How To Buy Render Token (RENDER) and Everything You Need To Know
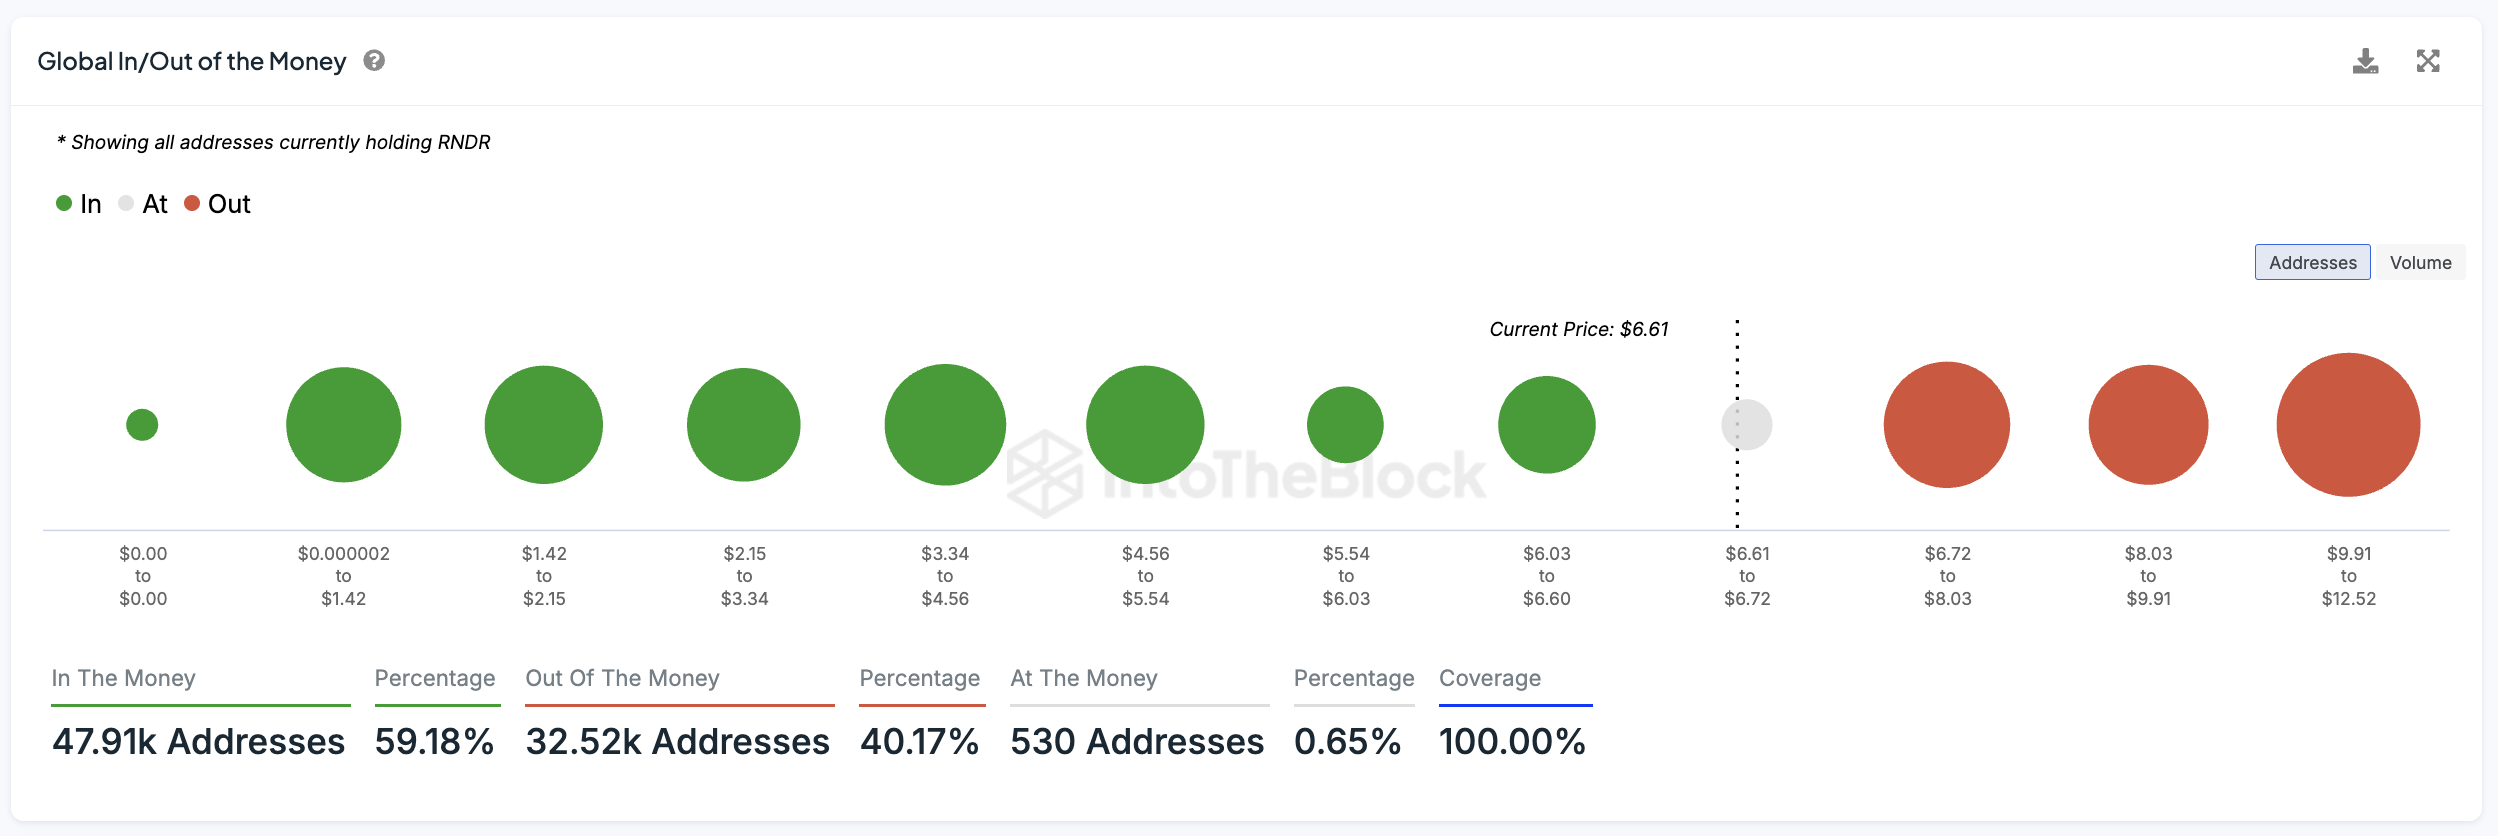
When many holders are in the money at a certain price level, it often forms a resistance point, as they may sell to secure profits. Conversely, when a large portion of holders are out of the money at lower price levels, this forms support. That happens because fewer are willing to sell at a loss, limiting downward pressure.
On the downside, RNDR price support levels appear weaker. If the price drops to $6.03, it could retrace further, potentially sliding to $5.54 or even below $5. This suggests that RNDR has stronger barriers to overcome on the upside than it does on the downside.
Disclaimer
In line with the Trust Project guidelines, this price analysis article is for informational purposes only and should not be considered financial or investment advice. BeInCrypto is committed to accurate, unbiased reporting, but market conditions are subject to change without notice. Always conduct your own research and consult with a professional before making any financial decisions. Please note that our Terms and Conditions, Privacy Policy, and Disclaimers have been updated.
Market
Will the SEC Approve Grayscale’s Solana ETF?

Grayscale has submitted a registration statement with the SEC to convert its Grayscale Solana Trust (GSOL) into an ETF listed on NYSE Arca.
Despite the filing, prediction markets remain unconvinced about the chances of approval.
Is a Solana ETF Approval Still Unlikely for Q2?
On Polymarket, odds for a Solana ETF approval in the second quarter of 2025 stand at just 23%. Broader expectations for any 2025 approval are at 83%, down from 92% earlier this year.
The decline reflects regulatory delays. In March, the SEC extended review timelines for several ETF applications tied to Solana, XRP, and other altcoins.

This pattern suggests the agency may be holding off on decisions until a permanent chair takes over. Mark Uyeda, currently serving as interim chair, has not signaled a shift in stance.
Paul Atkins, Trump’s nominee to lead the agency, appeared before the Senate last week. Lawmakers questioned his involvement in crypto-related businesses, adding further uncertainty around future approvals.
Grayscale’s latest filing excludes staking, which could speed up the review process. The SEC has previously objected to staking features in ETF proposals.
When spot Ethereum ETFs moved forward last year, Grayscale, Fidelity, and Ark Invest/21Shares all removed staking components to align with the SEC’s expectations at the time.
Under Gary Gensler’s leadership, the SEC expressed concern that proof-of-stake protocols could fall under securities law. Asset managers adjusted their applications accordingly to move forward.
Following approvals for spot Bitcoin and Ethereum ETFs, several firms aim to expand their offerings to include other cryptocurrencies. They plan to offer access through traditional brokerage accounts without requiring direct asset custody.
Solana remains a strong contender due to its growing futures market in the US and a more favorable regulatory environment. Analysts view it as one of the next likely approvals if the SEC opens the door to more altcoin ETFs.
Disclaimer
In adherence to the Trust Project guidelines, BeInCrypto is committed to unbiased, transparent reporting. This news article aims to provide accurate, timely information. However, readers are advised to verify facts independently and consult with a professional before making any decisions based on this content. Please note that our Terms and Conditions, Privacy Policy, and Disclaimers have been updated.
Market
XRP Price Vulnerable To Falling Below $2 After 18% Decline
XRP has faced a significant correction in recent weeks, resulting in an 18% decline in the altcoin’s price. As a result, XRP is currently struggling to maintain upward momentum, with investors losing confidence.
This recent slump has raised concerns about the asset’s future, especially as certain XRP holders begin to sell their positions, increasing bearish pressure.
XRP Investors Are Pulling Back
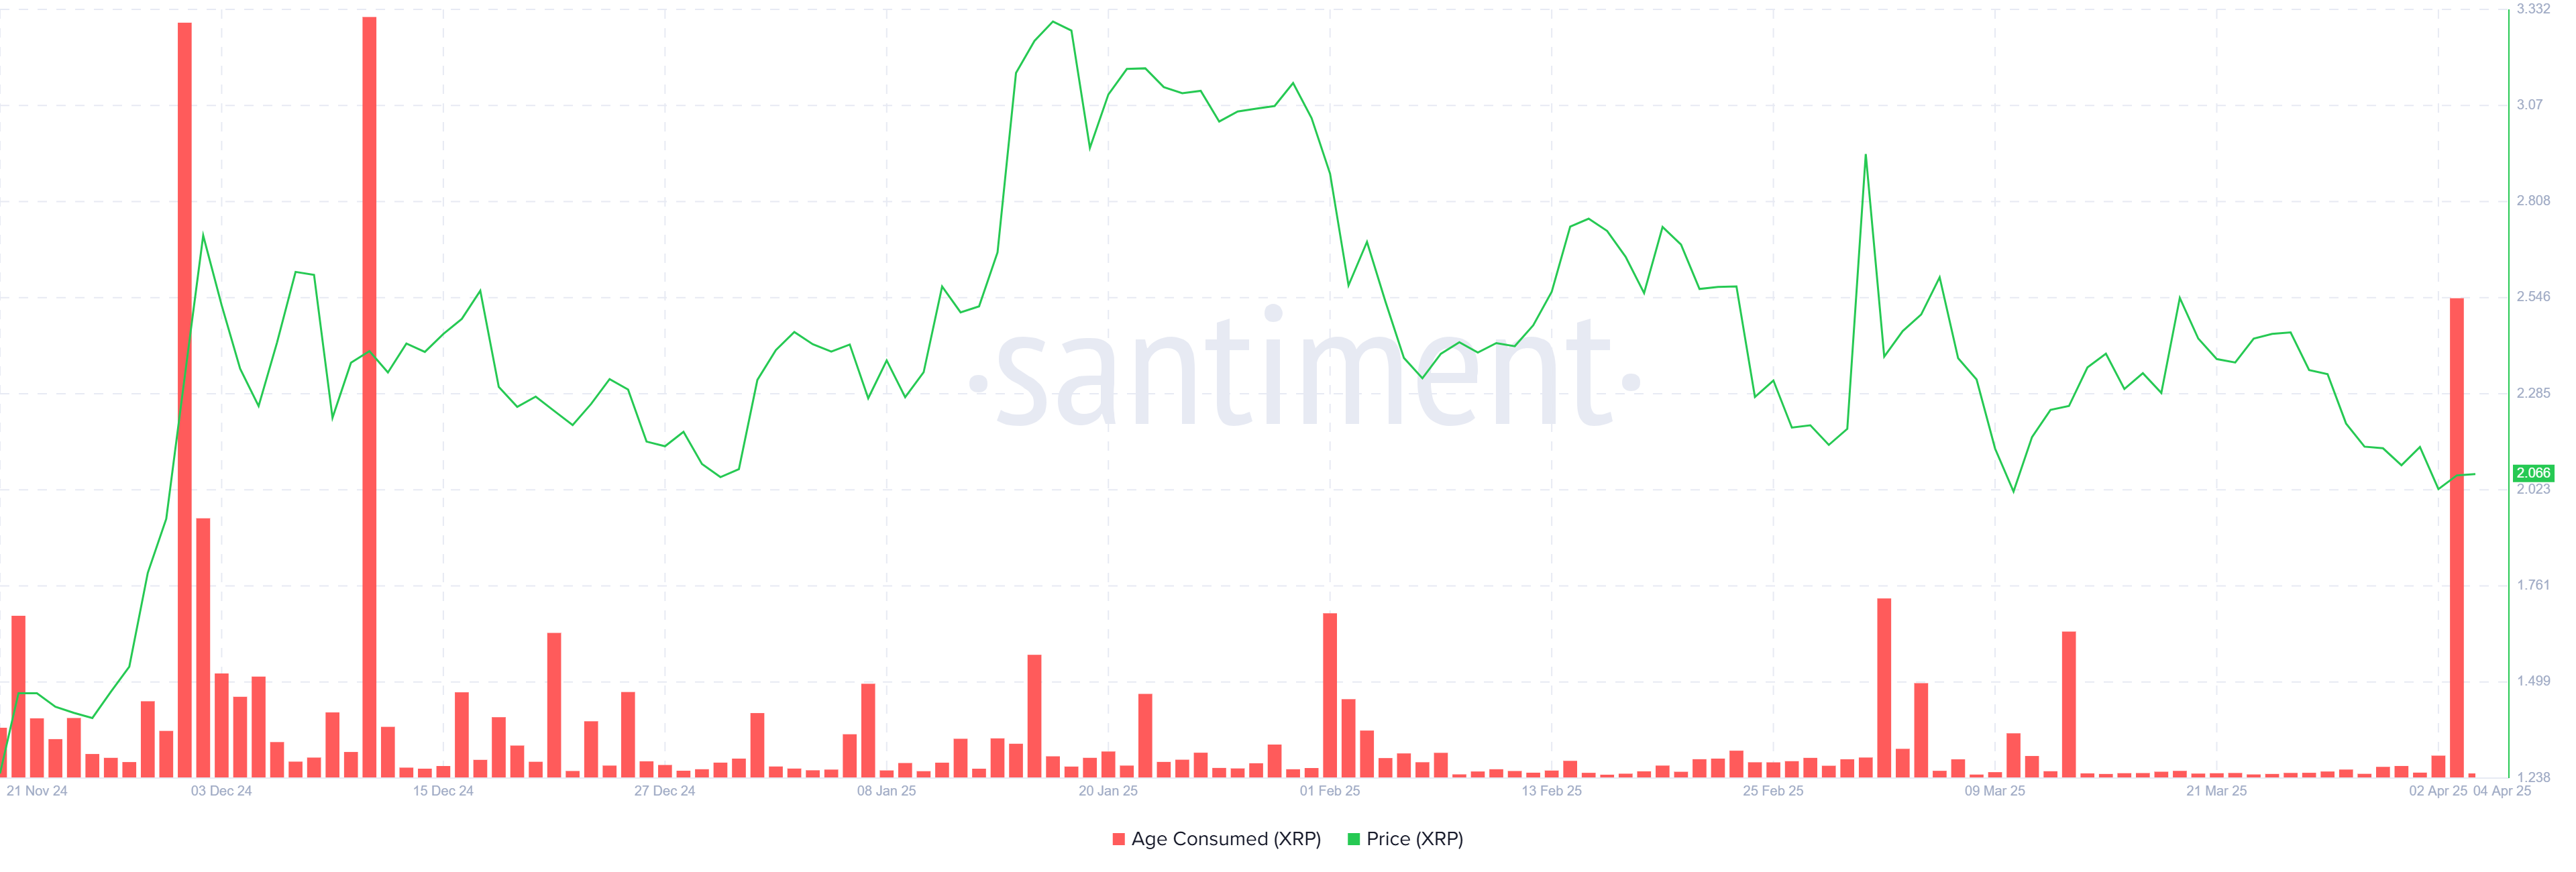
The recent downturn in XRP’s price has triggered a sharp spike in the “Age Consumed” metric. This indicator tracks the movement of coins from long-term holders (LTHs) and has reached its highest level in over four months. The increase suggests that LTHs, who have been holding XRP for extended periods, are now losing patience.
This selling behavior may be driven by the lack of price recovery and the overall weak market conditions that have not improved. These holders appear to be attempting to limit their losses by liquidating their positions, which in turn increases the downward pressure on XRP’s price. This mass selling from LTHs further compounds the challenges for XRP, as their decision to sell is often seen as a sign of waning confidence in the cryptocurrency.
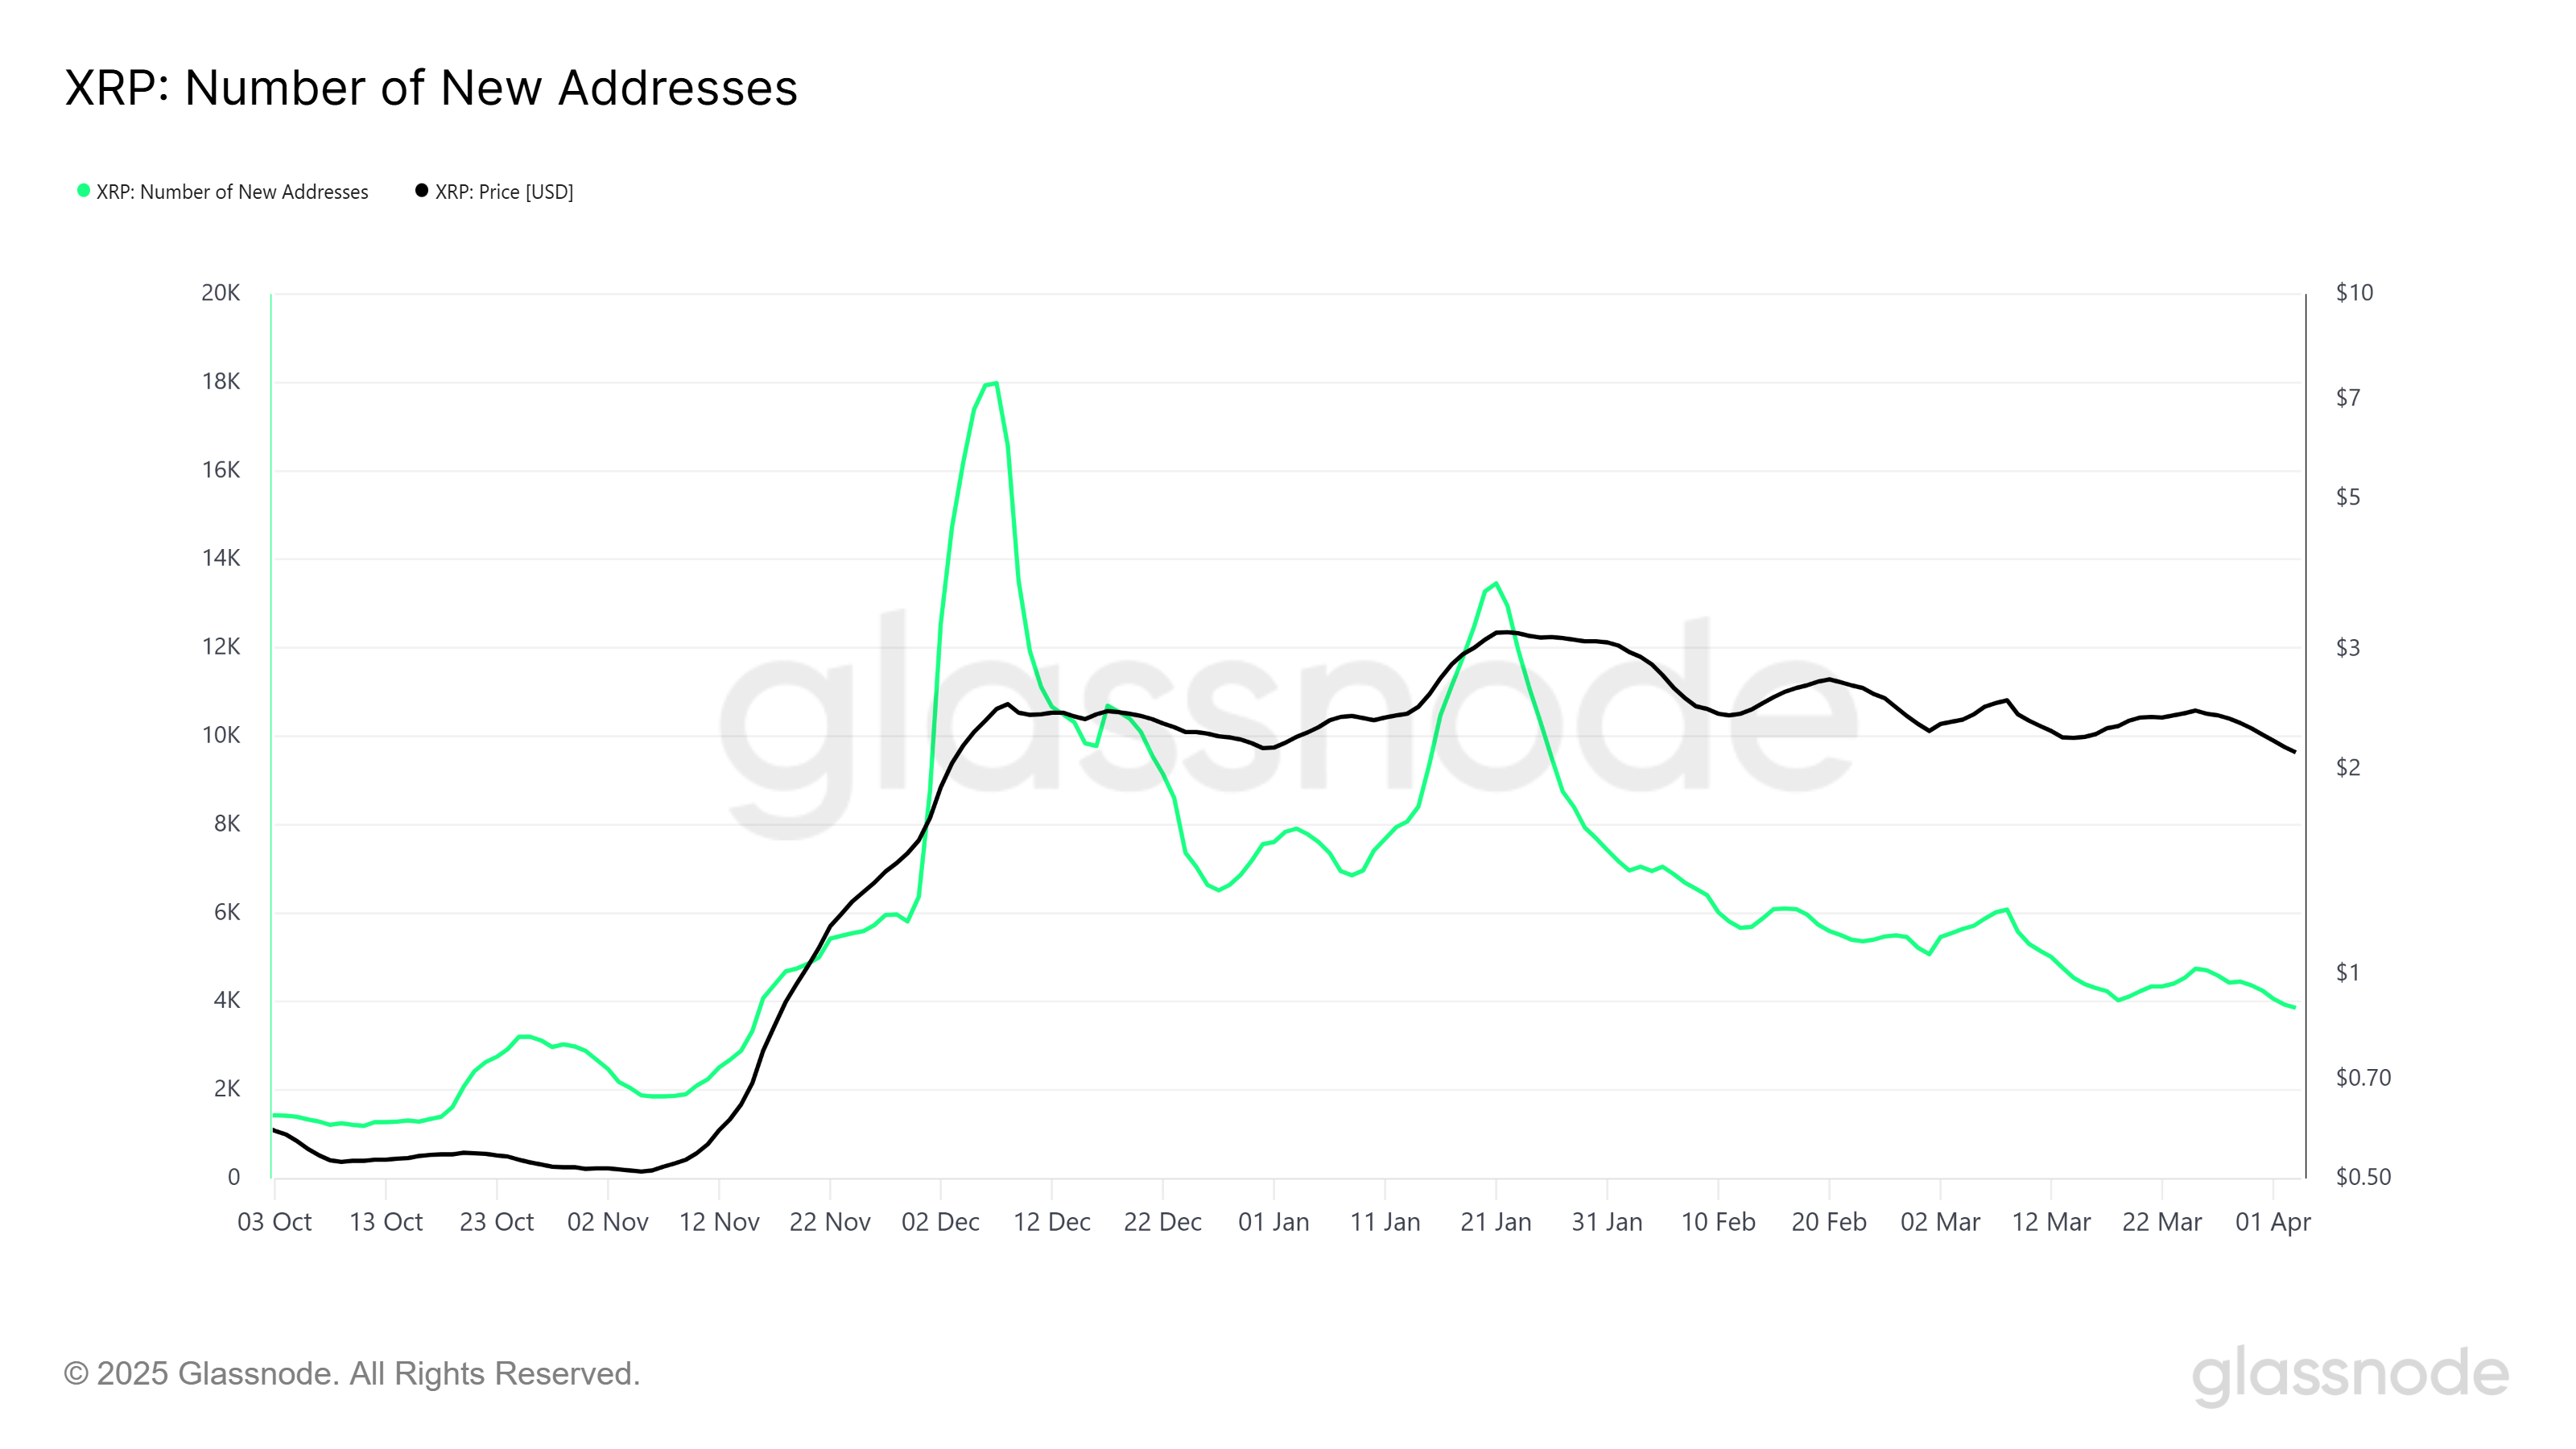
XRP’s market momentum appears to be weakening, as evidenced by the recent decline in the number of new addresses. The metric tracking new addresses has fallen to a five-month low, suggesting that XRP is struggling to attract new investors. This lack of fresh interest signals growing skepticism within the broader market, with potential investors hesitant to buy into an asset that has failed to deliver strong price action.
The drop in new addresses reflects a broader trend of reduced market traction and the lack of conviction from buyers. When combined with the selling pressure from LTHs, it creates a challenging environment for XRP to regain bullish momentum
XRP Price Needs A Boost
XRP’s price is currently holding at $2.06, just above the key support level of $2.02. If it manages to stabilize and break through the immediate resistance at $2.14, there could be a potential rebound, taking XRP higher.
However, with the continued weakness in market sentiment and the aforementioned bearish cues, XRP remains vulnerable to further declines. If the support of $2.02 fails, the price could drop further to $1.94, extending the 18% decline noted in the last two weeks.
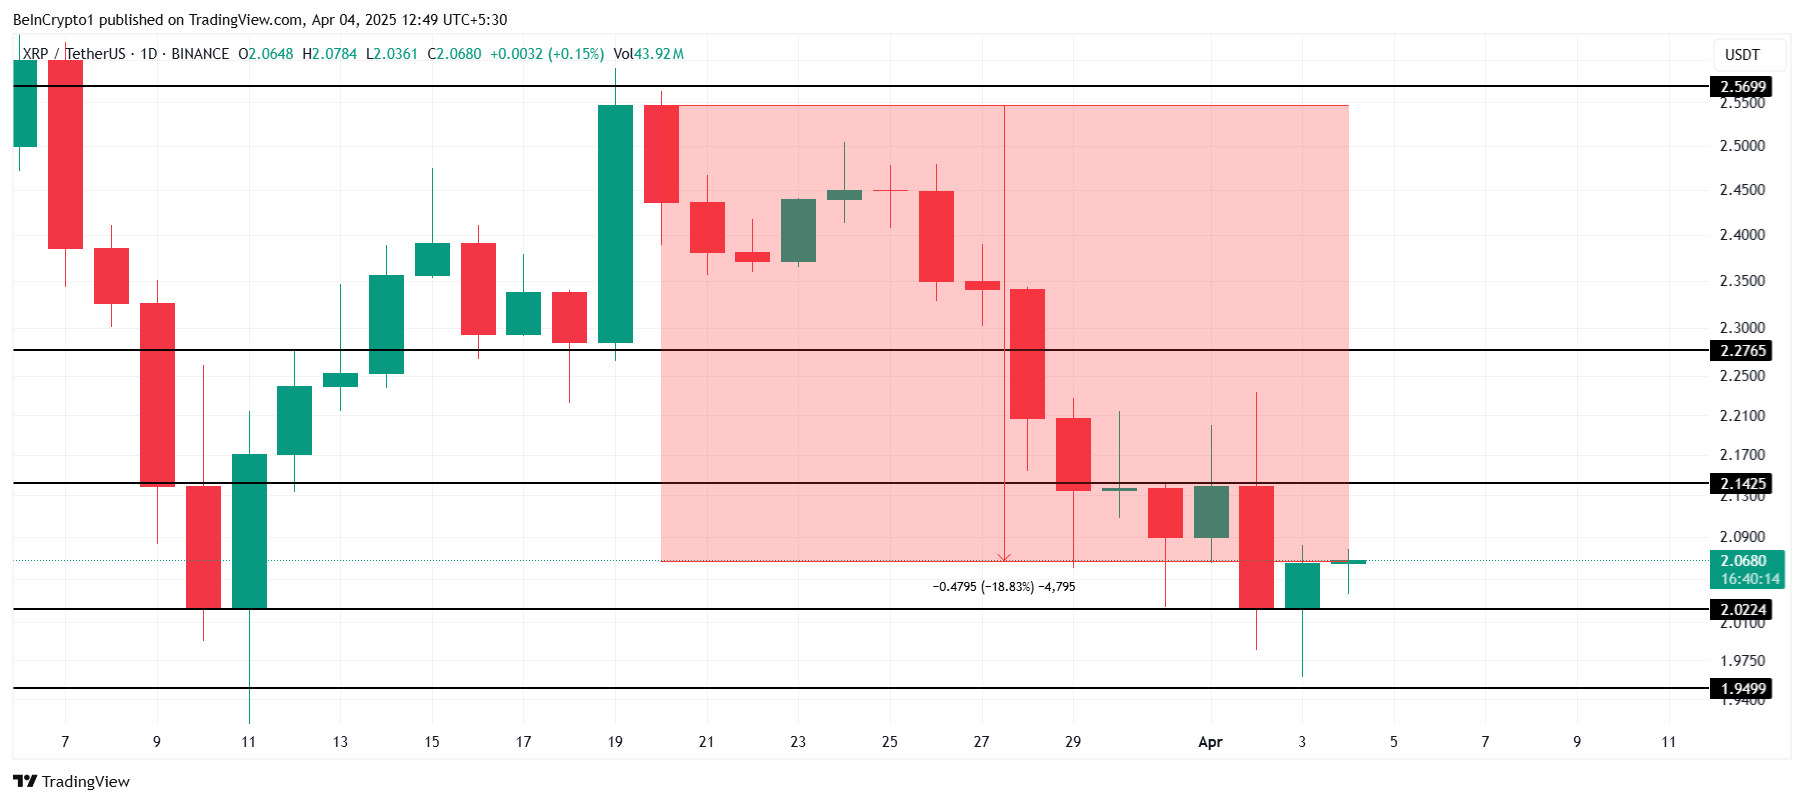
If XRP manages to reclaim the $2.14 level and holds above it, the price could make its way toward $2.27. Breaching this level would invalidate the bearish outlook, signaling a potential recovery and restoring investor confidence in the cryptocurrency.
Disclaimer
In line with the Trust Project guidelines, this price analysis article is for informational purposes only and should not be considered financial or investment advice. BeInCrypto is committed to accurate, unbiased reporting, but market conditions are subject to change without notice. Always conduct your own research and consult with a professional before making any financial decisions. Please note that our Terms and Conditions, Privacy Policy, and Disclaimers have been updated.
Market
HBAR Futures Traders Lead the Charge as Buying Pressure Grows

Hedera Foundation’s recent move to partner with Zoopto for a late-stage bid to acquire TikTok has sparked renewed investor interest in HBAR, driving a fresh wave of demand for the altcoin.
Market participants have grown increasingly bullish, with a notable uptick in long positions signaling growing confidence in HBAR’s future price performance.
HBAR’s Futures Market Sees Bullish Spike
HBAR’s long/short ratio currently sits at a monthly high of 1.08. Over the past 24 hours, its value has climbed by 17%, reflecting the surge in demand for long positions among derivatives traders.

An asset’s long/short ratio compares the proportion of its long positions (bets on price increases) to short ones (bets on price declines) in the market.
When the long/short ratio is above one like this, more traders are holding long positions than short ones, indicating bullish market sentiment. This suggests that HBAR investors expect the asset’s price to rise, a trend that could drive buying activity and cause HBAR’s price to extend its rally.
Further, the token’s Balance of Power (BoP) confirms this bullish outlook. At press time, this bullish indicator, which measures buying and selling pressure, is above zero at 0.25.
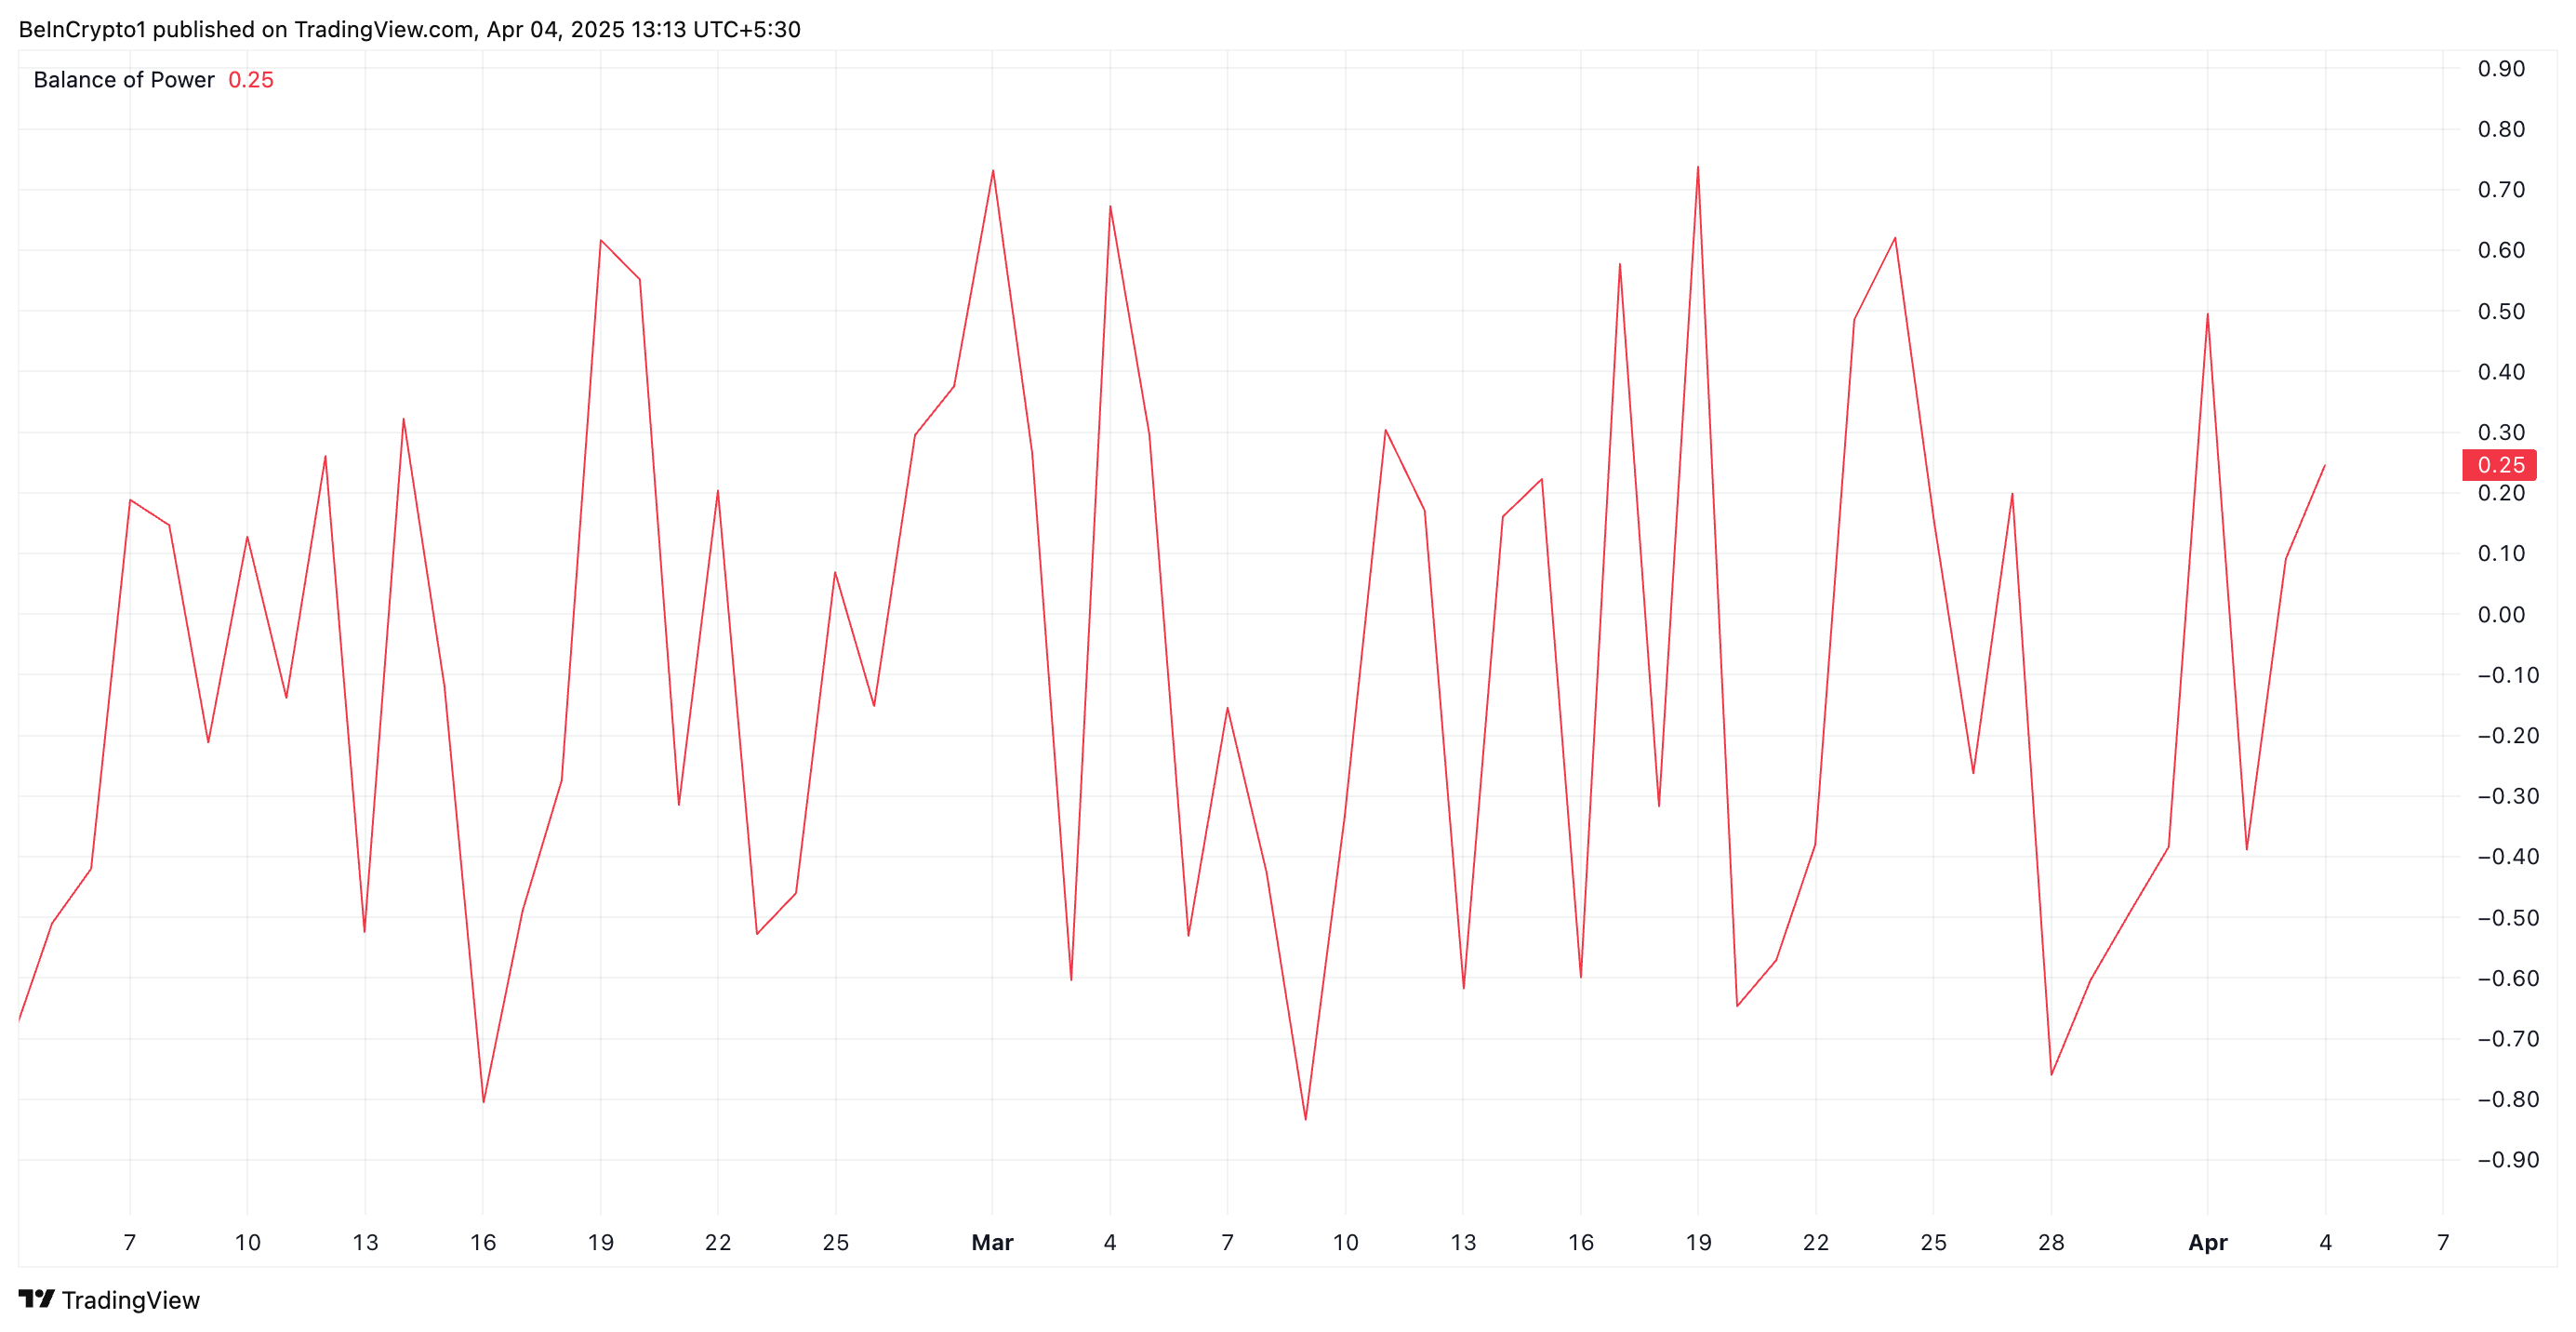
When an asset’s BoP is above zero, buying pressure is stronger than selling pressure, suggesting bullish momentum. This means HBAR buyers dominate price action, and are pushing its value higher.
HBAR Buyers Push Back After Hitting Multi-Month Low
During Thursday’s trading session, HBAR traded briefly at a four-month low of $0.153. However, with strengthening buying pressure, the altcoin appears to be correcting this downward trend.
If HBAR buyers consolidate their control, the token could flip the resistance at $0.169 into a support floor and climb toward $0.247.
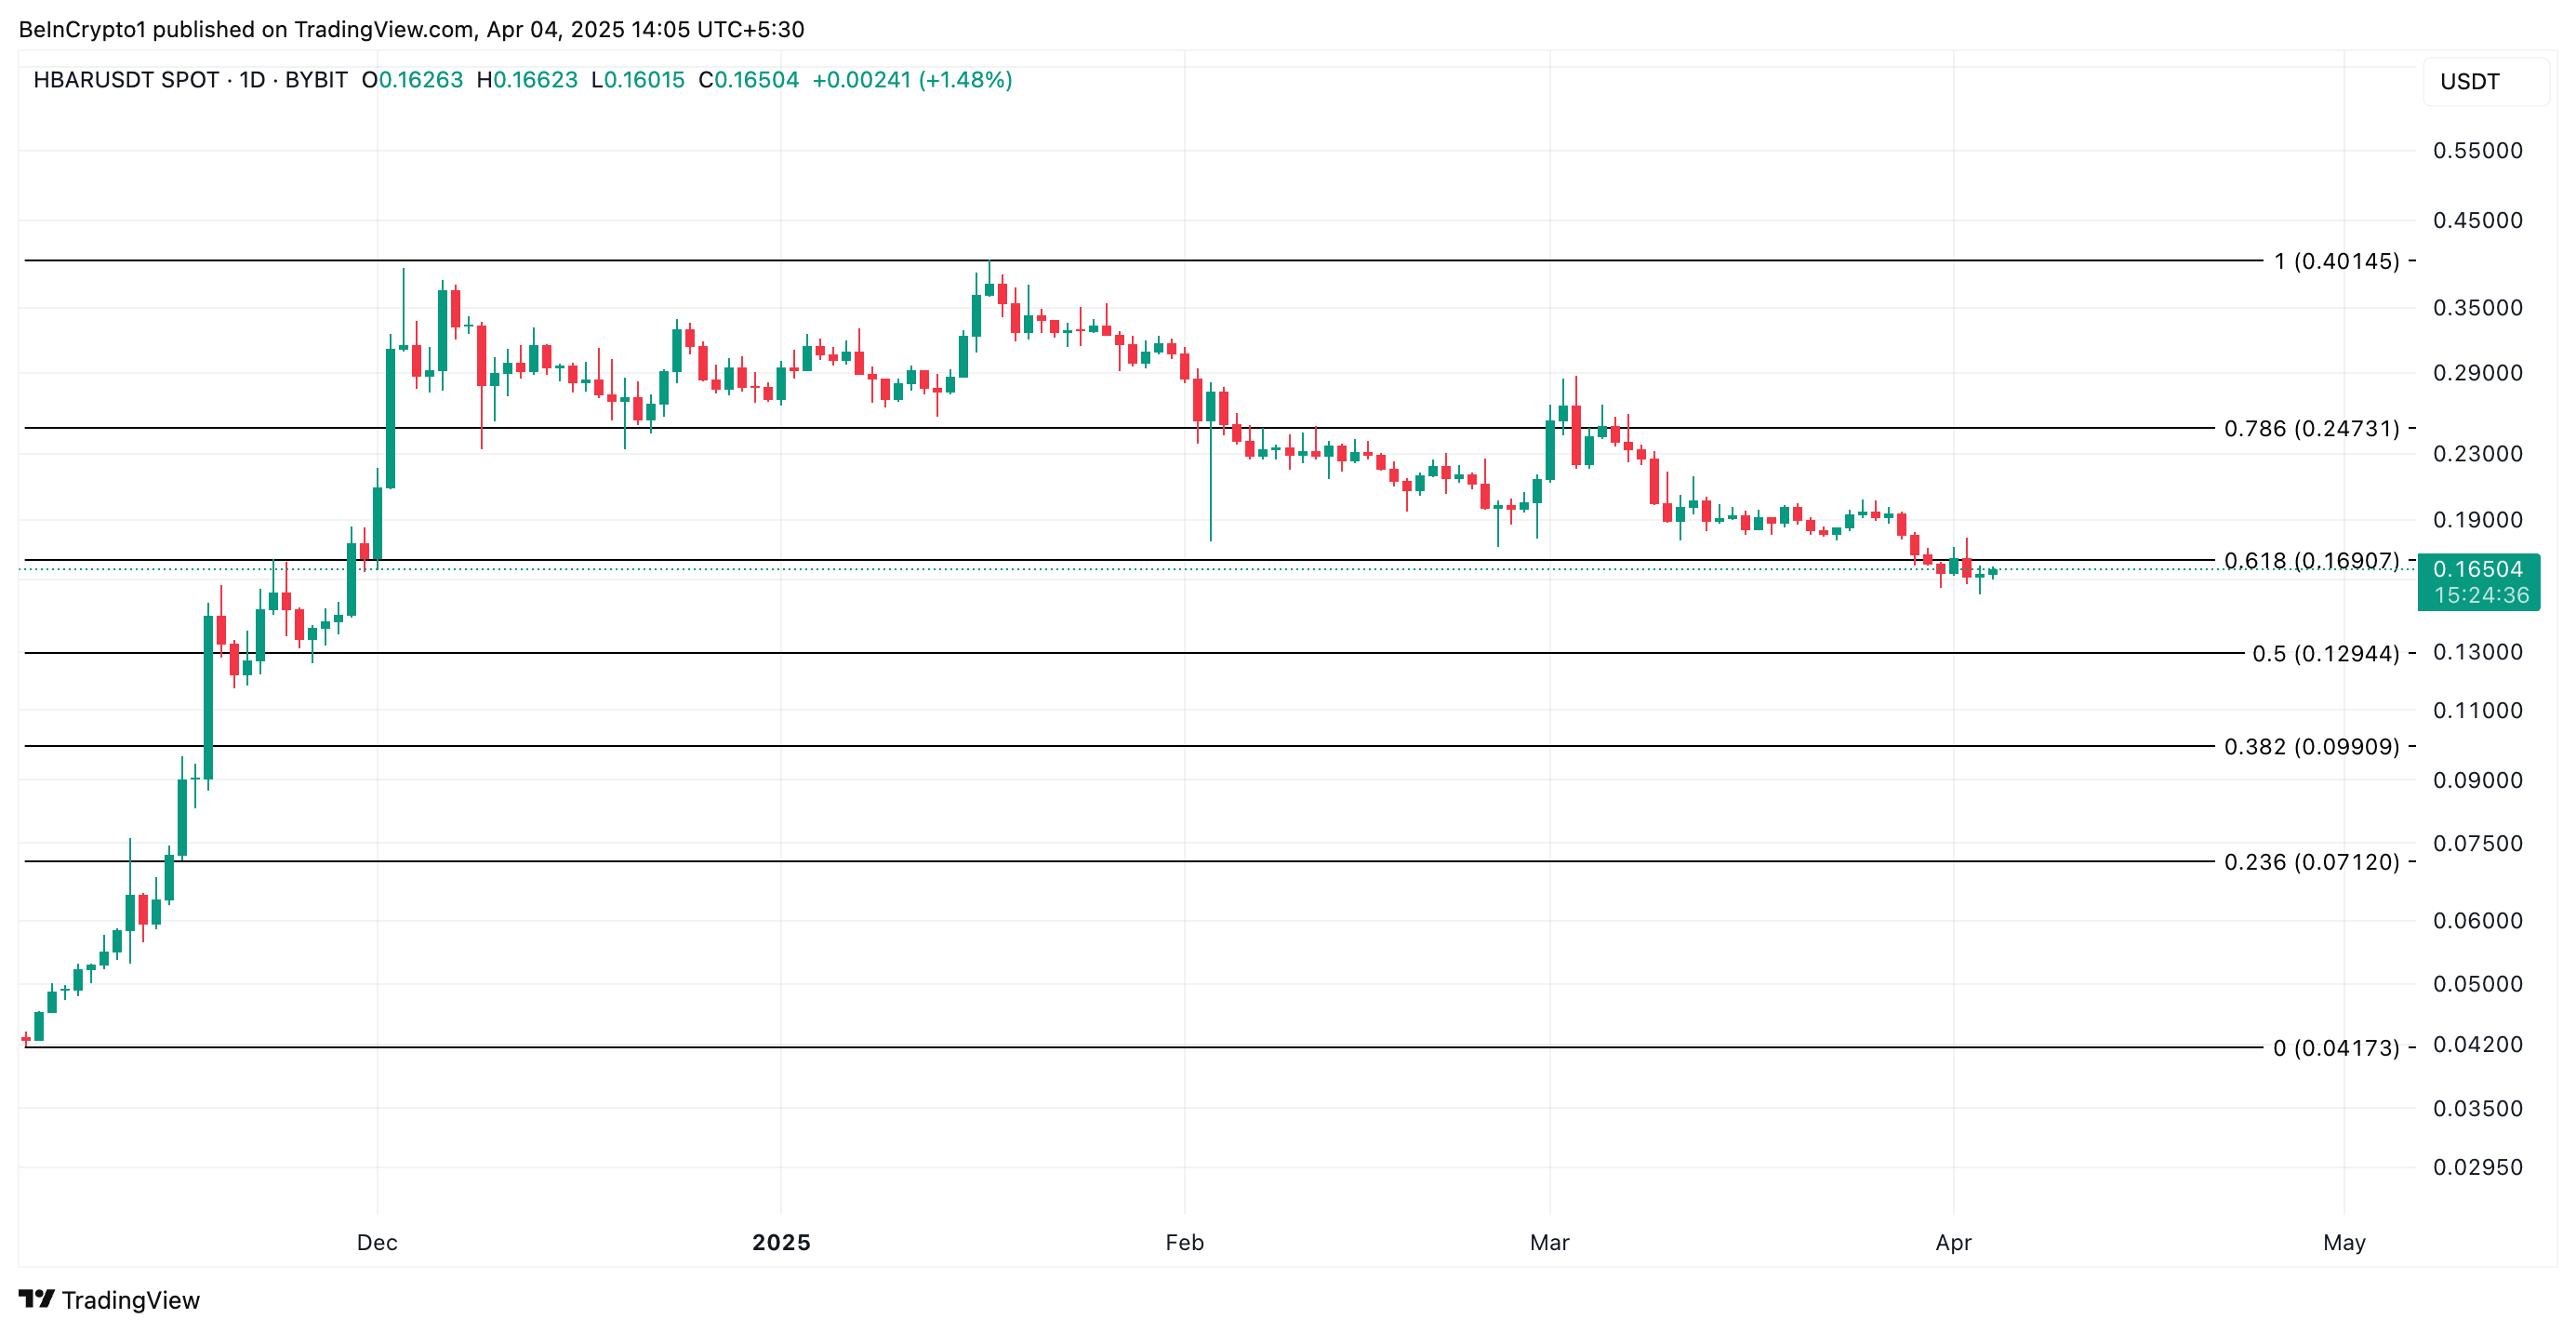
However, a resurgence in profit-taking activity will invalidate this bullish projection. HBAR could resume its decline and fall to $0.129 in that scenario.
Disclaimer
In line with the Trust Project guidelines, this price analysis article is for informational purposes only and should not be considered financial or investment advice. BeInCrypto is committed to accurate, unbiased reporting, but market conditions are subject to change without notice. Always conduct your own research and consult with a professional before making any financial decisions. Please note that our Terms and Conditions, Privacy Policy, and Disclaimers have been updated.
-

 Market24 hours ago
Binance Managed 94% of All Crypto Airdrops and Staking Rewards
-
 Regulation23 hours ago
US SEC Acknowledges Fidelity’s Filing for Solana ETF
-

 Market21 hours ago
Wormhole (W) Jumps 10%—But Is a Pullback Coming?
-
 Altcoin21 hours ago
Altcoin Season Still In Sight Even As Ethereum Struggles To Gain Upward Momentum
-

 Market23 hours ago
XRP Battle Between Bulls And Bears Hinges On $1.97 – What To Expect
-

 Market22 hours ago
Ripple Shifts $1B in XRP Amid Growing Bearish Pressure
-

 Market20 hours ago
Binance’s CZ is Helping Kyrgyzstan Become A Crypto Hub
-

 Altcoin20 hours ago
Here’s Why Is Shiba Inu Price Crashing Daily?


