
Market
A Red Flag for HMSTR Airdrop
The much-anticipated Hamster Kombat (HMSTR) airdrop finally happened yesterday, September 26. In total, the Telegram tap-to-earn mini app distributed 60 million tokens to “CEOs” involved in playing the game.
However, according to many players, the HMSTR airdrop fell short of expectations, leading most to sell the token as soon as it launched. But what else is happening?
Lackluster Hamster Kombat Aidrop Force Sell-Offs, Players React
The HMSTR token launched on several exchanges at 12:00 UTC. While the cryptocurrency community speculated on the price earlier, it eventually started trading at $0.014.
However, within minutes, the HMSTR price dropped by 20% due to massive sell-offs. This performance is in contrast with the broader market, which saw prices increase notably. Currently, the Hamster Kombat price is $0.0069, representing a 30% decrease in the last 24 hours.
As the price plummeted, the volume surpassed $1 billion. Volume is an indicator of interest in a cryptocurrency. When it increases, there is a lot of buying and selling. A decrease, on the other hand, however, indicates otherwise.
Read more: 7 Best Exchanges To Buy and Sell Hamster Kombat (HMSTR) in 2024
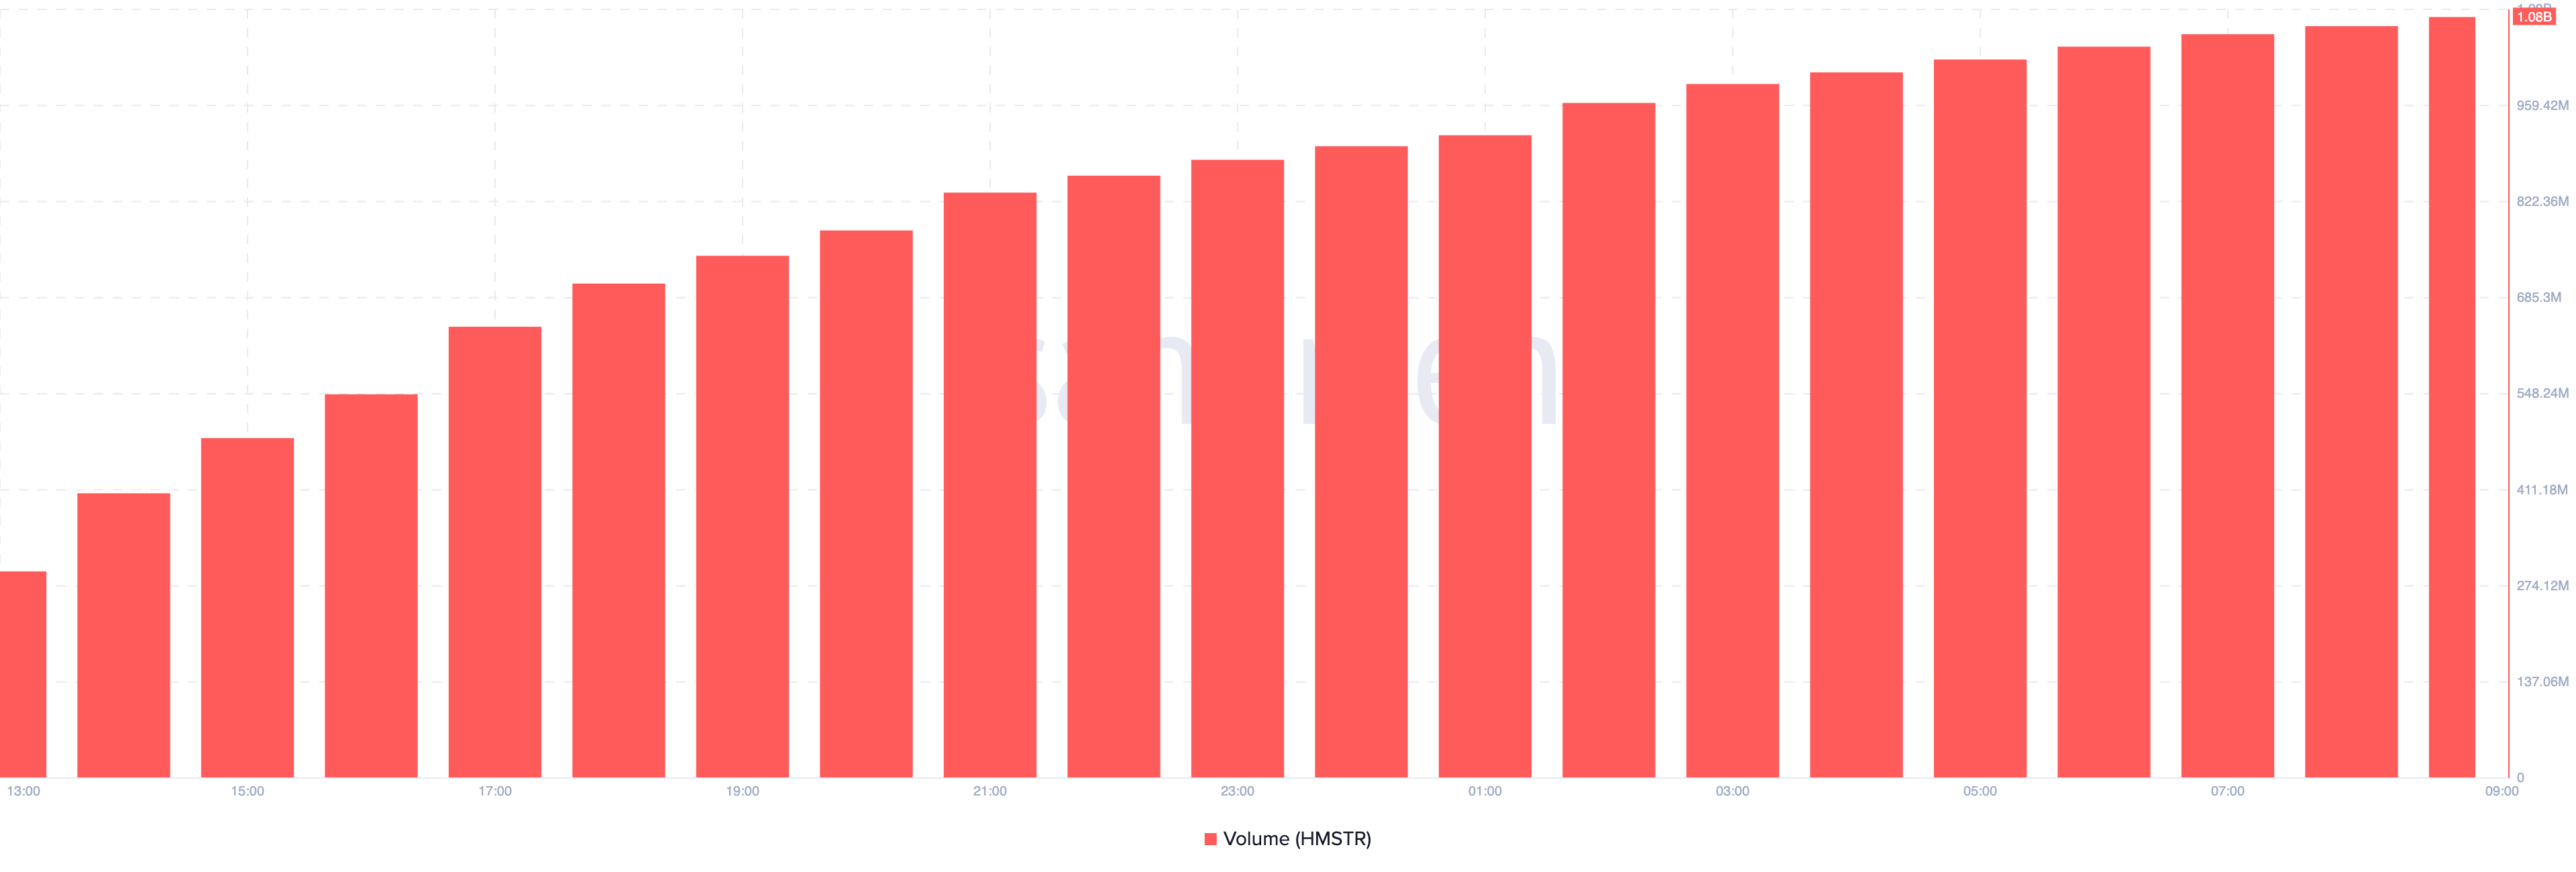
But for HMSTR, the rising volume plus the decreasing price is a bearish sign, as it indicates strength to the downward pressure on the token. If this continues, the price might continue to plunge.
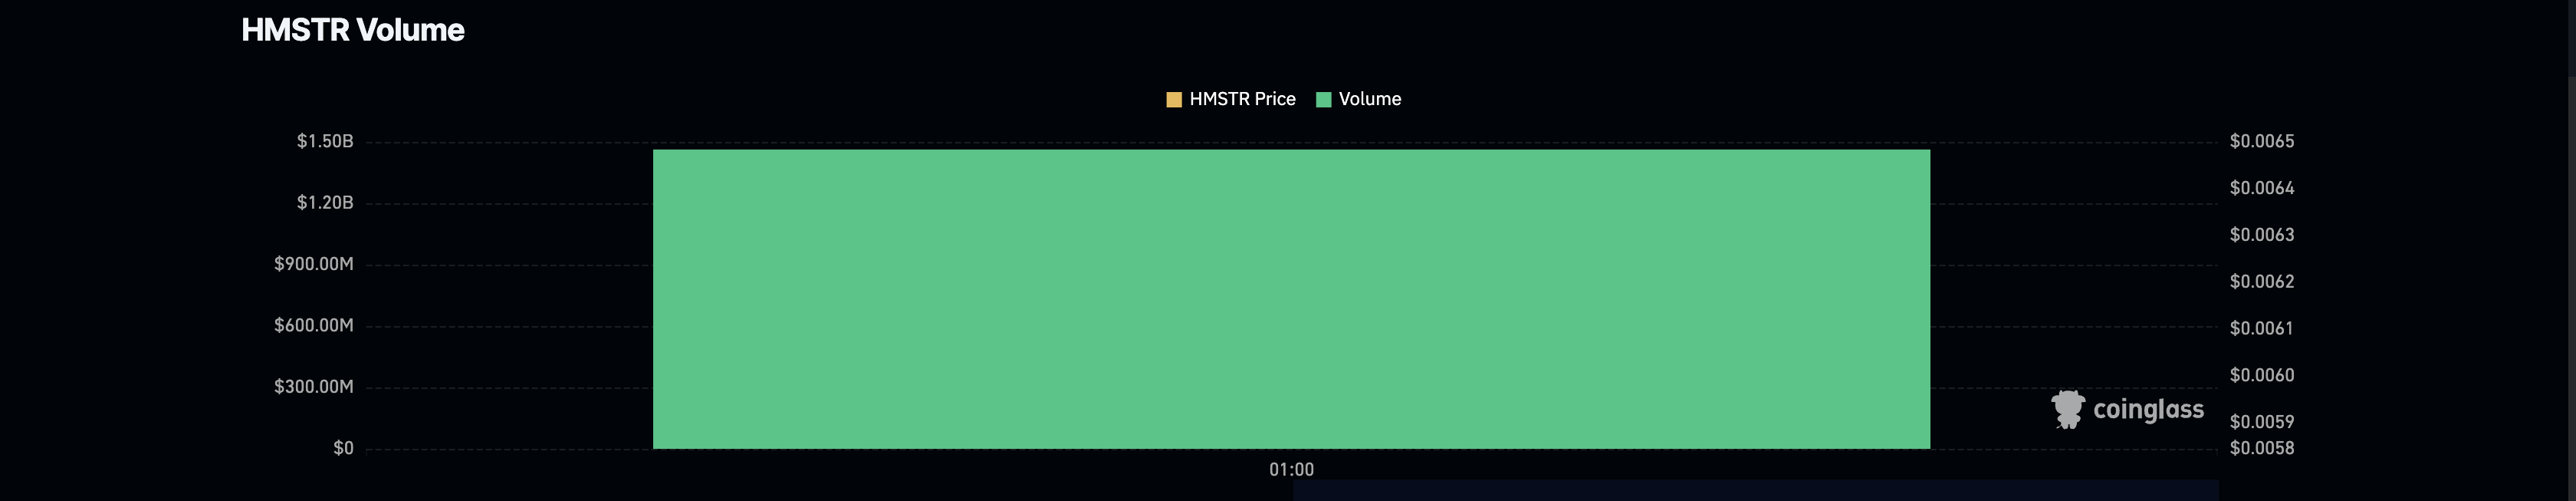
Meanwhile, data from Coinglass shows that the token experienced a surge in derivatives volume. This notable rise indicates significant speculative activity around HMSTR. However, like the spot volume, rising derivatives interest alongside falling price is a bearish signal.
Besides this, many players expressed their disappointment in the HMSTR airdrop, which some said offered an average of $8. However, this outcome wasn’t surprising. Despite Hamster Kombat banning 2.3 million players from eligibility before the airdrop, the sheer number of participants remained large, diluting the rewards significantly.
HMSTR Price Prediction: Future Uncertain
While it might be too early to predict HMSTR’s price, the 5-minute chart shows that the cryptocurrency has found some stability around $0.0067 and $0.0069. Furthermore, the Relative Strength Index (RSI) hovers around the neutral 50.00 signal line.
This implies that the momentum around the Hamster token is relatively neutral. As such, the price might move in a seesaw manner in the short term. Should this be the case, the next level for HMSTR to reach could be around $0.0065.
Read more: Top 8 Hamster Kombat Alternatives in 2024
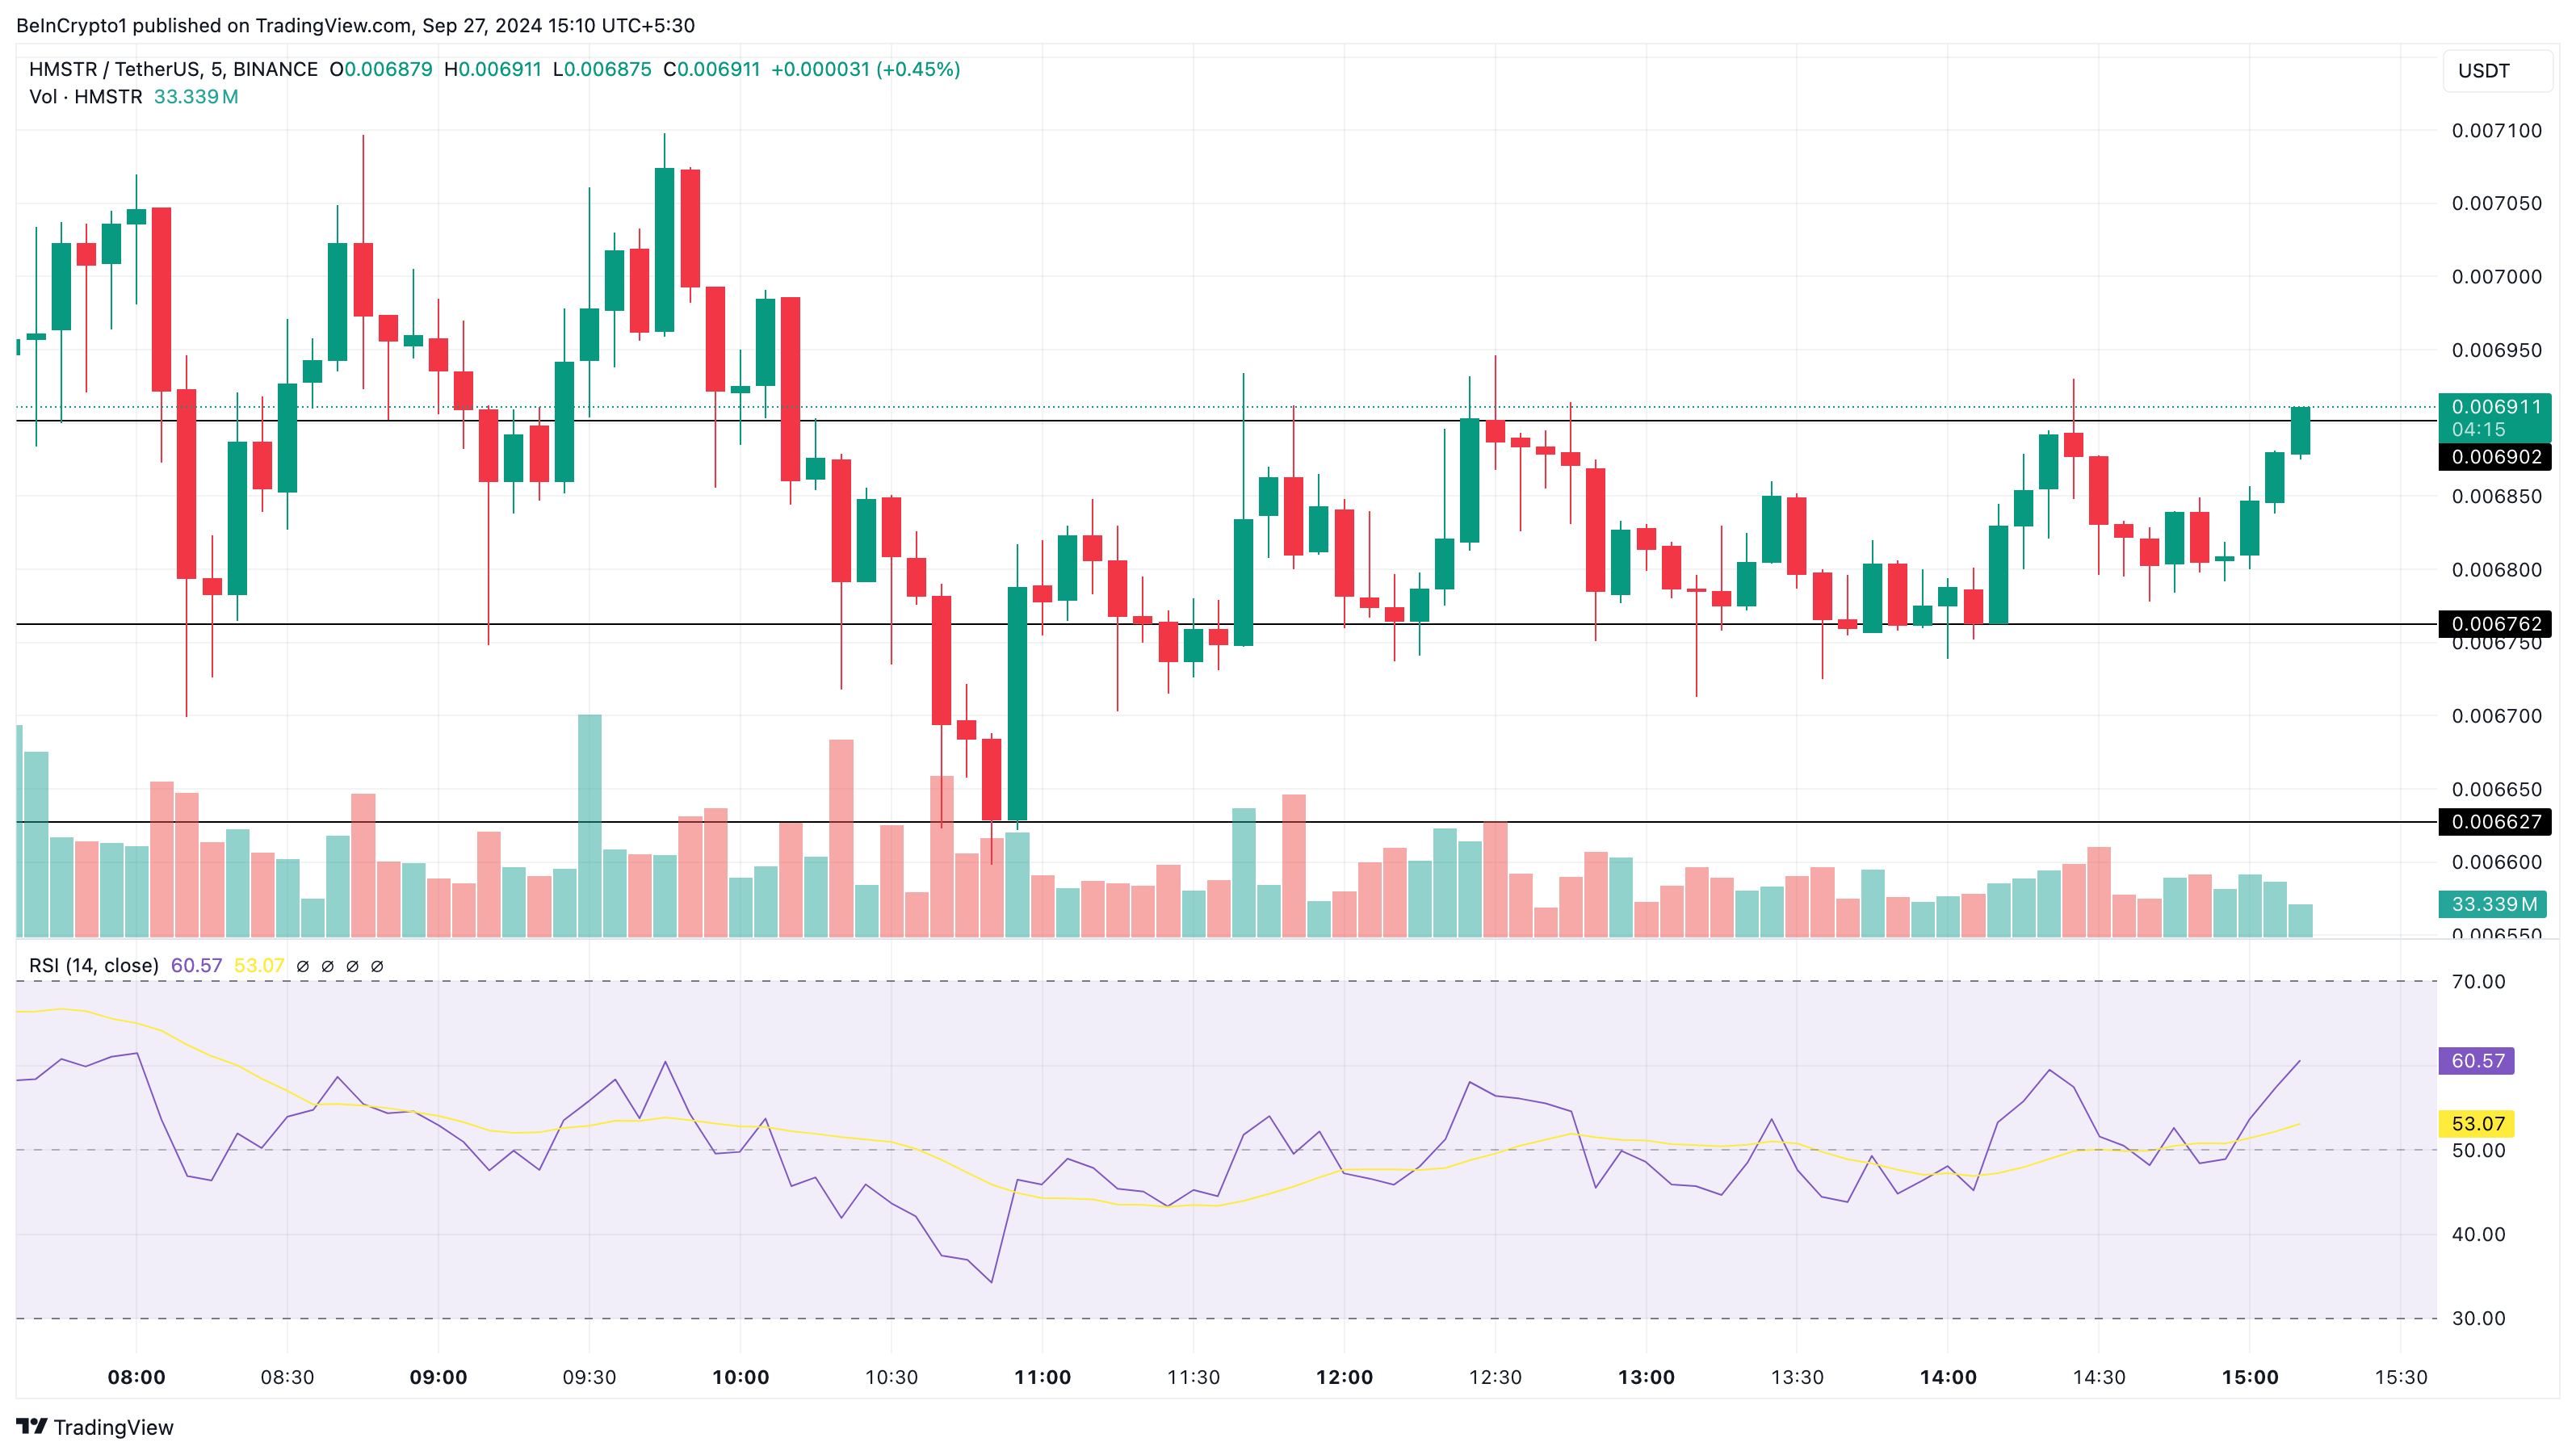
However, HMSTR’s price might experience a notable rebound if the selling pressure eases. Should buying pressure appear during this period, the value could jump toward $0.0080. It is also worth noting that Hamster Kombat has yet to respond to users’ displeasure as of this writing.
Disclaimer
In line with the Trust Project guidelines, this price analysis article is for informational purposes only and should not be considered financial or investment advice. BeInCrypto is committed to accurate, unbiased reporting, but market conditions are subject to change without notice. Always conduct your own research and consult with a professional before making any financial decisions. Please note that our Terms and Conditions, Privacy Policy, and Disclaimers have been updated.


Reason to trust
![]()
Strict editorial policy that focuses on accuracy, relevance, and impartiality
Created by industry experts and meticulously reviewed
The highest standards in reporting and publishing
Strict editorial policy that focuses on accuracy, relevance, and impartiality
Morbi pretium leo et nisl aliquam mollis. Quisque arcu lorem, ultricies quis pellentesque nec, ullamcorper eu odio.
Bitcoin price started a recovery wave above the $83,500 zone. BTC is now consolidating and might struggle to settle above the $85,500 zone.
- Bitcoin started a decent recovery wave above the $83,500 zone.
- The price is trading above $83,000 and the 100 hourly Simple moving average.
- There is a connecting bullish trend line forming with support at $84,500 on the hourly chart of the BTC/USD pair (data feed from Kraken).
- The pair could start another increase if it stays above the $83,500 zone.
Bitcoin Price Starts Recovery
Bitcoin price managed to stay above the $82,000 support zone. BTC formed a base and recently started a decent recovery wave above the $82,500 resistance zone.
The bulls were able to push the price above the $83,500 and $84,200 resistance levels. The price even climbed above the $85,000 resistance. A high was formed at $85,487 and the price is now consolidating gains above the 23.6% Fib retracement level of the upward move from the $81,320 swing low to the $85,487 high.
Bitcoin price is now trading above $83,500 and the 100 hourly Simple moving average. There is also a connecting bullish trend line forming with support at $84,550 on the hourly chart of the BTC/USD pair.

On the upside, immediate resistance is near the $85,200 level. The first key resistance is near the $85,500 level. The next key resistance could be $85,850. A close above the $85,850 resistance might send the price further higher. In the stated case, the price could rise and test the $86,650 resistance level. Any more gains might send the price toward the $88,000 level or even $88,500.
Another Decline In BTC?
If Bitcoin fails to rise above the $85,500 resistance zone, it could start a fresh decline. Immediate support on the downside is near the $84,500 level and the trend line. The first major support is near the $83,500 level and the 50% Fib retracement level of the upward move from the $81,320 swing low to the $85,487 high.
The next support is now near the $82,850 zone. Any more losses might send the price toward the $82,000 support in the near term. The main support sits at $80,500.
Technical indicators:
Hourly MACD – The MACD is now losing pace in the bullish zone.
Hourly RSI (Relative Strength Index) – The RSI for BTC/USD is now above the 50 level.
Major Support Levels – $84,500, followed by $83,500.
Major Resistance Levels – $85,200 and $85,500.
Reason to trust
![]()
Strict editorial policy that focuses on accuracy, relevance, and impartiality
Created by industry experts and meticulously reviewed
The highest standards in reporting and publishing
Strict editorial policy that focuses on accuracy, relevance, and impartiality
Morbi pretium leo et nisl aliquam mollis. Quisque arcu lorem, ultricies quis pellentesque nec, ullamcorper eu odio.
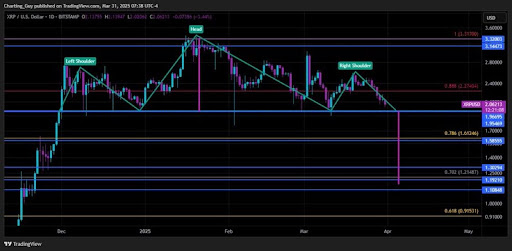
Recent XRP price action has sparked a new prediction from a crypto analyst, as a potential Head and Shoulders pattern emerges on the chart. The analyst warns that this technical formation could trigger a significant price correction for XRP, describing this downturn as the worst-case scenario.
Analyst Predicts XRP Price Crash To $1.15
The ‘Charting Guy,’ a pseudonymous crypto analyst on X (formerly Twitter), has unveiled a potential Head and Shoulder pattern formation on the XRP price chart. The analyst has shared insights into the implications of this technical pattern, projecting a potential crash in the XRP price.
Related Reading
As a well-known bearish reversal pattern, the formation of a Head and Shoulder in the XRP price chart suggests a potential shift from an uptrend to a downtrend. Typically, a Head and Shoulder pattern consists of three peaks: the Left Shoulder, Head, and Right Shoulder. However, the Charting Guy has confirmed that XRP’s current pattern formation consists of two right shoulders and one head. Due to this irregularity, the analyst has expressed doubt about the possibility of the pattern playing out.
If the Head and Shoulder pattern eventually takes shape, it could lead to a significant drop in the XRP price, potentially bringing it down to as low as $1.15. This price level aligns with a key Fibonacci Golden Pocket retracement zone between 0.618 – 0.786.
Notably, the analyst has described this projected price crash as the worst-case scenario for XRP. While he believes a bearish move is possible, the analyst is confident that XRP’s broader market structure is bullish.
Moreover, the Charting Guy argues that if XRP does decline to $1.15, it would likely serve as a healthy retracement in an overall bullish trend. He noted that XRP’s price has been holding the $2 level on daily closes, meaning its price action remains strong above support levels. This also indicates the possibility of an uptrend resumption that could yield higher highs and higher lows for XRP.
Key Support And Resistance Levels To Watch
The Charting Guy’s analysis of XRP’s potential Head and Shoulder pattern formation highlights several critical price levels to watch. Since XRP has consistently closed daily candles above $2, the analyst has determined this level as short-term support.
Related Reading
XRP has also been wicking during recent pullbacks in a crucial range between $1.7 and $1.9. As a result, the crypto analyst has revealed that he will be watching this area closely for a potential price bounce.
The Golden Pocket retracement zone, which represents the worst-case scenario for the XRP price, is between $1.15 and $1.30. If XRP experiences a deeper price correction, lower support levels have been marked from $1.19 to $0.91.
For its resistance levels, the Charting Guy has pinpointed $2.27 as a key price point. Additionally, $3.14 – $3.32 has been identified as an upper resistance range where XRP could rally if bullish momentum resumes.
Featured image from Medium, chart from Tradingview.com


Welcome to the US Morning Crypto Briefing—your essential rundown of the most important developments in crypto for the day ahead.
Grab a coffee to see how Standard Chartered sees early signs of institutional investors turning to Bitcoin as a hedge against equity market volatility, just as traders gear up for a potentially volatile week driven by tariff news. At the same time, Coinbase wraps up its worst quarter since the FTX collapse, and U.S. regulators inch closer to unified stablecoin legislation.
Standard Chartered Sees Signs of Bitcoin Starting to Be Used as Hedge Against Market Volatility
Geoff Kendrick, Head of Digital Assets Research at Standard Chartered, sees signs that institutional traders are starting to use Bitcoin as a hedge against equity market volatility.
In a recent exclusive interview with BeInCrypto, Kendrick highlighted that this trend is already underway, with investors seeking alternatives to traditional instruments. “This is happening already,” Kendrick stated. “Investors used to use FX, specifically AUD, for this purpose due to its highly liquid and positive correlation to stocks, but now I think Bitcoin is being used because it is also highly liquid and trades 24/7.”
Additionally, in an investor note from late March, Kendrick expanded on Bitcoin’s evolving role in investment portfolios, suggesting that over time, Bitcoin may serve multiple purposes—both as a hedge against traditional financial market fluctuations and as a proxy for tech stocks.
He pointed out signs that markets could anticipating a less severe tariff announcement from the U.S. on April 2. “Given this has been the worst quarter for the Nasdaq since Q2 2022, there should be a degree of portfolio rebalancing (buying) that needs to take place,” Kendrick added.
As of April 1, 2025, Bitcoin has shown resilience amid broader market uncertainties. The cryptocurrency is up approximately 3.32%, trading at $84,282. This uptick comes alongside an overall increase in the global cryptocurrency market capitalization. In contrast, U.S. stock futures, including Dow Futures, S&P 500 Futures, and Nasdaq Futures, are all trending lower in pre-market trading, reflecting investor caution ahead of the anticipated tariff announcements.
Bitcoin Options Heat Up Before Trump’s “Liberation Day”
FalconXCrypto Global Co-Head of Markets, Joshua Lim, noted that in anticipation of Wednesday’s Trump-tariff “Liberation Day,” crypto funds are actively purchasing Bitcoin options at two key strike prices: $75,000 on the downside to hedge against potential losses and $90,000 on the upside to capitalize on a price surge.
Lim highlighted that the options market is pricing in a potential 4% move in Bitcoin’s price during the event. “The implied event move embedded in Bitcoin options is around 4% for the 2 April event,” he told BeInCrypto.
He also pointed out that traders are likely to keep buying put options in the short term as a protective measure, maintaining a high options cost premium. “We believe the front of the options curve will hold its premium as traders continue to hedge their portfolios or replace spot positions with limited-loss option positions,” Lim added.
Additionally, he noted a 4-point increase in the VIX, signaling that investors expect heightened volatility in the coming days and are turning to options to manage risk or capitalize on price swings. “US equities are also showing a bid in options, with the front-month VIX up 4 points to 22v from last week,” he said.
Crypto Stocks Slide: Coinbase Suffers Worst Quarter Since FTX Collapse
Coinbase is closing out its roughest quarter since the FTX collapse, with its stock tumbling over 30% since January. While it dipped nearly 1% in early U.S. pre-market trading on Monday, the stock managed to claw back losses and is now up around 1%.
Other crypto-linked companies are also feeling the pressure. Galaxy Digital Holdings has dropped over 8% in pre-market trading, while mining firms Riot Platforms and Core Scientific are only barely staying afloat, each gaining less than 0.5%.
Meanwhile, CoreWeave, which pivoted from Bitcoin mining to AI infrastructure, is struggling after a disappointing IPO. Initially aiming for a $2.7 billion raise, the company had to settle for $1.5 billion, slashing its offer price from the $47–55 range to $40 per share. Since going public last Friday, its shares are down 6.8%, with a 7.3% drop recorded in the last 24 hours.
Byte-Sized Alpha
– Today’s JOLTS report, a key gauge of U.S. job openings, could sway Bitcoin—strong data may boost the dollar and hurt crypto, while a sharp decline could fuel rate-cut hopes and lift risk assets.
– Bitcoin is off to its worst quarterly start since 2018, dropping nearly 12% in Q1 2025—but growing whale accumulation, falling exchange supply, and signs of consolidation hint at a potential rebound ahead.
– Crypto scams are on the rise, with fake Gemini bankruptcy emails and a Coinbase employee breach fueling phishing attacks
– OKX has appointed former NYDFS Superintendent Linda Lacewell as Chief Legal Officer, a move aimed at bolstering its regulatory credibility as the exchange accelerates global expansion into regions like Europe and the UAE.
– A unified U.S. stablecoin regulation could soon become reality, as the STABLE and GENIUS Acts differ by only 20% and enjoy strong bipartisan support alongside SEC and CFTC involvement.
– A push for expanded crypto oversight is underway as incoming CFTC Chair Brian Quintenz meets with Senator Chuck Grassley to discuss regulating the crypto spot market.
Disclaimer
In line with the Trust Project guidelines, this price analysis article is for informational purposes only and should not be considered financial or investment advice. BeInCrypto is committed to accurate, unbiased reporting, but market conditions are subject to change without notice. Always conduct your own research and consult with a professional before making any financial decisions. Please note that our Terms and Conditions, Privacy Policy, and Disclaimers have been updated.

Bitcoin Price Bounces Back—Can It Finally Break Resistance?

Analyst Reveals ‘Worst Case Scenario’ With Head And Shoulders Formation

BeInCrypto US Morning Briefing: Standard Chartered and Bitcoin
SUI Price Stalls After Major $147 Million Token Unlock

Bitcoin Could Serve as Inflation Hedge or Tech Stock, Say Experts

Circle Files for IPO

2.52 Million Altcoins Are Ruining Crypto’s Future

Animoca Brands Valuation Tanks 75% In Two Years, Here’s Why

Crypto exchange BingX hacked for $43 million

Are The Big Players Losing Interest?

Hong Kong’s Securities Association Tips Authorities On Crypto Self-Regulation

Coinbase cbBTC Set to go Live on Solana
2.52 Million Altcoins Are Ruining Crypto’s Future
Animoca Brands Valuation Tanks 75% In Two Years, Here’s Why
Crypto exchange BingX hacked for $43 million
Are The Big Players Losing Interest?
Hong Kong’s Securities Association Tips Authorities On Crypto Self-Regulation
Coinbase cbBTC Set to go Live on Solana
-

 Market22 hours ago
CFTC’s Crypto Market Overhaul Under New Chair Brian Quintenz
-

 Market18 hours ago
Bitcoin Price Battles Key Hurdles—Is a Breakout Still Possible?
-

 Market24 hours ago
Ethereum Price Faces a Tough Test—Can It Clear the Hurdle?
-

 Bitcoin16 hours ago
$500 Trillion Bitcoin? Saylor’s Bold Prediction Shakes the Market!
-
 Market23 hours ago
Solana (SOL) Holds Steady After Decline—Breakout or More Downside?
-

 Ethereum22 hours ago
$2,300 Emerges As The Most Crucial Resistance
-
 Altcoin14 hours ago
Will XRP, SOL, ADA Make the List?
-
 Altcoin21 hours ago
A Make or Break Situation As Ripple Crypto Flirts Around $2