
Ethereum
Crypto Analyst Predicts What Will Drive The Ethereum Price Back Above $3,000 Again

Ethereum, the second-largest cryptocurrency by market capitalization, has yet to reclaim the $3,000 price level since early August. Since the beginning of September, Ethereum has mostly traded below $2,600, but this week brought a glimmer of hope for investors as it finally managed to break above the $2,600 threshold.
Now that this resistance threshold has been broken, the next outlook is a continued surge up until the $3,000 price level. An analysis on the CryptoQuant platform points to a potential catalyst for this move to the upside. Notably, this analysis identifies an emerging bullish trend in Ethereum’s funding rates as a critical catalyst.
Bullish Shift In Funding Rates
According to an ETH analysis on CryptoQuant by ShayanBTC, Ethereum’s 30-day moving average of funding rates has seen a slight but noticeable bullish shift after an extended period of decline. This change suggests that traders are once again becoming more confident in Ethereum’s price performance, particularly after the recent Fed interest rate cut.
ETH Funding rates refer to the periodic payments made between traders to maintain the price of perpetual futures contracts near the spot price of the cryptocurrency. When the funding rates shift positively, it often indicates that long positions are more dominant, which can create upward price pressure.
The importance of the funding rates was emphasized by the analyst, especially considering the prospect of a bullish fourth quarter of the year. Notably, they echoed that for Ethereum to continue its recovery and target higher price levels, the demand in the perpetual futures market must keep rising in the coming weeks. A small decline in the funding rates could cascade into a fall in bullish momentum.
Ethereum Staging A Return To $3,000?
Ethereum’s recent breakout above $2,600 is the first signal of a major shift in market sentiment. After weeks of trading below, the $2,600 price level seems to have now become an essential support zone for the cryptocurrency. Interestingly, this breakout sets the stage for the return of ETH to $3,000, with the funding rates playing an essential part.
At the time of writing, Ethereum is trading at $2,610 and is up by 8% in the past seven days. Notably, this price increase is more noticeable from a low of $2,171 on September 6, reflecting a 20% increase since then.
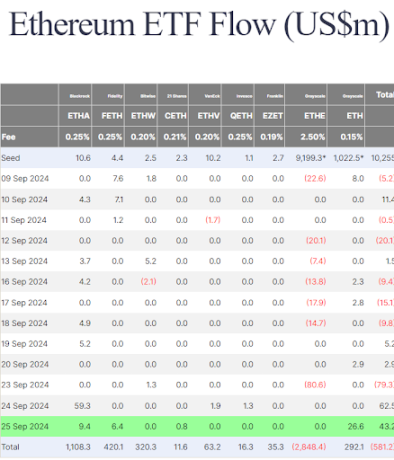
The positive sentiment surrounding Ethereum is also moving towards institutional investors, which is reflected through Spot Ethereum ETFs. According to flow data, the ETFs, which initially started the week with a net outflow of $79.3 million on Monday, have now witnessed two consecutive days of $62.5 million and $43.2 million, respectively, on Tuesday and Wednesday. The combination of these inflows could play a significant role in whether Ethereum can breach the $3,000 price level and sustain above in the coming weeks.
Featured image created with Dall.E, chart from Tradingview.com


On-chain data shows that Ethereum transaction fees have been rising again recently. Here’s what could be behind this trend.
Ethereum Average Fees Has Registered A Notable Uptick Recently
In a new insight post, the on-chain analytics firm Santiment talked about how the Ethereum network has recently become more expensive. The metric of interest here is the “Average Fees,” which keeps track of the average fees that ETH users are currently attaching with their transfers.
How much fees senders might be willing to pay comes down to the activity level the blockchain is witnessing. In times of high traffic, transfers can get stuck for a while, as ETH has only a limited capacity to handle transactions. Those looking to beat the crowd, thus, go with a higher-than-average fee.
This user competition is what governs how high the average would get. With little activity on the network, senders will go for the cheapest amount possible, as there isn’t much incentive to pay a high fee.
Now, here is a chart that shows the trend in the Ethereum Average Fees over the last few months:

Looks like the value of the metric has been heading up in recent days | Source: Santiment
As is visible above, the Ethereum Average Fee has been climbing recently and currently sits at $3.2, the highest level since early August. However, this previous spike in August, although great in scale, had lasted very briefly.
From the chart, it’s visible that this previous spike had coincided with the crash that the cryptocurrency had observed around then. Thus, the fee surge was because the investors had been making panic moves and were willing to pay high to get them done fast.
Before this spike, the last time a sustained trend in fees similar to the recent one had been observed was in late May. As such, the latest value of the metric has effectively been the highest point in four months.
Now, as for what’s behind this latest trend, an obvious reason would seem like the rally the asset has recently enjoyed. Sharp price action attracts attention, so the Average Fees generally go up.
However, details of the fee breakdown reveal that the normal Ethereum traders may not drive the increase.

The distribution of the ETH fees over the past week | Source: Santiment
As it turns out, Wrapped Ethereum (WETH) has recently been the token providing the largest contribution to network fees. As Santiment notes:
The dominance of WETH in fee contributions indicates that traders are heavily utilizing DeFi platforms, likely engaging in liquidity pools, trading, and other financial activities that require WETH as a base asset.
ETH Price
At the time of writing, Ethereum is floating around $2,700, up 5% over the last seven days.
The price of the coin seems to have been consolidating over the last few days | Source: ETHUSDT on TradingView
Featured image from Dall-E, Santiment.net, chart from TradingView.com

The market sentiment towards Ethereum (ETH) has turned relatively bearish, largely due to the cryptocurrency’s recent price volatility. This negative sentiment is evident in Ethereum’s new active addresses, having crashed by a whopping 43%, underscoring reduced network activity and investor confidence.
New Active Addresses On Ethereum Decline
Data from The Block is showing notable fluctuations in Ethereum’s network activity, as the number of new active addresses has seen a sharp unexpected decline over the past three months.
On June 27, new active addresses on the Ethereum network surged to 138,620 before dropping drastically to around 89,000 in the first few weeks of July. While the volume fluctuated between 80,000 and 95,000 in August, it soon jumped back above 100,000 at the end of the month.
Related Reading
Despite Ethereum experiencing a significant uptick in its price recently, the new active addresses on its network dropped as low as 78,100 on September 24, marking a 23.43% crash. Currently, the number of new active addresses on Ethereum’s network is still below 80,000, reflecting more than a 44% crash from the last three months.
Compared to June 9 when the total active addresses on the Ethereum network surged impressively to 702,857, the current number of addresses has declined by 5.69%. Moreover, on September 22, the total active address count fell drastically to 574,073, underscoring an 18.32% decrease from the previous June 9 high.
Typically, when a crypto network experiences a drop in its new active address count, it indicates a decrease in user engagement, leading to a decline in the overall network activity and transaction volume. This decrease can be seen in the data provided by IntoTheBlock, which shows that the total volume of large transactions on the Ethereum network rose to 2.91 million on July 5, but declined to 1.79 million on September 29, reflecting a 38.4% drop.
Despite the significant drop in new active addresses on Ethereum, market intelligence platform, Santiment has disclosed that the Ethereum network activity is finally picking up. However, this rise in network activity also coincides with a significant increase in gas fee levels.
ETH Loses Top Spot In DEX Volume Rankings
On September 25, Ethereum lost its position as the top cryptocurrency with the highest 24-hours Decentralized Exchange (DEX) volume. Solana (SOL) had outperformed Ethereum, claiming the top spot with a 39.77% increase in its DEX volume, which climbed to $1.123 billion.
Related Reading
At the time, Ethereum’s DEX volume was approximately $1.118 billion after recording a modest 8.92% surge. While Solana briefly stole the spotlight, Ethereum swiftly rebounded and has since held on to its leading position.
As of writing, the cryptocurrency’s 24-hour DEX volume has surged by 11%, reaching $1.559 billion, according to DeFiLama. In contrast, Solana experienced a much larger increase of 32.94%, however, its volume still sits below Ethereum’s at $1.251 billion.
Featured image created with Dall.E, chart from Tradingview.com

Hong Kong regulators are reportedly close to approving staking features for spot Ethereum exchange-traded funds (ETFs). This development comes as the region continues its efforts to establish itself as a crypto hub.
Andrew Vranjes, Blockdaemon’s Head of International and Vice President, recently spoke on this potential approval during an interview at Token2049 in Singapore.
Vranjes revealed that Blockdaemon has been actively working with spot crypto ETF issuers in Hong Kong to devise staking solutions that align with regulatory requirements.
Progress In Ethereum Spot ETFs In Hong Kong
Vranjes expressed optimism about the progress, indicating that regulators might allow staking within specific guidelines. He hinted that the initial approval might be limited to certain investor categories, such as accredited investors, before potentially expanding to a broader market.
“We’re positive because of the level of conversation,” Vranjes stated, pointing out that the discussions between Blockdaemon, ETF issuers, and regulators are ongoing, involving detailed documentation and regulatory scrutiny.
Vranjes particularly revealed that Blockdaemon is deeply engaged in discussions with clients and regulators, exchanging comprehensive documents to ensure that the proposed staking solutions meet regulatory standards.
He suggested that an official announcement regarding Ethereum staking for spot ETFs in Hong Kong could be imminent, emphasizing that the current phase involves meticulous planning and compliance checks.
“We’re in that sort of fine-grained kind of motion. I think we’re closer to the announcement than further away at this stage,” Vranjes noted.
ETH Spot ETF Performance So Far
Hong Kong’s spot crypto ETF flows lag significantly behind those in the US. For instance, the combined trading volume of the three spot Ethereum ETFs in Hong Kong stood at $30,740 as of Tuesday (September 17), with no daily flows recorded.
In contrast, nine ETH ETFs in the US saw a combined trading volume of $176.26 million and net daily outflows of $15.11 million on the same day, according to SosoValue data.
📊 Ethereum ETF Tracker | 2024-09-17
🟥 Daily Total Net Inflow -$15.11M
💰 Total Value Traded $176.26M
🏦 Total Net Assets $6.41B
📊 ETF Market Value Ratio 2.27%🥇 Net Inflows/Outflows for Each ETF
🟩 ETH +$2.77M
⬜️ ETHW $0
⬜️ ETHA $0
⬜️ ETHV $0
⬜️ CETH $0
⬜️ QETH… pic.twitter.com/IXlCkAr2HI— SoSoValue Research (@SoSoValue) September 18, 2024
Vranjes suggested that Hong Kong could potentially approve Ethereum staking for ETFs before the US, noting that would not surprise him.
If Hong Kong successfully rolls out Ethereum staking for spot ETFs, it could set a precedent, potentially influencing other markets.
The US, which currently has higher trading volumes in crypto ETFs, could face pressure to adopt similar measures. The move could also boost Ethereum’s position in the global market, offering investors additional ways to generate returns.
Featured image created with DALL-E, Chart from TradingView

Is a $1,000 XRP Price Possible? Here’s What Experts Say

Here Are the Five Best Crypto Traders to Follow in October 2024

Which Altcoins Can Outperform Bitcoin in October 2024?

Dubai’s New Ads Rule and More

Bitcoin Correlation With S&P 500 Hits 2-Year High – What This Means For Investors
Wallet Phishing Scam Costs $32 Million: Inferno Drainer Linked

2.52 Million Altcoins Are Ruining Crypto’s Future

Animoca Brands Valuation Tanks 75% In Two Years, Here’s Why

Crypto exchange BingX hacked for $43 million

Are The Big Players Losing Interest?

Coinbase cbBTC Set to go Live on Solana

Hong Kong’s Securities Association Tips Authorities On Crypto Self-Regulation
2.52 Million Altcoins Are Ruining Crypto’s Future
Animoca Brands Valuation Tanks 75% In Two Years, Here’s Why
Crypto exchange BingX hacked for $43 million
Are The Big Players Losing Interest?
Coinbase cbBTC Set to go Live on Solana
Hong Kong’s Securities Association Tips Authorities On Crypto Self-Regulation
-
 Altcoin3 months ago
2.52 Million Altcoins Are Ruining Crypto’s Future
-
 NFT2 months ago
Animoca Brands Valuation Tanks 75% In Two Years, Here’s Why
-
 Ethereum1 week ago
Crypto exchange BingX hacked for $43 million
-
 Ethereum1 week ago
Are The Big Players Losing Interest?
-
 Bitcoin6 days ago
Coinbase cbBTC Set to go Live on Solana
-
 Blockchain5 months ago
Hong Kong’s Securities Association Tips Authorities On Crypto Self-Regulation
-

 NFT4 months ago
BLUR Is Down 30%, And Whales Are To Blame–Here’s Why
-

 NFT4 months ago
New And Upcoming NFT Projects