
Ethereum
Diamond Hand Ethereum Whale Moves 15,000 ETH, Here’s The Destination

A “Diamond Hand” Ethereum (ETH) whale has suddenly emerged, transferring a massive 15,000 ETH token to a major exchange. Given the sheer size of the transaction, this whale has caught the attention of many Ethereum investors and the broader crypto community.
Diamond Hand Whale Moves 15,000 ETH Tokens
Spot On Chain, a blockchain analytics platform, revealed on September 22 in an X (formerly Twitter) post that an anonymous Diamond hand whale had transferred 15,000 ETH valued at $38.4 million from their wallet address “0x682” to Kraken, one of the world’s biggest crypto exchanges.
Related Reading
A Diamond hand whale is a term essentially used to describe traders or investors who HODL their coins, stocks, bonds, silver or bonds for an extensive period without plans to sell, no matter how much the value of the token changes or the market fluctuates.
Data from Spot On Chain has revealed that this anonymous Diamond whale had initially conducted two ETH deposits into Kraken, both exceeding $30 million. Coincidentally, these two transactions occurred just before the price of Ethereum experienced a decline.
The first transaction saw the whale move 10,000 ETH tokens, worth about $34.2 million to Kraken on July 25, just before the price of Ethereum fell by 7.6%. In the second transaction which occurred on August 20, the diamond hand whale deposited 15,000 ETH, valued at $39.7 million at the time. This substantial ETH transaction had occurred just before a 2.5% decrease in Ethereum’s price.
Following this trend, it appears that this particular whale’s ETH deposits may have been carefully calculated and strategic, executing transactions just before a price decrease to avoid a loss. Moreover, the whale’s actions could offer valuable insights, potentially signaling an impending decline in the price of Ethereum.
Currently, the diamond hand whale holds 26,639 ETH tokens, worth approximately $69.7 million, with an estimated total profit of $132 million. This massive profit represents an impressive gain of over 86%.
Update On Ethereum Price Analysis
The price of Ethereum has been relatively stable in recent weeks, experiencing modest gains after ensuring an extensive period of significant bearish activity. According to CoinMarketCap’s data, ETH is trading at $2,640, reflecting a 1.93% increase in the last week and an impressive 13.43% surge over the past seven days.
Related Reading
Notably, Ethereum’s bullish momentum has sparked optimism amongst analysts. A prominent crypto analyst identified as ‘Crypto Patel’ on X has set ambitious price targets for Ethereum, predicting that the cryptocurrency could witness a surge between $5,500 to $6,000.
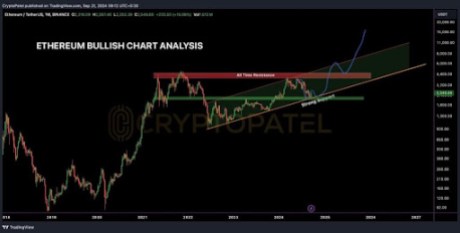
He identified the best accumulation zone for investors as between $2,500 to $2,100. Furthermore, the analyst shared his long-term target for ETH, forecasting that the cryptocurrency could experience a price breakout from $8,000 to $10,000.
Featured image created with Dall.E, chart from Tradingview.com


Meet Samuel Edyme, Nickname – HIM-buktu. A web3 content writer, journalist, and aspiring trader, Edyme is as versatile as they come. With a knack for words and a nose for trends, he has penned pieces for numerous industry player, including AMBCrypto, Blockchain.News, and Blockchain Reporter, among others.
Edyme’s foray into the crypto universe is nothing short of cinematic. His journey began not with a triumphant investment, but with a scam. Yes, a Ponzi scheme that used crypto as payment roped him in. Rather than retreating, he emerged wiser and more determined, channeling his experience into over three years of insightful market analysis.
Before becoming the voice of reason in the crypto space, Edyme was the quintessential crypto degen. He aped into anything that promised a quick buck, anything ape-able, learning the ropes the hard way. These hands-on experience through major market events—like the Terra Luna crash, the wave of bankruptcies in crypto firms, the notorious FTX collapse, and even CZ’s arrest—has honed his keen sense of market dynamics.
When he isn’t crafting engaging crypto content, you’ll find Edyme backtesting charts, studying both forex and synthetic indices. His dedication to mastering the art of trading is as relentless as his pursuit of the next big story. Away from his screens, he can be found in the gym, airpods in, working out and listening to his favorite artist, NF. Or maybe he’s catching some Z’s or scrolling through Elon Musk’s very own X platform—(oops, another screen activity, my bad…)
Well, being an introvert, Edyme thrives in the digital realm, preferring online interaction over offline encounters—(don’t judge, that’s just how he is built). His determination is quite unwavering to be honest, and he embodies the philosophy of continuous improvement, or “kaizen,” striving to be 1% better every day. His mantras, “God knows best” and “Everything is still on track,” reflect his resilient outlook and how he lives his life.
In a nutshell, Samuel Edyme was born efficient, driven by ambition, and perhaps a touch fierce. He’s neither artistic nor unrealistic, and certainly not chauvinistic. Think of him as Bruce Willis in a train wreck—unflappable. Edyme is like trading in your car for a jet—bold. He’s the guy who’d ask his boss for a pay cut just to prove a point—(uhhh…). He is like watching your kid take his first steps. Imagine Bill Gates struggling with rent—okay, maybe that’s a stretch, but you get the idea, yeah. Unbelievable? Yes. Inconceivable? Perhaps.
Edyme sees himself as a fairly reasonable guy, albeit a bit stubborn. Normal to you is not to him. He is not the one to take the easy road, and why would he? That’s just not the way he roll. He has these favorite lyrics from NF’s “Clouds” that resonate deeply with him: “What you think’s probably unfeasible, I’ve done already a hundredfold.”
PS—Edyme is HIM. HIM-buktu. Him-mulation. Him-Kardashian. Himon and Pumba. He even had his DNA tested, and guess what? He’s 100% Him-alayan. Screw it, he ate the opp.

The Ethereum price has been consolidating for about a week since it hit a four-month high at $3,420. As the second largest cryptocurrency, Ethereum has the biggest price correlation with Bitcoin. However, you could argue the Ethereum price has been largely left behind in terms of performance throughout the ongoing bull cycle. Interestingly, a crypto analyst, Ben Lilly, has shared a bold prediction about the trajectory of the Ethereum price.
Taking to a post on the social media platform X, Ben Lilly forecasted that the Ethereum price will reach a new all-time high (ATH) between December 21, 2024, and January 7, 2025. The prediction stems from his analysis of the previous performance of the ETH price movements during Bitcoin’s ATH discovery phase in 2021.
A Historical Parallel: Ethereum’s 2021 Rally
In his analysis, Ben Lilly referenced Ethereum’s price behavior during the historic rally of the Bitcoin price in the 2021 bull run. At the time, the Ethereum price was trading nearly 60% below its 2018 peak. After Bitcoin broke out to fresh ATH levels, it took Ethereum five weeks to follow suit, rallying by about 640% to reach its current ATH of $4,878.
Related Reading
Lilly believes the present market conditions mirror those of 2021, with the Bitcoin price recently entering price discovery mode. Ethereum, which was approximately 50% below its 2021 peak of $4,418 as of November 2024, has started to rebound, showing over 20% gains within just two weeks from a low of $2,366 on November 4.
Interestingly, the analyst’s comments suggest that as the Bitcoin price continues to set new price records this bull run, Ethereum is likely to follow with a substantial price leap very soon. The timeframe for this substantial price leap, he projects, aligns closely with late December 2024 and early January 2025.
Based on his projections, the analyst asserts that Ethereum could repeat its historical pattern and rally significantly within a short timeframe. He highlights that a 300% surge from Ethereum’s November 4 low price level could push it toward the $10,000 mark.
ETH will form a new ATH between Dec 21-Jan7.
I don’t make the rules. pic.twitter.com/NVgVdQ8Bsj
— Ben Lilly (@MrBenLilly) November 20, 2024
Current State Of The Ethereum Price
Ben Lilly’s Ethereum price prediction highlights the importance of the Bitcoin price momentum to that of the second-largest asset. Particularly, the 2021 pattern he pointed to is a result of an altcoin season where the altcoin market (led by Ethereum) started to outperform the Bitcoin price.
Related Reading
As it stands, an altcoin season has yet to materialize this cycle, and all the interest is going into Bitcoin. The Bitcoin price is currently on an all-time high roll, meaning the market will have to continue to wait for the interest to roll into Ethereum.
At the time of writing, the ETH price is trading at $3,107 and is down by 3.84% in the past seven days.
Featured image created with Dall.E, chart from Tradingview.com

Data shows the Ethereum derivatives-related metrics have shot up recently, a sign that the price is at risk of going through a volatile storm.
Ethereum Open Interest & Leverage Ratio Have Both Spiked Recently
In a CryptoQuant Quicktake post, an analyst has discussed about the trend in the derivatives indicators of Ethereum. The metrics in question are the Open Interest and the Estimated Leverage Ratio.
First, the Open Interest keeps track of the total amount of ETH-related contracts that are currently open on all derivatives platforms. The metric naturally takes into account for both long and short positions.
When the value of this metric rises, it means the investors are opening up fresh positions on the market. Such a trend suggests derivatives trading interest in the coin is going up.
On the other hand, the indicator registering a drawdown implies positions in the market are going down. This could be because of investors willfully closing them up, or due to exchanges forcibly liquidating them.
Now, here is a chart that shows the trend in the Ethereum Open Interest over the last few years:

The value of the metric appears to have been shooting up in recent days | Source: CryptoQuant
The above graph shows that the Ethereum Open Interest has witnessed rapid growth recently. It has surpassed the previous all-time high (ATH) to set a new record above $13 billion.
When considering the timeframe of the past four months, the indicator has increased by over 40%, which suggests an explosion in speculative interest around the cryptocurrency has occurred.
This development, however, may not be the healthiest, as the trend in the second indicator of relevance, the Estimated Leverage Ratio, would suggest. This metric measures the ratio between the Open Interest and the Derivatives Exchange Reserve.
The Derivatives Exchange Reserve is naturally just the total amount of the cryptocurrency sitting in wallets associated with all centralized derivatives exchanges.
The Estimated Leverage Ratio tells us the amount of leverage or loan that the average derivatives user in the Ethereum market is currently opting for.
Below is a chart for this indicator.

Looks like the value of the metric has been heading up over the last few weeks | Source: CryptoQuant
From the graph, it’s apparent that the Ethereum Estimated Leverage Ratio has shot up recently. This would mean that the increase in the Open Interest has been more rapid than the rise in the Derivatives Exchange Reserve.
The investors are now sitting on all-time high (ATH) leverage, which can be a bad sign for ETH as it implies any volatility in the future could take down the overleveraged positions and induce a mass liquidation event called a squeeze.
The quant has pointed out that the Ethereum Funding Rate, a ratio between long and short positions, is positive right now, which suggests that if a squeeze is to happen shortly, it’s more likely to involve the bullish side of the market.
ETH Price
At the time of writing, Ethereum is floating around $3,000, down almost 7% over the past week.
The price of the coin seems to have been consolidating sideways recently | Source: ETHUSDT on TradingView
Featured image from Dall-E, CryptoQuant.com, chart from TradingView.com

BTC Surges to $99K, ETH Shoots, XRP Jumps 25%

Rallies 10% and Targets More Upside
Rallies 10% and Targets More Upside

“Crypto Dad” Chris Giancarlo Emerges Top For White House Crypto Czar Role
Dogecoin Code Appears In CyberTruck And Model 3 Website, Will Tesla Accept DOGE Payments For Cars Soon?

GOAT Price Sees Slower Growth After Reaching $1B Market Cap

2.52 Million Altcoins Are Ruining Crypto’s Future

Animoca Brands Valuation Tanks 75% In Two Years, Here’s Why

Crypto exchange BingX hacked for $43 million

Are The Big Players Losing Interest?

Hong Kong’s Securities Association Tips Authorities On Crypto Self-Regulation

Coinbase cbBTC Set to go Live on Solana
2.52 Million Altcoins Are Ruining Crypto’s Future
Animoca Brands Valuation Tanks 75% In Two Years, Here’s Why
Crypto exchange BingX hacked for $43 million
Are The Big Players Losing Interest?
Hong Kong’s Securities Association Tips Authorities On Crypto Self-Regulation
Coinbase cbBTC Set to go Live on Solana
-

 Ethereum21 hours ago
Fundraising platform JustGiving accepts over 60 cryptocurrencies including Bitcoin, Ethereum
-

 Market18 hours ago
South Korea Unveils North Korea’s Role in Upbit Hack
-

 Market22 hours ago
Cardano’s Hoskinson Wants Brian Armstrong for US Crypto-Czar
-
 Altcoin16 hours ago
Sui Network Back Online After 2-Hour Outage, Price Slips
-

 Market21 hours ago
Litecoin (LTC) at a Crossroads: Can It Rebound and Rally?
-
 Altcoin15 hours ago
Dogecoin Whale Accumulation Sparks Optimism, DOGE To Rally 9000% Ahead?
-
 Altcoin20 hours ago
Why FLOKI Price Hits 6-Month Peak With 5% Surge?
-

 Bitcoin13 hours ago
Marathon Digital Raises $1B to Expand Bitcoin Holdings