
Market
Bitcoin Price Pushes Higher As The Bulls Set Sights on $65K

Bitcoin price gained pace above the $61,500 resistance. BTC even cleared the $63,300 level and is now consolidating gains above $62,500.
- Bitcoin is gaining pace above the $62,200 resistance zone.
- The price is trading above $62,500 and the 100 hourly Simple moving average.
- There is a major bullish trend line forming with support at $61,500 on the hourly chart of the BTC/USD pair (data feed from Kraken).
- The pair could extend gains if it stays above the $61,500 support zone.
Bitcoin Price Extend Gains Above $63,000
Bitcoin price extended its increase above the $60,500 level. BTC was able to clear the $61,200 and $61,500 resistance levels to move into a positive zone.
The bulls pumped the price above $62,500 and $63,000 levels. A high was formed at $63,840 and the price is now consolidating gains. There was a move below the $63,500 level. The price dipped and tested the 23.6% Fib retracement level of the upward move from the $59,165 swing low to the $63,840 high.
Bitcoin is now trading above $62,500 and the 100 hourly Simple moving average. There is also a major bullish trend line forming with support at $61,500 on the hourly chart of the BTC/USD pair.

On the upside, the price could face resistance near the $63,500 level. The first key resistance is near the $63,800 level. A clear move above the $68,400 resistance might send the price higher. The next key resistance could be $64,500. A close above the $64,500 resistance might spark more upsides. In the stated case, the price could rise and test the $65,000 resistance.
Are Dips Limited In BTC?
If Bitcoin fails to rise above the $63,500 resistance zone, it could start a downside correction. Immediate support on the downside is near the $62,700 level.
The first major support is $61,500 and the trend line. The next support is now near the $61,000 zone or the 61.8% Fib retracement level of the upward move from the $59,165 swing low to the $63,840 high. Any more losses might send the price toward the $60,500 support in the near term.
Technical indicators:
Hourly MACD – The MACD is now losing pace in the bullish zone.
Hourly RSI (Relative Strength Index) – The RSI for BTC/USD is now above the 50 level.
Major Support Levels – $62,700, followed by $61,500.
Major Resistance Levels – $63,500, and $63,800.


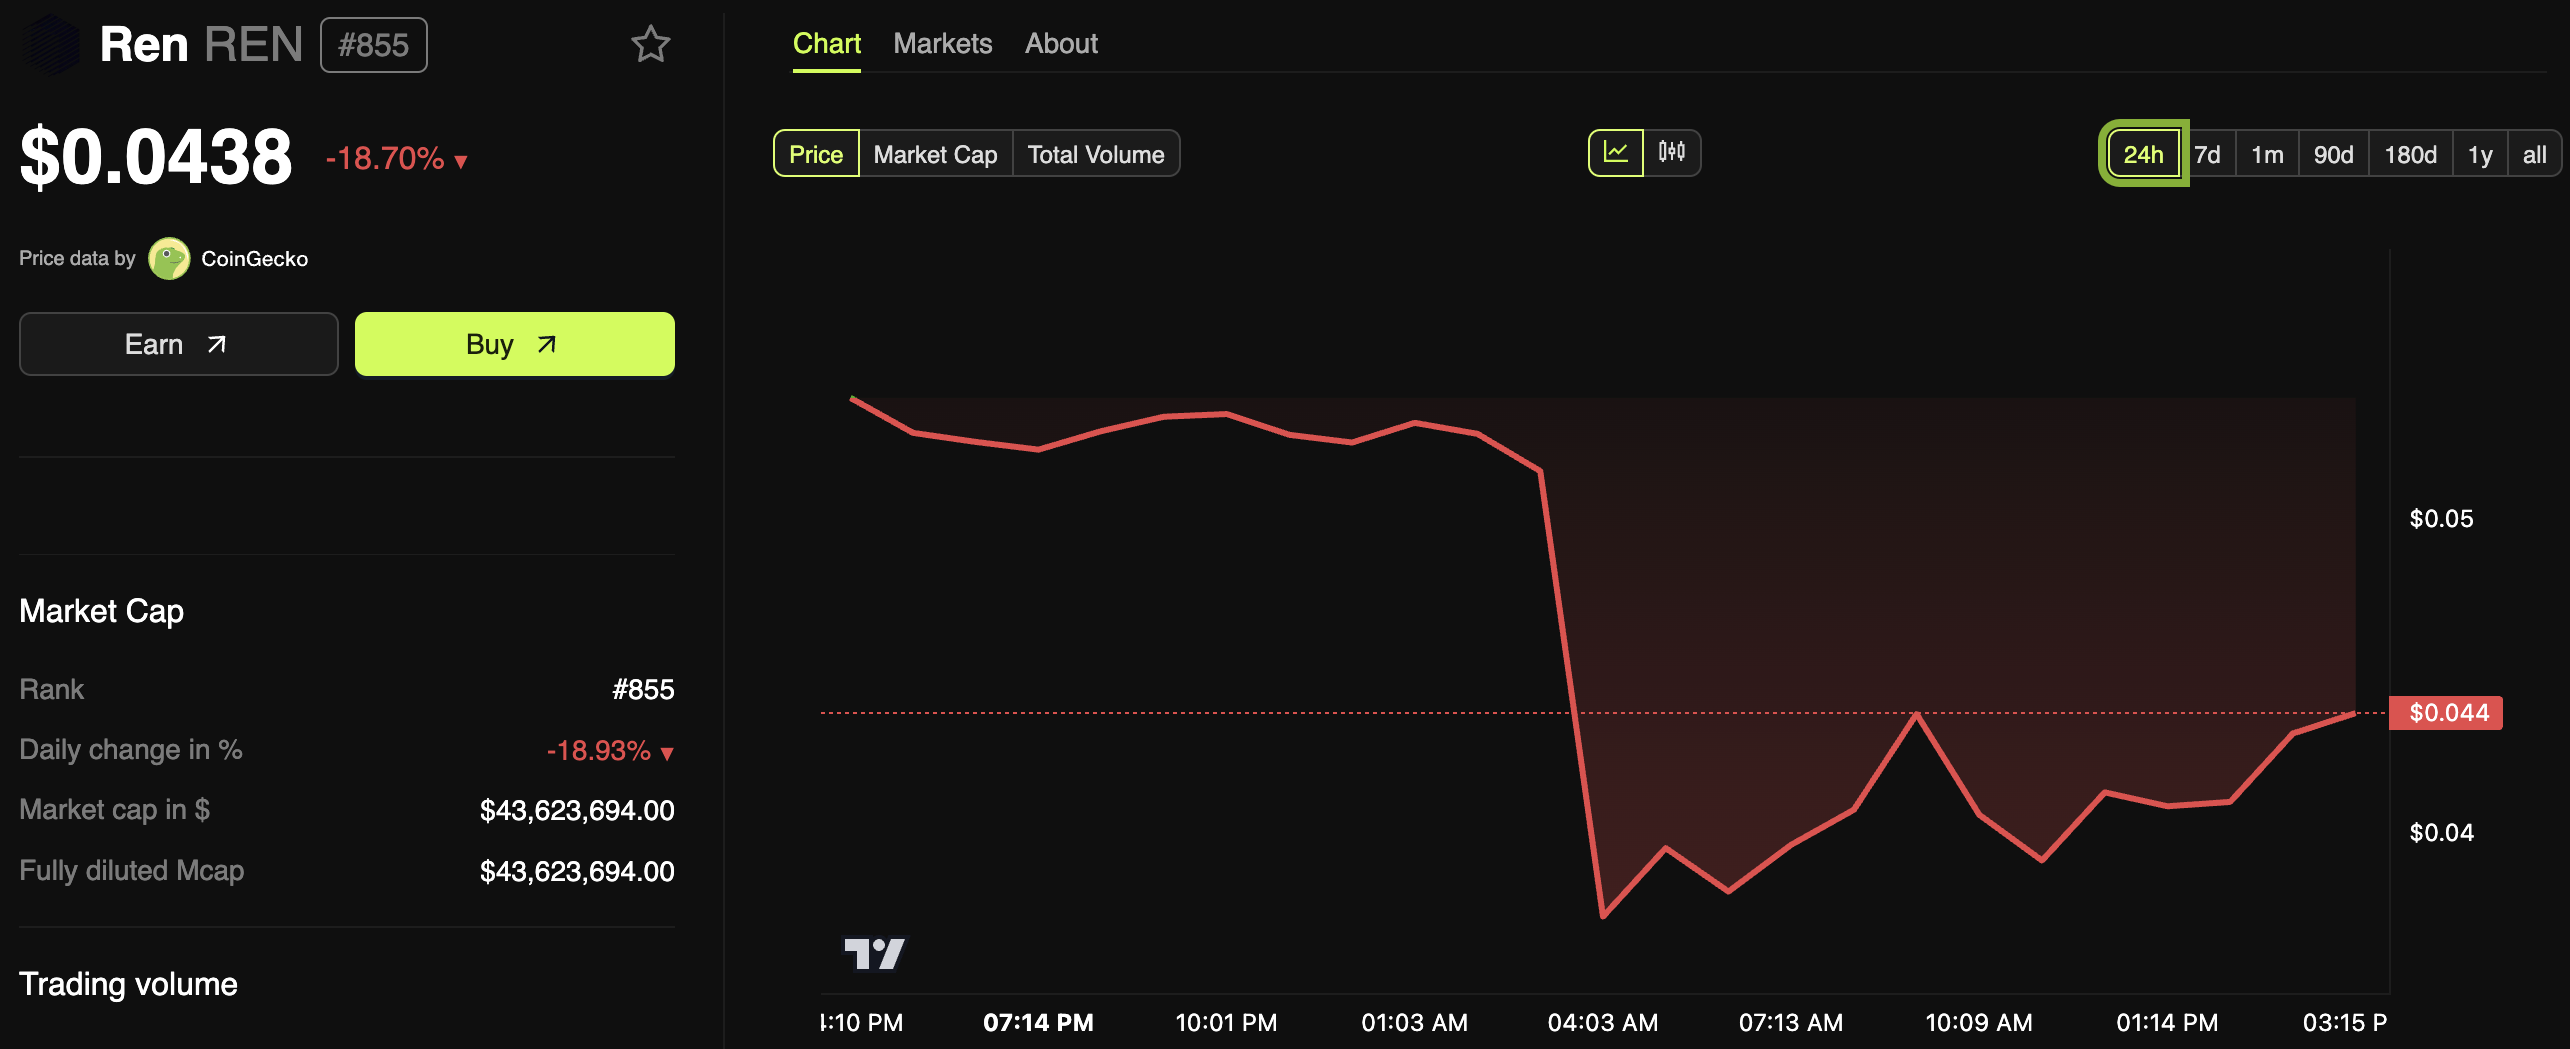
After over 10 months of silence, Ren Protocol announced on social media that it made progress on the long-awaited v2 network upgrade. However, Binance delisted the REN token today, and the community derided this “announcement” as a liquidity farming scam.
Prominent commentators like ZachXBT voiced heavy skepticism about Ren Protocol development, and the firm’s reputation cratered alongside its token value.
Ren Protocol Delisted
In a surprising development, Ren Protocol made its first social media update in over 10 months today. The firm discussed its long-awaited Ren v2 upgrade, promising that work is continuing and further announcements should be coming soon. Ren Protocol initially announced it would shutter its 1.0 network in 2022, but the firm has done little to replace it.
However, the community immediately noticed a much more cynical explanation for this update. The same day, the leading exchange, Binance, announced that it was delisting REN, the protocol’s token. After December 10, Binance users will not be able to trade, deposit, or withdraw REN tokens. The asset’s price subsequently cratered.
In other words, the Ren Protocol was completely silent for nearly an entire year, and it made vague promises of future growth immediately after an impending disaster. Several figures in the community openly accused these developers of conducting a scam: they would briefly pump liquidity through social media hype.
“Sounds like you’re farming for exit liquidity tbh. Where can we read about development?” said one user.
Even on-chain sleuth ZachXBT criticized the project. ZachXBT’s condemnation of this announcement is particularly noteworthy, considering his sterling reputation for unmasking frauds. Most comments on Ren Protocol’s initial post echoed this sentiment.
In other words, even if its developers truly made substantial progress on the v2 upgrade, Ren Protocol’s reputation has sustained a serious blow.
Disclaimer
In adherence to the Trust Project guidelines, BeInCrypto is committed to unbiased, transparent reporting. This news article aims to provide accurate, timely information. However, readers are advised to verify facts independently and consult with a professional before making any decisions based on this content. Please note that our Terms and Conditions, Privacy Policy, and Disclaimers have been updated.
Bitcoin price is correcting gains below the $95,000 support. BTC traded close to the $90,000 level and is currently consolidating near $92,500.
- Bitcoin started a downside correction below the $95,000 zone.
- The price is trading below $94,500 and the 100 hourly Simple moving average.
- There is a connecting bearish trend line forming with resistance at $93,500 on the hourly chart of the BTC/USD pair (data feed from Kraken).
- The pair could start another increase if it clears the $93,500 resistance zone.
Bitcoin Price Corrects Gains
Bitcoin price struggled to extend gains and started a downside correction below the $97,500 level. BTC dipped below the $96,000 and $95,000 levels. It even dipped below $92,000.
A low was formed at $90,736 and the price is now rising. There was a move above the $91,800 resistance level. The price cleared the 23.6% Fib retracement level of the downward move from the $98,880 swing high to the $90,736 low.
Bitcoin price is now trading below $95,000 and the 100 hourly Simple moving average. On the upside, the price could face resistance near the $93,500 level. There is also a connecting bearish trend line forming with resistance at $93,500 on the hourly chart of the BTC/USD pair.
The first key resistance is near the $94,800 level. It is close to the 50% Fib retracement level of the downward move from the $98,880 swing high to the $90,736 low.

A clear move above the $94,800 resistance might send the price higher. The next key resistance could be $95,750. A close above the $95,750 resistance might initiate more gains. In the stated case, the price could rise and test the $97,500 resistance level. Any more gains might send the price toward the $98,000 level.
Another Drop In BTC?
If Bitcoin fails to rise above the $93,500 resistance zone, it could start another downside correction. Immediate support on the downside is near the $91,800 level.
The first major support is near the $90,500 level. The next support is now near the $90,000 zone. Any more losses might send the price toward the $88,000 support in the near term.
Technical indicators:
Hourly MACD – The MACD is now gaining pace in the bullish zone.
Hourly RSI (Relative Strength Index) – The RSI for BTC/USD is now below the 50 level.
Major Support Levels – $91,800, followed by $90,500.
Major Resistance Levels – $93,500, and $94,750.

Dogecoin (DOGE) price hit its highest level since 2021 on November 23 but has since entered a correction, dropping 12% in the last 24 hours. The Ichimoku Cloud, DMI, and EMA indicators all point to growing bearish momentum, with DOGE trading below critical levels and showing signs of weakening upward pressure.
If the downtrend continues, DOGE could test support at $0.34, with a potential drop to $0.14 if selling pressure intensifies. However, a recovery could see DOGE challenge resistances at $0.43 and $0.48, potentially aiming for $0.50, a key milestone not reached since March 2021.
DOGE Ichimoku Cloud Shows The Sentiment Is Changing
The Ichimoku Cloud chart for DOGE shows a bearish outlook. The price is trading below both the Tenkan-Sen (blue line) and Kijun-Sen (orange line), indicating downward momentum. The price has also dropped below the cloud (Senkou Span A and B), suggesting a bearish trend has solidified.
The cloud itself, now turning thinner toward the right side of the chart, signals weakening support, increasing the likelihood of further downward pressure.
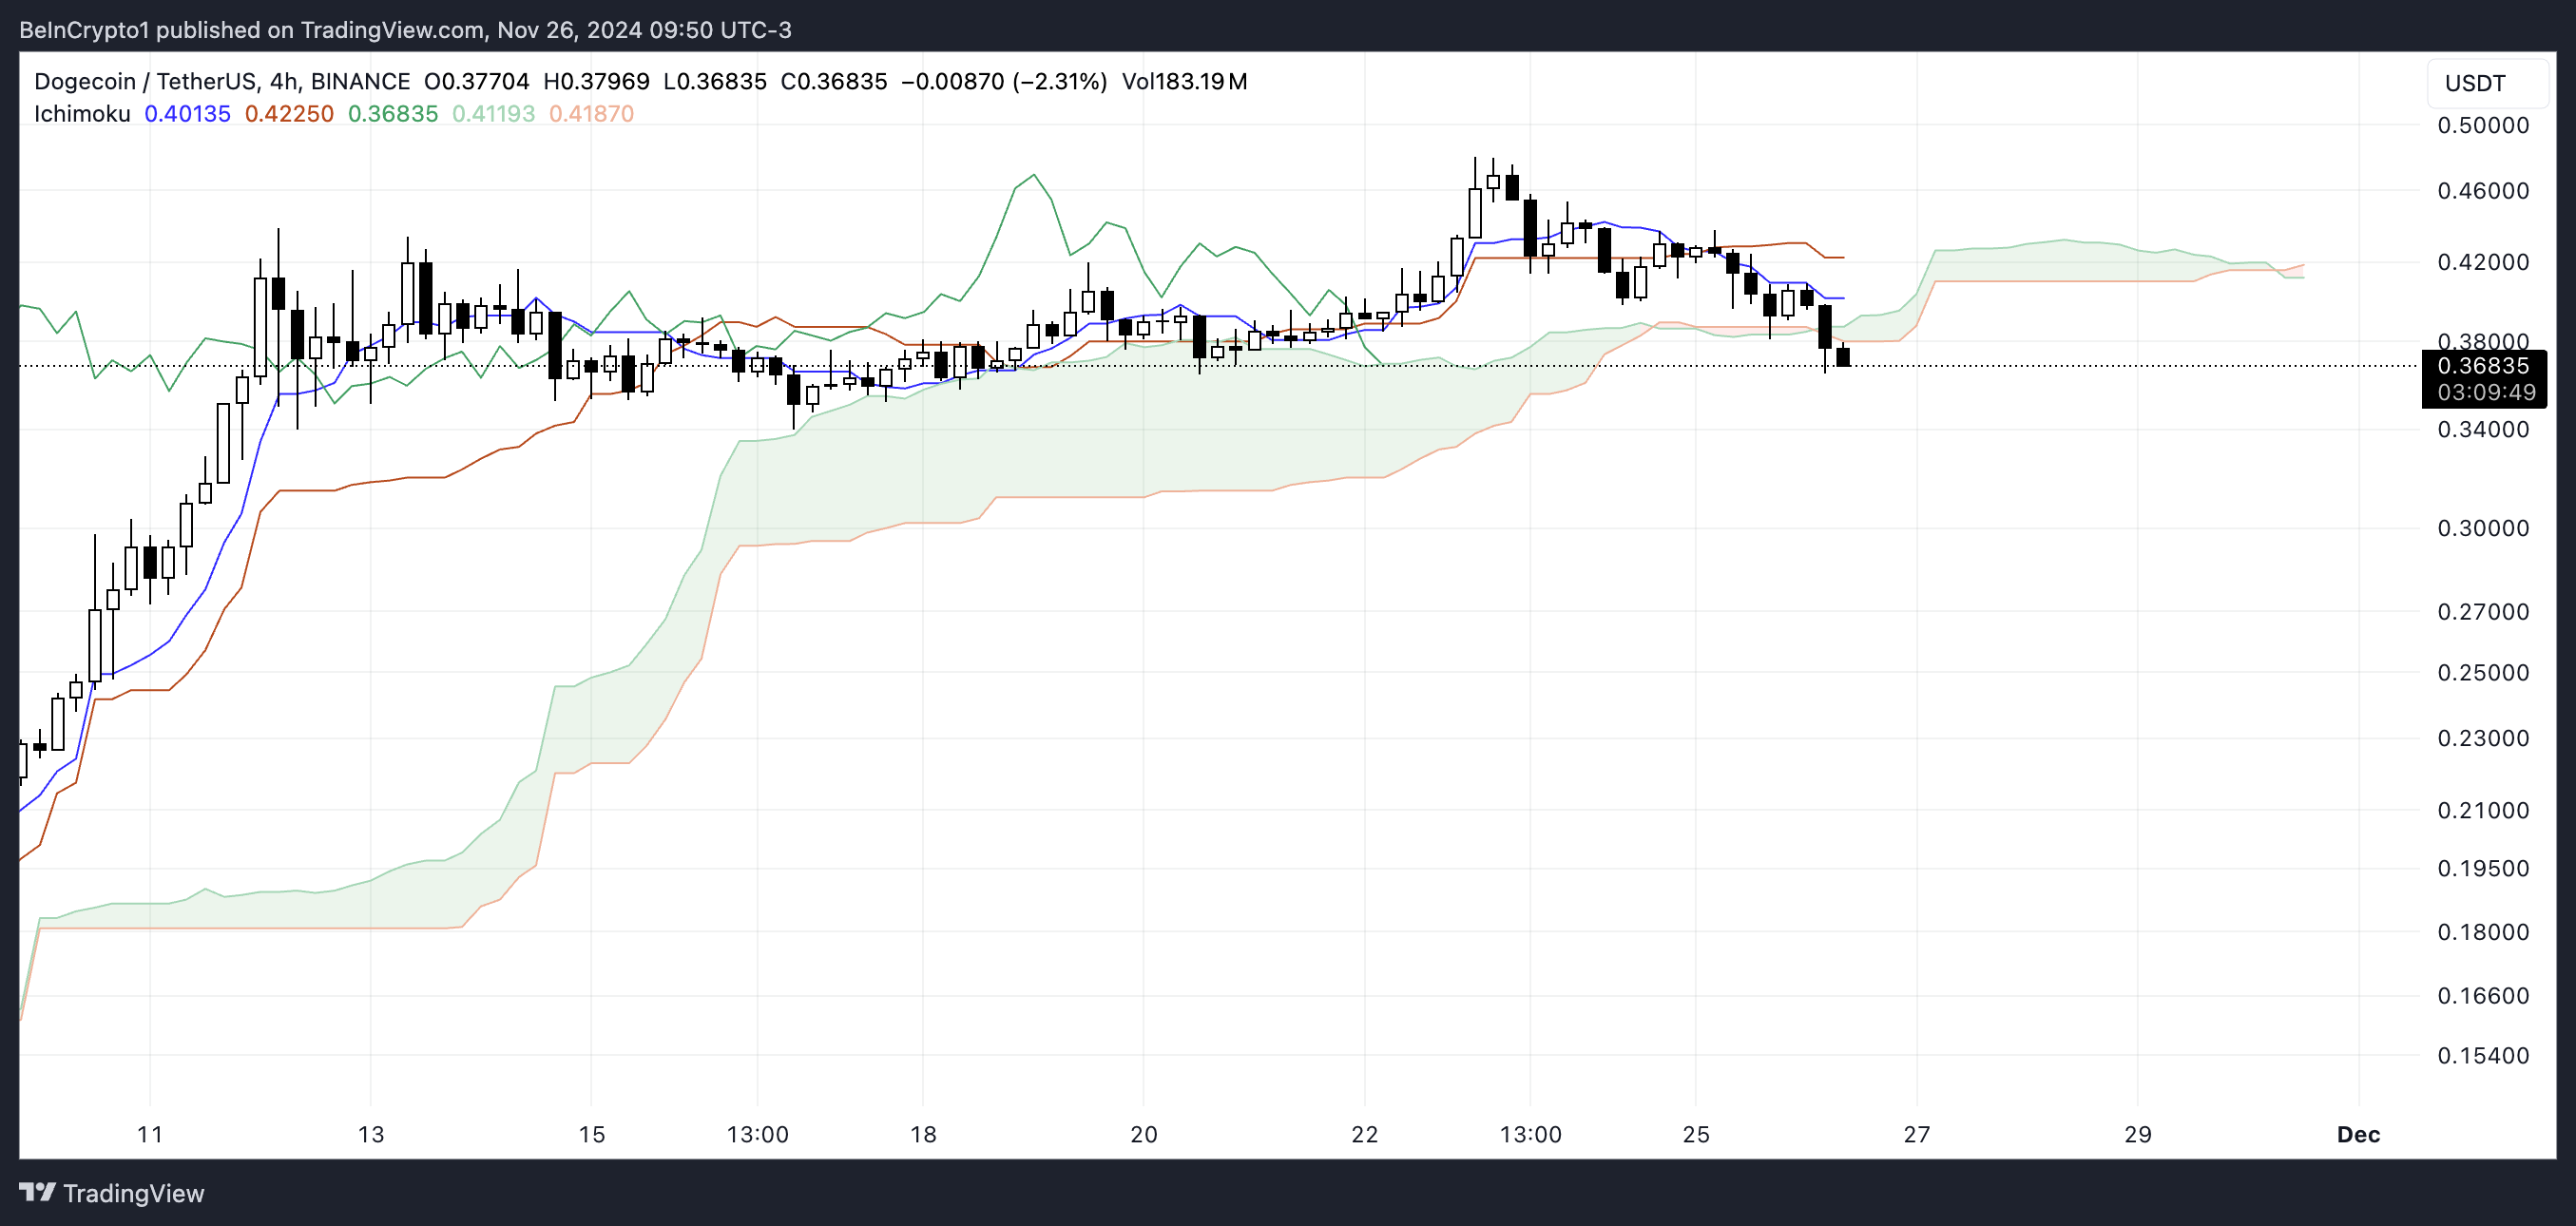
If DOGE fails to reclaim the cloud and hold above the Kijun-Sen, bearish momentum could accelerate, pushing the price lower. However, the flat base of the Kijun-Sen could act as a minor resistance, and a bounce back above the cloud would indicate a potential trend reversal.
For now, the Ichimoku Cloud suggests that Dogecoin price is in a critical phase, during which the bears will remain in control unless a strong recovery occurs.
Dogecoin’s Downtrend Could Get Stronger
Dogecoin DMI chart indicates an ADX of 22.84, with D+ at 13.5 and D- at 29.7, highlighting a potential shift in momentum. The ADX, or Average Directional Index, measures the strength of a trend, with values above 25 indicating a significant trend, regardless of direction.
Meanwhile, D+ represents bullish strength, and D- represents bearish strength. In this case, the higher D- compared to D+ confirms that bearish forces are currently dominating DOGE’s price action.
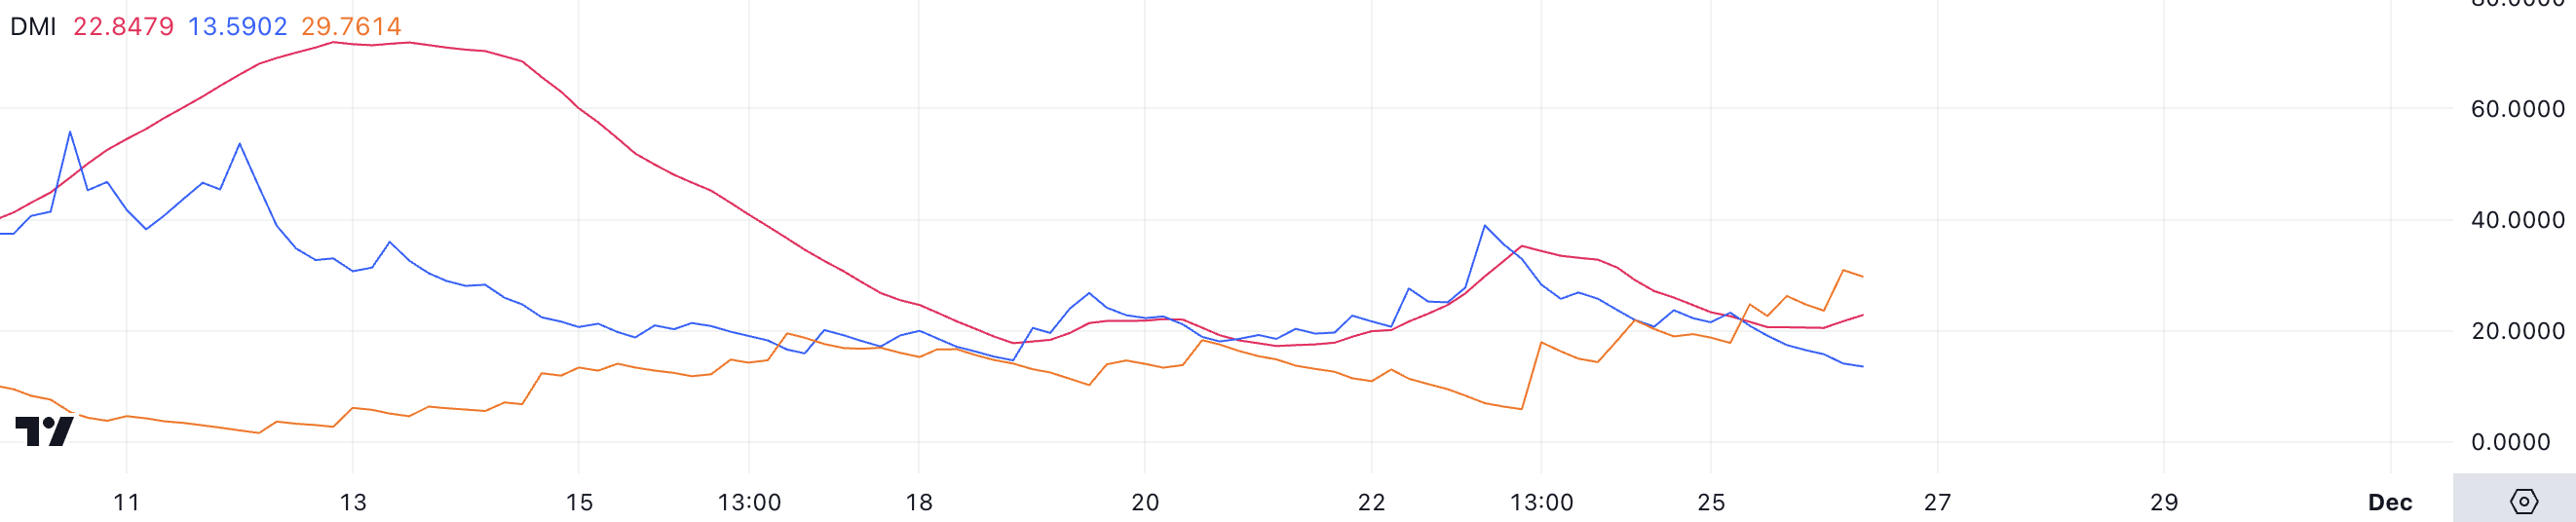
Although the ADX at 22.84 suggests that the downtrend is not yet strongly established, the widening gap between D- and D+ points to growing bearish momentum.
This setup indicates that DOGE is likely entering a downtrend, with selling pressure outweighing buying interest. If the ADX continues to rise above 25 while D- remains dominant, it could confirm a stronger bearish trend, leading to further price declines.
DOGE Price Prediction: Can DOGE Reach $0.50 In November?
Dogecoin EMA lines suggest a shift in market sentiment from bullish to bearish, with the current price trading below the short-term EMA lines.
Additionally, these short-term lines are trending downward, indicating growing selling pressure and a weakening upward momentum. This bearish development suggests that DOGE price is losing its previous bullish support, potentially paving the way for further price declines.
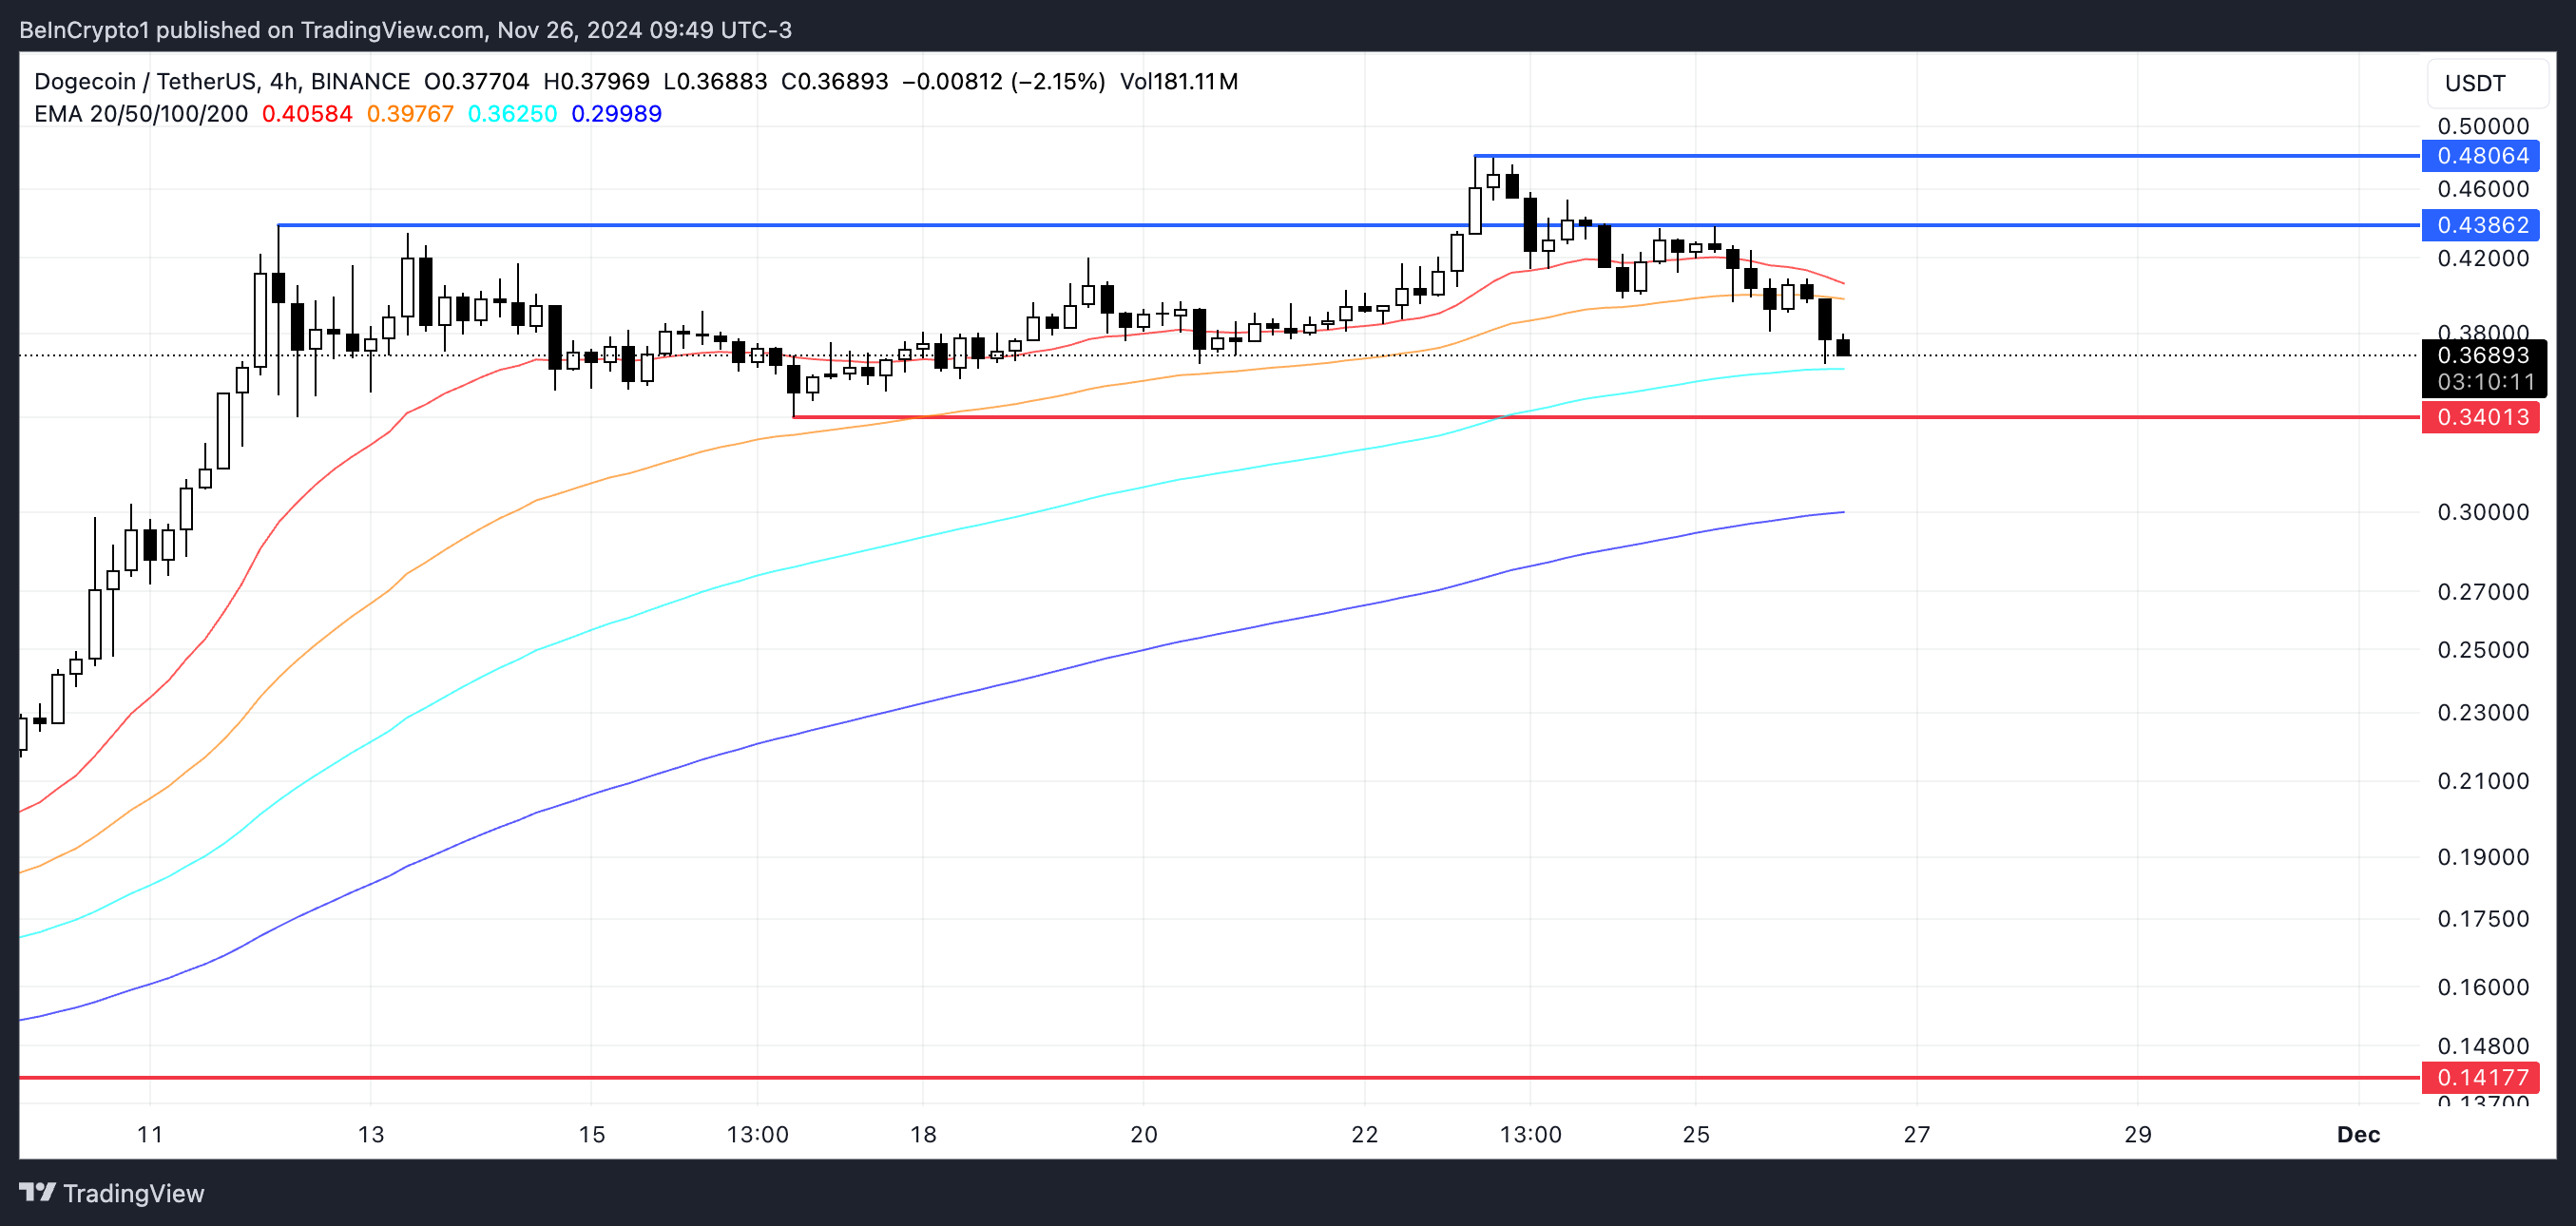
If the downtrend strengthens, Dogecoin price could test key support at $0.34. If this level fails to hold, the price might drop as low as $0.14, marking a significant 61% correction.
However, if DOGE price manages to reverse the trend and regain bullish momentum, it could challenge resistances at $0.43 and $0.48. Breaking through these levels would likely push DOGE toward $0.50, a price not seen since March 2021, signaling a strong recovery.
Disclaimer
In line with the Trust Project guidelines, this price analysis article is for informational purposes only and should not be considered financial or investment advice. BeInCrypto is committed to accurate, unbiased reporting, but market conditions are subject to change without notice. Always conduct your own research and consult with a professional before making any financial decisions. Please note that our Terms and Conditions, Privacy Policy, and Disclaimers have been updated.

This is Why Ren Protocol Faces Backlash After Binance Delisting

THENA (THE) Price Soars 400% On Binance Listing Announcement

Bitcoin Price Corrects to $90K: Healthy Dip or Cause for Concern?

Analyst Reveals The ‘Truth’ Behind This Dogecoin Price Rally

Dogecoin (DOGE) Price Weakens as Bears Take Control

Solana (SOL) Price Correction Threatens Death Cross Formation

2.52 Million Altcoins Are Ruining Crypto’s Future

Animoca Brands Valuation Tanks 75% In Two Years, Here’s Why

Crypto exchange BingX hacked for $43 million

Are The Big Players Losing Interest?

Hong Kong’s Securities Association Tips Authorities On Crypto Self-Regulation

Coinbase cbBTC Set to go Live on Solana
2.52 Million Altcoins Are Ruining Crypto’s Future
Animoca Brands Valuation Tanks 75% In Two Years, Here’s Why
Crypto exchange BingX hacked for $43 million
Are The Big Players Losing Interest?
Hong Kong’s Securities Association Tips Authorities On Crypto Self-Regulation
Coinbase cbBTC Set to go Live on Solana
-
 Altcoin22 hours ago
Shiba Inu Lead Lauds TRON’s Justin Sun As SHIB Prepares TREAT Token Launch
-

 Bitcoin21 hours ago
Rumble’s Bitcoin Treasury: A $20 Million Allocation
-

 Market21 hours ago
XRP Price Eyes Fresh Upside: Can Bulls Deliver?
-

 Bitcoin20 hours ago
Programmable BTC Now a Reality
-

 Market20 hours ago
Can Cardano Bulls Push ADA Price to $2?
-
 Altcoin19 hours ago
Binance Announces Official Launch of BFUSD
-

 Market19 hours ago
Bulls Ready for The Next Move?
-
 Market24 hours ago
Did It Manipulate Prices Again?