
Market
Analyst Identifies $0.75 As Most Crucial Target For XRP Price In The Campaign For $1
The XRP price has experienced a notable surge in recent days amidst the wider backdrop of the crypto industry. At the time of writing, many cryptocurrencies are starting to reverse their seven-day gains due to Bitcoin’s failure to break above $60,000 on Monday. However, XRP continues to stand firm, registering a 2.23% gain in the past 24 hours. This positive price movement has sparked discussions within the crypto community about the potential for a significant breakthrough.
Analyst Identifies $0.75 As A Crucial Target
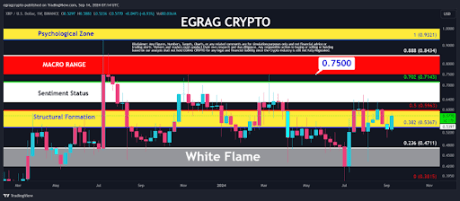
EGRAG CRYPTO’s highlight of the $0.75 price mark for XRP is based on an XRP/USD price chart on the weekly candlestick timeframe, which he shared on social media platform X. Interestingly, the latest highlight comes as an update to his XRP analysis from January 2024. This analysis focuses on XRP’s price structural formation, sentiment status, MACRO range, and psychological zone, all in critical price zones. The most notable are the MACRO range, which starts at $0.71, and the psychological zone at $0.932.
Related Reading
According to crypto analyst EGRAG Crypto, the key resistance level for XRP is $0.75, which could make or break its journey to $1. As EGRAG noted, all these levels can be shattered with just one strong daily candle, with emphasis on $0.75. For XRP, the $0.75 mark is within the MACRO range.
Interestingly, XRP is yet to break above $0.75 this year, with its highest point so far being $0.718. Should the cryptocurrency manage to close above this level on a weekly timeframe, it could pave the way for a more substantial price rally.
Will The XRP Price Sustain A Rally To $1?
At the time of writing, the XRP price is trading at $0.5851 and is still on 8.4% gains in seven days. Based on the recent update, EGRAG noted that the move towards $1 is still in play, as XRP is poised for a massive breakout.
Although EGRAG only noted the $0.75 price as the most crucial for a breakthrough, there exist other resistance levels that serve as forerunners. Looking at the XRP price chart, XRP has been trading below $0.62 since March. Interestingly, the cryptocurrency has retested this price level at least six times since then and has failed to break above.
Related Reading
From a technical perspective, $0.62 has emerged as a pivotal price point, acting as a short-term hurdle that XRP bulls must conquer before setting their sights on the more significant $0.75 resistance. A clear break above these levels would signal increasing buyer strength and potentially open the door for a campaign to $1.
From a fundamental point of view, the XRP price is starting to campaign to the $1 mark in light of recent events in the XRP ecosystem. One such event is Grayscale’s recent unveiling of the first XRP trust in the US. This move has prompted speculation that an XRP ETF will hit the market soon. Another noteworthy development is the relisting of XRP on the European version of Robinhood.
Featured image created with Dall.E, chart from Tradingview.com


Aayush Jindal, a luminary in the world of financial markets, whose expertise spans over 15 illustrious years in the realms of Forex and cryptocurrency trading. Renowned for his unparalleled proficiency in providing technical analysis, Aayush is a trusted advisor and senior market expert to investors worldwide, guiding them through the intricate landscapes of modern finance with his keen insights and astute chart analysis.
From a young age, Aayush exhibited a natural aptitude for deciphering complex systems and unraveling patterns. Fueled by an insatiable curiosity for understanding market dynamics, he embarked on a journey that would lead him to become one of the foremost authorities in the fields of Forex and crypto trading. With a meticulous eye for detail and an unwavering commitment to excellence, Aayush honed his craft over the years, mastering the art of technical analysis and chart interpretation.
As a software engineer, Aayush harnesses the power of technology to optimize trading strategies and develop innovative solutions for navigating the volatile waters of financial markets. His background in software engineering has equipped him with a unique skill set, enabling him to leverage cutting-edge tools and algorithms to gain a competitive edge in an ever-evolving landscape.
In addition to his roles in finance and technology, Aayush serves as the director of a prestigious IT company, where he spearheads initiatives aimed at driving digital innovation and transformation. Under his visionary leadership, the company has flourished, cementing its position as a leader in the tech industry and paving the way for groundbreaking advancements in software development and IT solutions.
Despite his demanding professional commitments, Aayush is a firm believer in the importance of work-life balance. An avid traveler and adventurer, he finds solace in exploring new destinations, immersing himself in different cultures, and forging lasting memories along the way. Whether he’s trekking through the Himalayas, diving in the azure waters of the Maldives, or experiencing the vibrant energy of bustling metropolises, Aayush embraces every opportunity to broaden his horizons and create unforgettable experiences.
Aayush’s journey to success is marked by a relentless pursuit of excellence and a steadfast commitment to continuous learning and growth. His academic achievements are a testament to his dedication and passion for excellence, having completed his software engineering with honors and excelling in every department.
At his core, Aayush is driven by a profound passion for analyzing markets and uncovering profitable opportunities amidst volatility. Whether he’s poring over price charts, identifying key support and resistance levels, or providing insightful analysis to his clients and followers, Aayush’s unwavering dedication to his craft sets him apart as a true industry leader and a beacon of inspiration to aspiring traders around the globe.
In a world where uncertainty reigns supreme, Aayush Jindal stands as a guiding light, illuminating the path to financial success with his unparalleled expertise, unwavering integrity, and boundless enthusiasm for the markets.

Global investment management firm VanEck has officially registered a statutory trust in Delaware for Binance’s BNB (BNB) exchange-traded fund (ETF).
This move marks the first attempt to launch a spot BNB ETF in the United States. It could potentially open new avenues for institutional and retail investors to gain exposure to the asset through a regulated investment vehicle.
VanEck Moves Forward with BNB ETF
The trust was registered on March 31 under the name “VanEck BNB ETF” with filing number 10148820. It was recorded on Delaware’s official state website.

The proposed BNB ETF would track the price of BNB. It is the native cryptocurrency of the BNB Chain ecosystem, developed by the cryptocurrency exchange Binance.
As per the latest data, BNB ranks as the fifth-largest cryptocurrency by market capitalization at $87.1 billion. Despite its significant market position, both BNB’s price and the broader cryptocurrency market have faced some challenges recently.
Over the past month, the altcoin’s value has declined 2.2%. At the time of writing, BNB was trading at $598. This represented a 1.7% dip in the last 24 hours, according to data from BeInCrypto.

While the trust filing hasn’t yet led to a price uptick, the community remains optimistic about the prospects of BNB, especially with this new development.
“Send BNB to the moon now,” an analyst posted on X (formerly Twitter).
The filing comes just weeks after VanEck made a similar move for Avalanche (AVAX). On March 10, VanEck registered a trust for an AVAX-focused ETF.
This was quickly followed by the filing of an S-1 registration statement with the US Securities and Exchange Commission (SEC). Given this precedent, a similar S-1 filing for a BNB ETF could follow soon.
“A big step toward bringing BNB to US institutional investors!” another analyst wrote.
Meanwhile, the industry has seen an influx of crypto fund applications at the SEC following the election of a pro-crypto administration. In fact, a recent survey revealed that 71% of ETF investors are bullish on crypto and plan to increase their allocations to cryptocurrency ETFs in the next 12 months.
“Three-quarters of allocators expect to increase their investment in cryptocurrency-focused ETFs over the next 12 months, with demand highest in Asia (80%), and the US (76%), in contrast to Europe (59%),” the survey revealed.
This growing interest in crypto ETFs could drive further demand for assets like BNB, making the VanEck BNB ETF a potentially significant product in the market.
Disclaimer
In adherence to the Trust Project guidelines, BeInCrypto is committed to unbiased, transparent reporting. This news article aims to provide accurate, timely information. However, readers are advised to verify facts independently and consult with a professional before making any decisions based on this content. Please note that our Terms and Conditions, Privacy Policy, and Disclaimers have been updated.
XRP price started a fresh decline from the $2.20 zone. The price is now consolidating and might face hurdles near the $2.120 level.
- XRP price started a fresh decline after it failed to clear the $2.20 resistance zone.
- The price is now trading below $2.150 and the 100-hourly Simple Moving Average.
- There is a connecting bearish trend line forming with resistance at $2.120 on the hourly chart of the XRP/USD pair (data source from Kraken).
- The pair might extend losses if it fails to clear the $2.20 resistance zone.
XRP Price Faces Rejection
XRP price failed to continue higher above the $2.20 resistance zone and reacted to the downside, like Bitcoin and Ethereum. The price declined below the $2.150 and $2.120 levels.
The bears were able to push the price below the 50% Fib retracement level of the recovery wave from the $2.023 swing low to the $2.199 high. There is also a connecting bearish trend line forming with resistance at $2.120 on the hourly chart of the XRP/USD pair.
The price is now trading below $2.150 and the 100-hourly Simple Moving Average. However, the bulls are now active near the $2.10 support level. They are protecting the 61.8% Fib retracement level of the recovery wave from the $2.023 swing low to the $2.199 high.

On the upside, the price might face resistance near the $2.120 level and the trend line zone. The first major resistance is near the $2.150 level. The next resistance is $2.20. A clear move above the $2.20 resistance might send the price toward the $2.240 resistance. Any more gains might send the price toward the $2.2650 resistance or even $2.2880 in the near term. The next major hurdle for the bulls might be $2.320.
Another Decline?
If XRP fails to clear the $2.150 resistance zone, it could start another decline. Initial support on the downside is near the $2.10 level. The next major support is near the $2.0650 level.
If there is a downside break and a close below the $2.0650 level, the price might continue to decline toward the $2.020 support. The next major support sits near the $2.00 zone.
Technical Indicators
Hourly MACD – The MACD for XRP/USD is now gaining pace in the bearish zone.
Hourly RSI (Relative Strength Index) – The RSI for XRP/USD is now below the 50 level.
Major Support Levels – $2.10 and $2.050.
Major Resistance Levels – $2.120 and $2.20.

What’s Fueling The Shibarium Boost?

BNB Price Faces More Downside—Can Bulls Step In?

Tokenized Gold Market Cap Tops $1.2 Billion as Gold Prices Surge

VanEck Sets Stage for BNB ETF with Official Trust Filing

Pi Network Faces Community Backlash, Is Pi Coin Price Heading to Zero?

XRP Recovery Stalls—Are Bears Still In Control?

2.52 Million Altcoins Are Ruining Crypto’s Future

Animoca Brands Valuation Tanks 75% In Two Years, Here’s Why

Crypto exchange BingX hacked for $43 million

Are The Big Players Losing Interest?

Hong Kong’s Securities Association Tips Authorities On Crypto Self-Regulation

Coinbase cbBTC Set to go Live on Solana
2.52 Million Altcoins Are Ruining Crypto’s Future
Animoca Brands Valuation Tanks 75% In Two Years, Here’s Why
Crypto exchange BingX hacked for $43 million
Are The Big Players Losing Interest?
Hong Kong’s Securities Association Tips Authorities On Crypto Self-Regulation
Coinbase cbBTC Set to go Live on Solana
-

 Bitcoin22 hours ago
$500 Trillion Bitcoin? Saylor’s Bold Prediction Shakes the Market!
-
 Altcoin20 hours ago
Will XRP, SOL, ADA Make the List?
-

 Bitcoin23 hours ago
Big Bitcoin Buy Coming? Saylor Drops a Hint as Strategy Shifts
-

 Market22 hours ago
Coinbase Stock Plunges 30% in Worst Quarter Since FTX Collapse
-
 Altcoin19 hours ago
BTC, ETH, XRP, DOGE Fall Following Weak PMI, JOLTS Data
-

 Altcoin18 hours ago
Binance Update Sparks 50% Decline For Solana Meme Coin ACT: Details
-

 Market24 hours ago
XRP Price Struggles as Whale Selling Rises To $2.3 Billion
-

 Market23 hours ago
Fake Gemini Bankruptcy Emails Target Users