
Market
Crypto Inflows Hit $436 Million on Anticipated Fed Rate Cuts

Digital asset investment products recorded $436 million in inflows last week, a paradigm shift after a series of outflows reaching $1.2 billion.
Crypto markets have much to anticipate this week, with a key moment on Wednesday as the Federal Open Market Committee (FOMC) decides the scale of September’s interest rate cuts.
Crypto Investments Inflows Reach $436 Million
Bitcoin (BTC) led crypto inflows last week, bringing in up to $436 million and reversing the negative flows from the week ending September 6. In contrast, Ethereum (ETH) continued to experience negative flows, with $19 million in outflows following the $98 million outflows recorded the previous week.
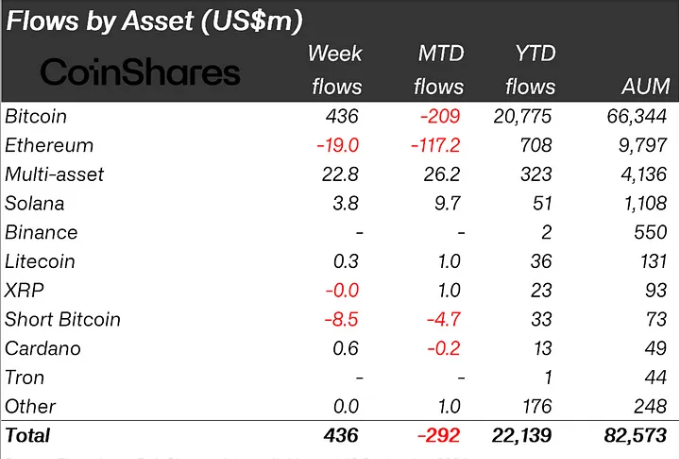
The latest CoinShares report attributes Bitcoin’s positive inflows to expectations of a 50 basis point (0.50%) rate cut. Regional inflows support this theory, with the US leading the way, accounting for up to $416 million.
Specifically, comments from Bill Dudley fueled optimism. The former New York Fed President stated on Thursday that there was a strong case for a 50 basis point interest rate cut.
“I think there’s a strong case for 50, whether they’re going to do it or not,” Dudley said at the Bretton Woods Committee’s annual Future of Finance Forum in Singapore.
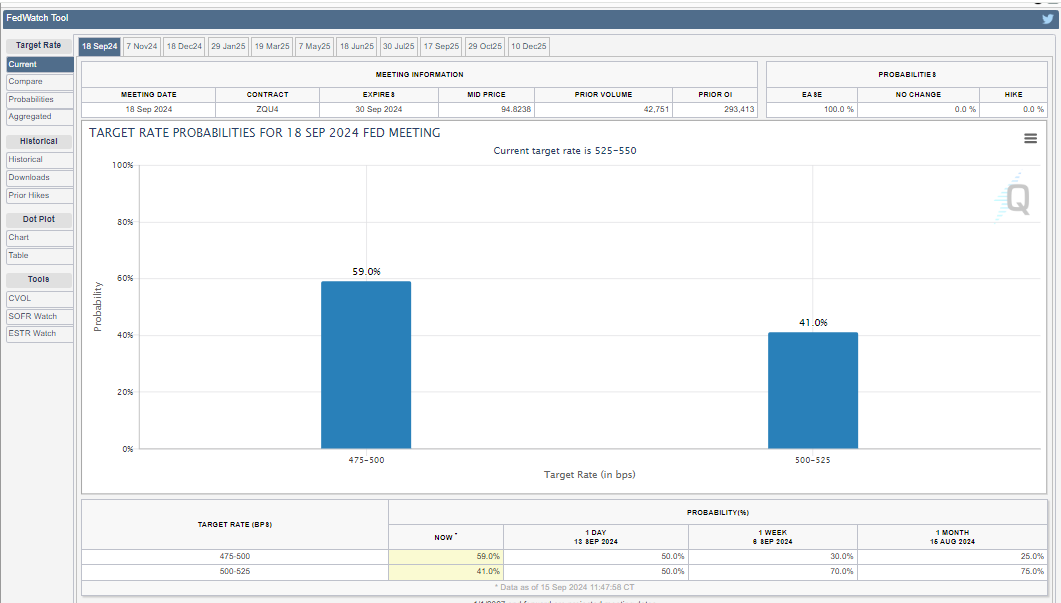
The FOMC’s interest rate cut decision on Wednesday is a key event that crypto markets will closely watch this week. Traders and investors are preparing for the impact on their portfolios, depending on the policymakers’ chosen rate cut. Data from the CME FedWatch Tool shows a 59% probability of a 50 bps rate cut, compared to a 41% chance of a 25 bps cut.
Read more: How to Protect Yourself From Inflation Using Cryptocurrency
JPMorgan also advocates for a 50 bps interest rate cut, but uncertain times lie ahead for Bitcoin regardless of whether the cut is 50 or 25 bps. A 25 bps cut is already priced in, while analysts caution that a heavier 50 bps cut could negatively impact Bitcoin.
Regardless of the outcome, markets are eagerly awaiting Wednesday’s FOMC decision, which could bring the first rate cut since early 2020.
Rotation of ETFs Is Growing
Meanwhile, CoinShares reports that trading volumes in exchange-traded funds (ETFs) remained flat at $8 billion last week. However, Eric Balchunas notes that data shows a surge in flows into value ETFs, reaching $11.4 billion over the past 30 days. This reflects a significant shift of capital toward these financial instruments.
“If we do rolling 30 days the flows into value ETFs are $11.4b, which is huge. While many value ETFs have taken in cash a big chunk of this is via BlackRock’s model portfolio which rotated heavily into EFV,” Balchunas added.
The ETF expert acknowledges that several value ETFs have benefited from the recent influx of cash, with a significant portion attributed to BlackRock’s model portfolio. Balchunas highlights the growing rotation into value ETFs, citing $5.6 billion in inflows in the first two weeks of September.
He compares this surge to the “Great Head Fake of Late 2020,” when markets experienced an unexpected shift in trends. During that period, growth stocks, particularly in the tech sector, significantly diverged in performance from value stocks, surprising many investors.
It remains uncertain whether this value rotation will continue to strengthen or face obstacles, particularly from the dominance of tech-heavy ETFs like Invesco NASDAQ Futures (QQQs). Balchunas questions the longevity of the shift, given the continued appeal of technology-focused investments.
Reflecting on the “Great Head Fake,” which prompted a reassessment of traditional strategies and debates about its sustainability, the current rotation raises similar questions. Whether this rotation will endure or face challenges from competing investment themes is yet to be determined, but it presents a compelling development for investors to closely monitor.
Disclaimer
In adherence to the Trust Project guidelines, BeInCrypto is committed to unbiased, transparent reporting. This news article aims to provide accurate, timely information. However, readers are advised to verify facts independently and consult with a professional before making any decisions based on this content. Please note that our Terms and Conditions, Privacy Policy, and Disclaimers have been updated.


Reason to trust
![]()
Strict editorial policy that focuses on accuracy, relevance, and impartiality
Created by industry experts and meticulously reviewed
The highest standards in reporting and publishing
Strict editorial policy that focuses on accuracy, relevance, and impartiality
Morbi pretium leo et nisl aliquam mollis. Quisque arcu lorem, ultricies quis pellentesque nec, ullamcorper eu odio.
Bitcoin price started another decline below the $83,500 zone. BTC is now consolidating and might struggle to recover above the $83,850 zone.
- Bitcoin started a fresh decline below the $83,200 support zone.
- The price is trading below $83,000 and the 100 hourly Simple moving average.
- There is a connecting bullish trend line forming with support at $82,550 on the hourly chart of the BTC/USD pair (data feed from Kraken).
- The pair could start another decline if it stays below the $83,850 resistance zone.
Bitcoin Price Faces Resistance
Bitcoin price failed to start a recovery wave and remained below the $85,500 level. BTC started another decline and traded below the support area at $83,500. The bears gained strength for a move below the $82,500 support zone.
The price even declined below the $82,000 level. A low was formed at $81,320 before there was a recovery wave. There was a move above the $82,500 level, but the bears were active near $83,850. The price is now consolidating and there was a drop below the 50% Fib retracement level of the upward move from the $81,320 swing low to the $83,870 high.
Bitcoin price is now trading below $83,250 and the 100 hourly Simple moving average. There is also a connecting bullish trend line forming with support at $82,550 on the hourly chart of the BTC/USD pair. On the upside, immediate resistance is near the $83,250 level. The first key resistance is near the $83,850 level.

The next key resistance could be $84,200. A close above the $84,200 resistance might send the price further higher. In the stated case, the price could rise and test the $84,800 resistance level. Any more gains might send the price toward the $85,000 level or even $85,500.
Another Decline In BTC?
If Bitcoin fails to rise above the $83,850 resistance zone, it could start a fresh decline. Immediate support on the downside is near the $82,550 level. The first major support is near the $82,250 level and the 61.8% Fib retracement level of the upward move from the $81,320 swing low to the $83,870 high.
The next support is now near the $81,250 zone. Any more losses might send the price toward the $80,000 support in the near term. The main support sits at $78,500.
Technical indicators:
Hourly MACD – The MACD is now losing pace in the bearish zone.
Hourly RSI (Relative Strength Index) – The RSI for BTC/USD is now below the 50 level.
Major Support Levels – $82,250, followed by $81,250.
Major Resistance Levels – $83,250 and $83,850.


On April 1, Binance co-founder Changpeng Zhao (CZ) shared an amusing hypothetical on social media platform X (Twitter).
He posed the hypothetical scenario of a user generating a cryptocurrency wallet address commonly used for token burns, which permanently remove tokens from circulation.
Binance’s CZ Shares Cryptic Hypothetical on April Fools Day
Changpeng Zhao’s April Fools’ joke about generating a token burn address sparked discussions. However, the chances of it happening are astronomically low. CZ shared the post during the early hours of the Asian session, kickstarting an interesting discourse.
“Imagine downloading Trust Wallet and finding your newly generated address is: 0x000000000000000000000000000000000000dead. Theoretically speaking, it has the same chance as any other address. Alright, enough imagining. Not gonna happen. Get back to building. Happy Apr 1!” Changpeng Zhao wrote.
It comes in time for April Fools’ Day, celebrated annually on April 1, dedicated to practical jokes, hoaxes, and playful deception. Trust Wallet, integrated as Binance’s non-custodial wallet provider, played along with the joke.
“Happy April Fool’s Day,” wrote Trust Wallet.
While the idea seems far-fetched, CZ was not technically wrong. Theoretically, there is an infinitesimally small probability that someone could randomly generate a wallet address matching “0x000…dead” using software like Trust Wallet.
However, the chances are comparable to winning the lottery multiple times. To put things into perspective, one can generate blockchain addresses using cryptographic hashing functions that produce 160-bit outputs.
This means there are 2¹⁶⁰ possible Ethereum addresses—a number so vast that generating any specific address, such as “0x000…dead,” is practically impossible.
“Haha, imagine the odds! That is a 1 in 2^160 type of vibe. Good one, CZ—back to work now, no distractions from the code,” Synergy Media wrote, putting the rarity into context.
While CZ’s April Fool’s joke entertained the crypto community, the reality remains unchanged. The likelihood of generating a wallet address identical to “0x000…dead” is close to zero. This means the post was a fun thought experiment but nothing more.
“Imagine that you can randomly generate a Bitcoin private key every second, and suddenly one day the private key you generated happens to correspond to Satoshi Nakamoto’s wallet or Binance’s wallet. That’s terrifying,” another user quipped.
However, the joke does highlight the fascinating cryptographic underpinnings of blockchain technology. While every address is technically possible, some are rare and might as well be myths. Crypto users will have to keep burning their tokens the old-fashioned way.
Disclaimer
In adherence to the Trust Project guidelines, BeInCrypto is committed to unbiased, transparent reporting. This news article aims to provide accurate, timely information. However, readers are advised to verify facts independently and consult with a professional before making any decisions based on this content. Please note that our Terms and Conditions, Privacy Policy, and Disclaimers have been updated.
XRP price started a fresh decline below the $2.080 zone. The price is now recovering some losses and might face hurdles near the $2.150 level.
- XRP price started a fresh decline after it failed to clear the $2.20 resistance zone.
- The price is now trading below $2.120 and the 100-hourly Simple Moving Average.
- There is a connecting bearish trend line forming with resistance at $2.10 on the hourly chart of the XRP/USD pair (data source from Kraken).
- The pair might extend losses if it fails to clear the $2.150 resistance zone.
XRP Price Faces Resistance
XRP price failed to continue higher above the $2.20 resistance zone and reacted to the downside, like Bitcoin and Ethereum. The price declined below the $2.150 and $2.10 levels.
The pair even declined below the $2.050 zone. A low was formed at $2.023 and the price is now attempting a recovery wave. There was a move above the $2.050 level. The price cleared the 23.6% Fib retracement level of the recent decline from the $2.215 swing high to the $2.023 low.
The price is now trading below $2.120 and the 100-hourly Simple Moving Average. On the upside, the price might face resistance near the $2.10 level. There is also a connecting bearish trend line forming with resistance at $2.10 on the hourly chart of the XRP/USD pair. The trend line is near the 50% Fib retracement level of the recent decline from the $2.215 swing high to the $2.023 low.

The first major resistance is near the $2.150 level. The next resistance is $2.1680. A clear move above the $2.1680 resistance might send the price toward the $2.20 resistance. Any more gains might send the price toward the $2.220 resistance or even $2.250 in the near term. The next major hurdle for the bulls might be $2.2880.
Another Decline?
If XRP fails to clear the $2.120 resistance zone, it could start another decline. Initial support on the downside is near the $2.050 level. The next major support is near the $2.020 level.
If there is a downside break and a close below the $2.020 level, the price might continue to decline toward the $2.00 support. The next major support sits near the $1.880 zone.
Technical Indicators
Hourly MACD – The MACD for XRP/USD is now losing pace in the bearish zone.
Hourly RSI (Relative Strength Index) – The RSI for XRP/USD is now above the 50 level.
Major Support Levels – $2.050 and $2.020.
Major Resistance Levels – $2.120 and $2.150.

Bitcoin Price Battles Key Hurdles—Is a Breakout Still Possible?
Is CZ’s April Fool’s Joke a Crypto Reality or Just Fun?

XRP Bulls Fight Back—Is a Major Move Coming?

A Make or Break Situation As Ripple Crypto Flirts Around $2

CFTC’s Crypto Market Overhaul Under New Chair Brian Quintenz

$2,300 Emerges As The Most Crucial Resistance

2.52 Million Altcoins Are Ruining Crypto’s Future

Animoca Brands Valuation Tanks 75% In Two Years, Here’s Why

Crypto exchange BingX hacked for $43 million

Are The Big Players Losing Interest?

Hong Kong’s Securities Association Tips Authorities On Crypto Self-Regulation

Coinbase cbBTC Set to go Live on Solana
2.52 Million Altcoins Are Ruining Crypto’s Future
Animoca Brands Valuation Tanks 75% In Two Years, Here’s Why
Crypto exchange BingX hacked for $43 million
Are The Big Players Losing Interest?
Hong Kong’s Securities Association Tips Authorities On Crypto Self-Regulation
Coinbase cbBTC Set to go Live on Solana
-

 Ethereum15 hours ago
Ethereum’s Price Dips, But Investors Seize The Opportunity To Stack Up More ETH
-

 Market19 hours ago
Bitcoin Mining Faces Tariff Challenges as Hashrate Hits New ATH
-
 Bitcoin17 hours ago
Strategy Adds 22,048 BTC for Nearly $2 Billion
-
 Market22 hours ago
Strategic Move for Trump Family in Crypto
-

 Market17 hours ago
BNB Breaks Below $605 As Bullish Momentum Fades – What’s Next?
-

 Market21 hours ago
Top Crypto Airdrops to Watch in the First Week of April
-
 Market16 hours ago
Trump Family Gets Most WLFI Revenue, Causing Corruption Fears
-
 Altcoin21 hours ago
$33 Million Inflows Signal Market Bounce