
Market
These 3 Lead in First Week of September

The first week of September 2024 saw altcoins struggle to achieve significant gains as the broader market stayed relatively quiet. However, a few assets from the top 100 by market capitalization managed to defy the trend, registering gains due to market interest and notable developments.
Among these are Helium (HNT), Starknet (STRK), and Uniswap (UNI), all of which have recorded notable upticks.
Helium (HNT)
HNT, the native token of Helium, the decentralized blockchain for the Internet of Things, climbed 19%. BeInCrypto’s analysis revealed no major developments behind the rise, similar to a pattern observed in August with other altcoin gainers.
From a technical perspective, the On Balance Volume (OBV) has been climbing since late August. OBV tracks cumulative volume to gauge buying and selling pressure; a drop indicates higher selling volume.
Read more: Best Crypto Exchanges With the Lowest Trading Fees
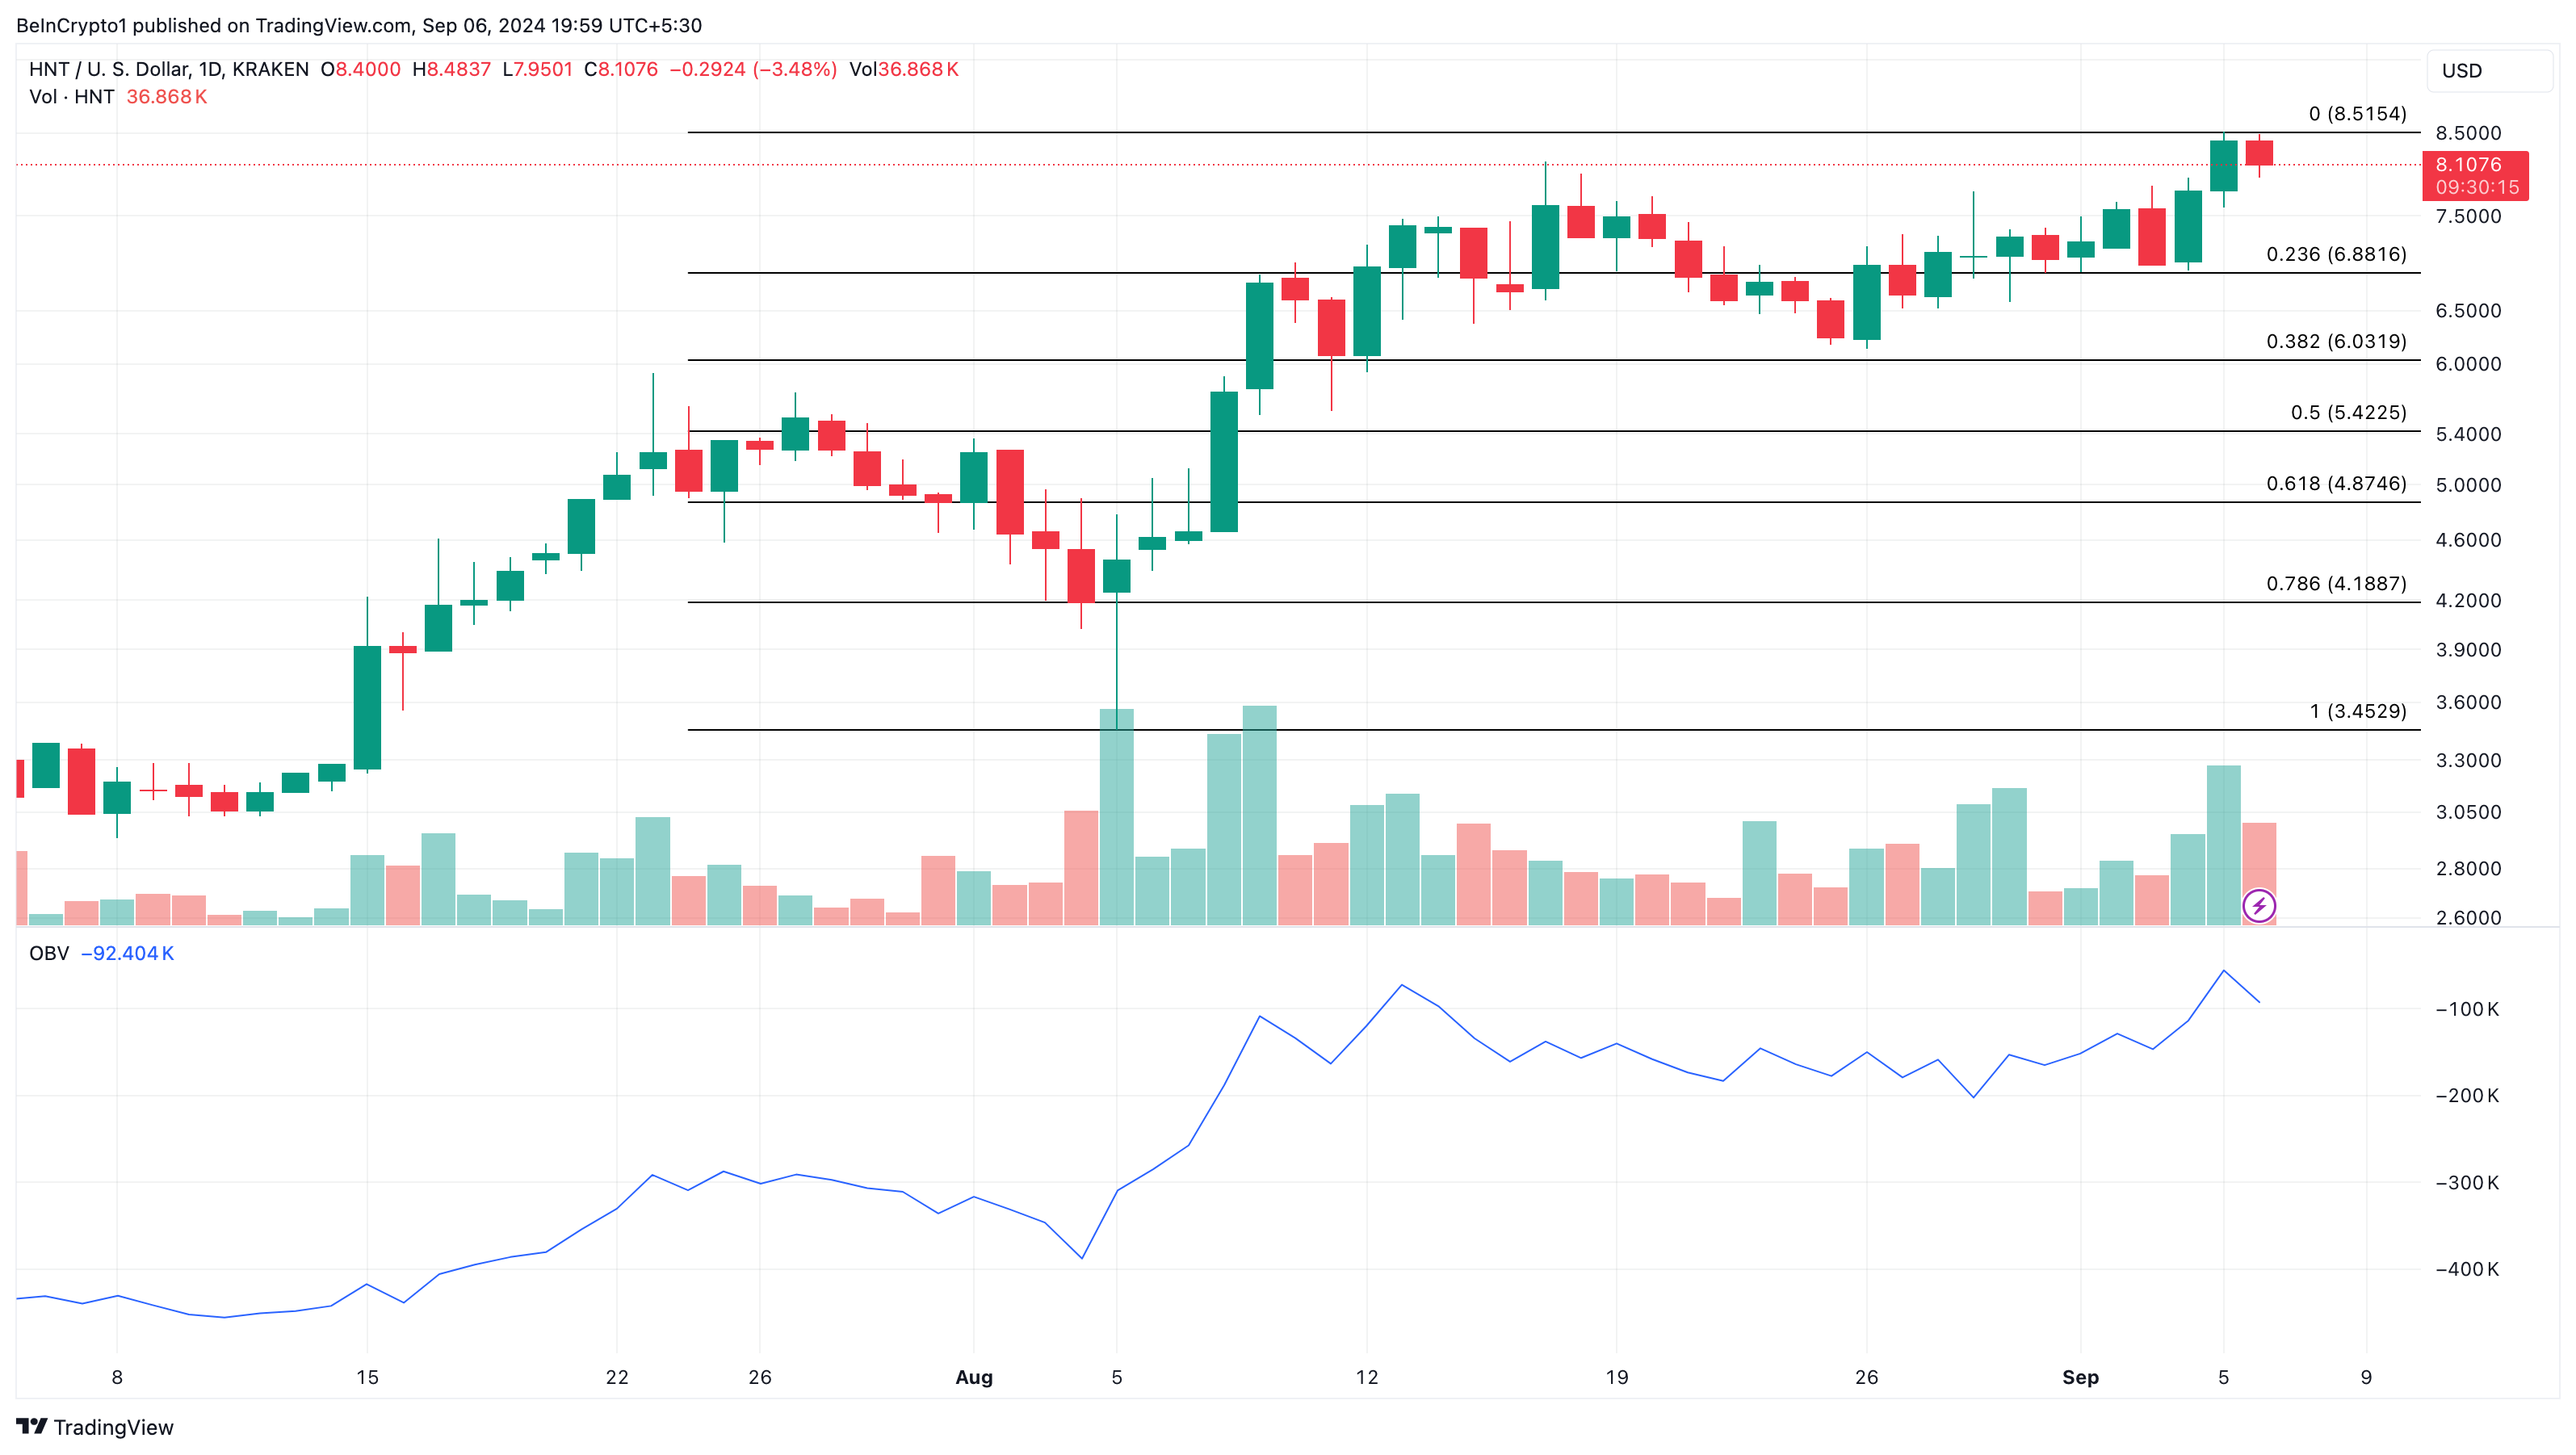
The rising OBV on the daily chart suggests increased accumulation, which played a key role in HNT’s rise above $8. If buying pressure continues, HNT could reach $8.51. However, if interest in the token weakens, its price may drop to $6.88.
Starknet (STRK)
STRK, the native cryptocurrency of the Ethereum Layer-2 blockchain, made a surprising appearance among the top altcoin gainers this week. Since its launch, STRK had struggled to post significant price gains.
However, the token surged to $0.40 shortly after Ethereum co-founder Vitalik Buterin transferred over 2 million STRK tokens to a new wallet. Currently, the altcoin is trading at $0.43, after briefly dipping to $0.39.
The Bull Bear Power (BBP) indicator shows that bullish momentum has once again surpassed bearish pressure, suggesting another potential upswing. Additionally, STRK has broken above its descending trendline, further supporting the bullish outlook.
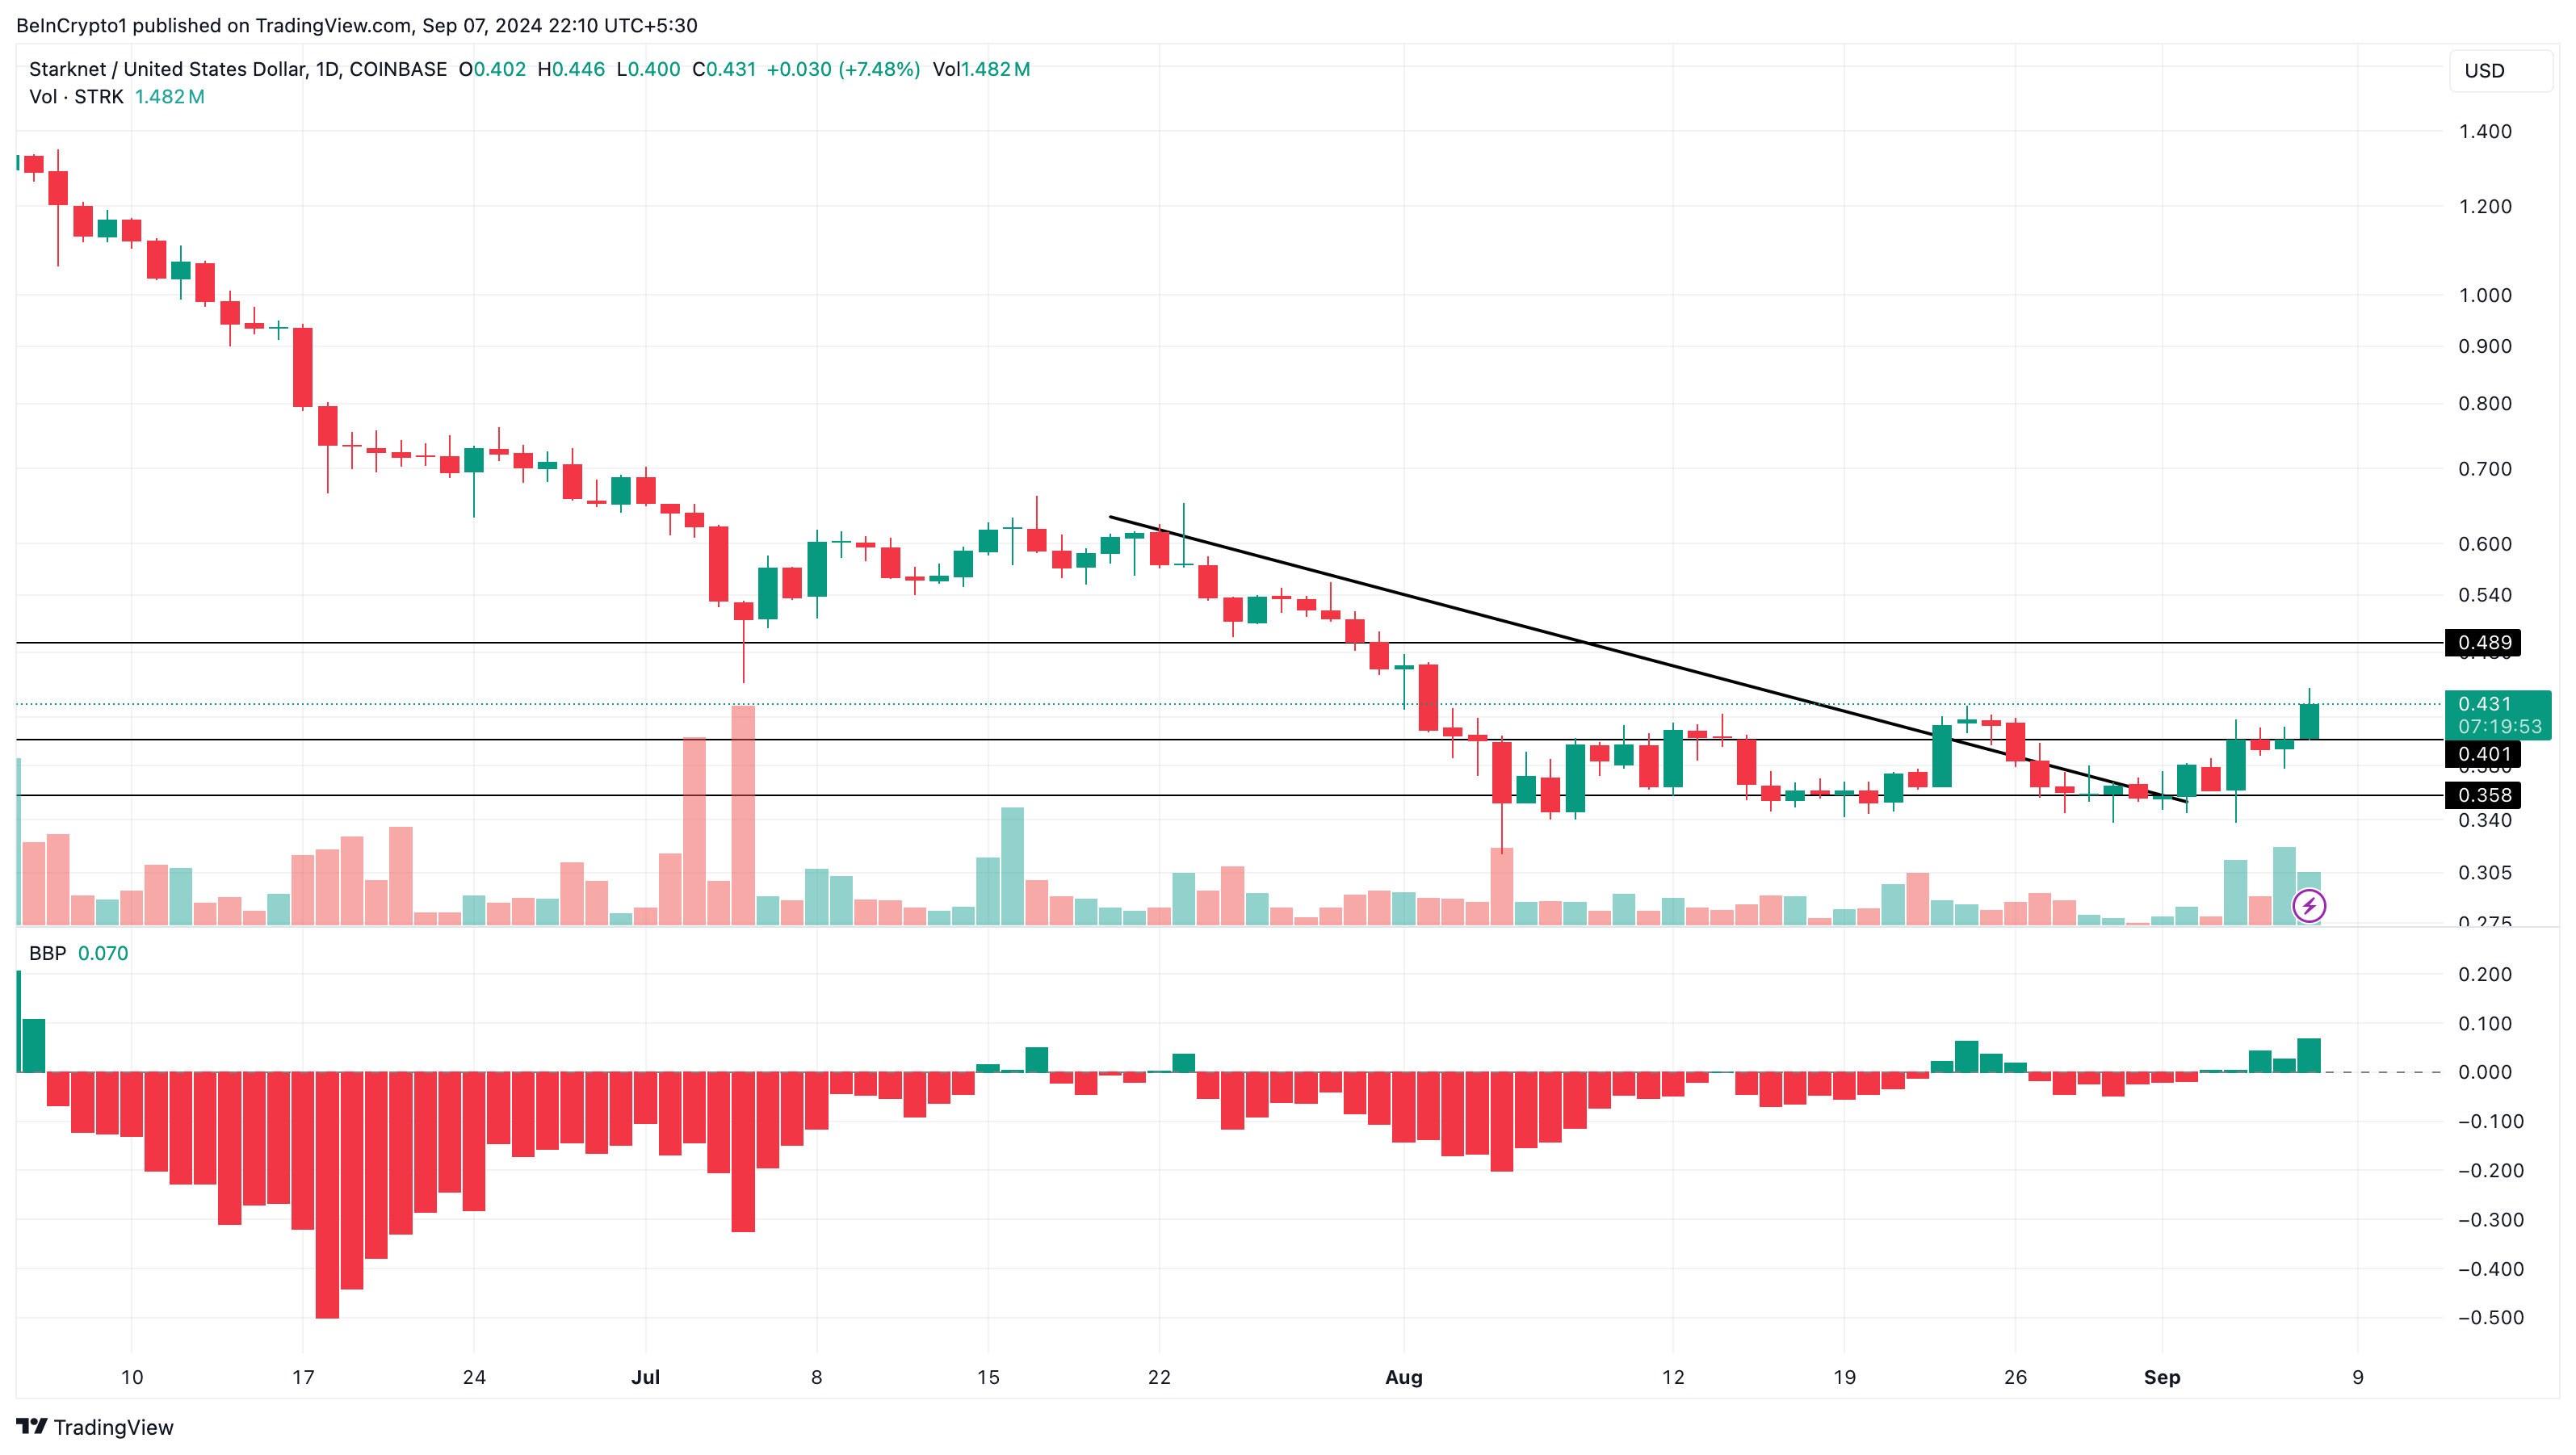
If sustained, STRK’s price might jump to $0.48. On the other hand, the cryptocurrency risks falling to an all-time low if it breaks below the support at $0.35.
Uniswap (UNI)
UNI’s inclusion in the biggest altcoin gainers list is connected to the blockchain protocol settlement with the Commodities Futures Trading Commission (CTFC). Moments after the development, the price jumped to $6.40, bringing the cumulative weekly increase to 8%.
As of this writing, UNI is trading at $6.22, having dropped from its weekly peak. On the daily chart, the altcoin is close to slipping below the 20-day Exponential Moving Average (EMA).
Typically, breaking above the EMA signals a bullish trend, but if UNI falls below this level, the price could dip below $6 and reach $5.60. The Relative Strength Index (RSI) also points to bearish momentum, reinforcing this downward outlook.
Read more: 11 Cryptos To Add To Your Portfolio Before Altcoin Season
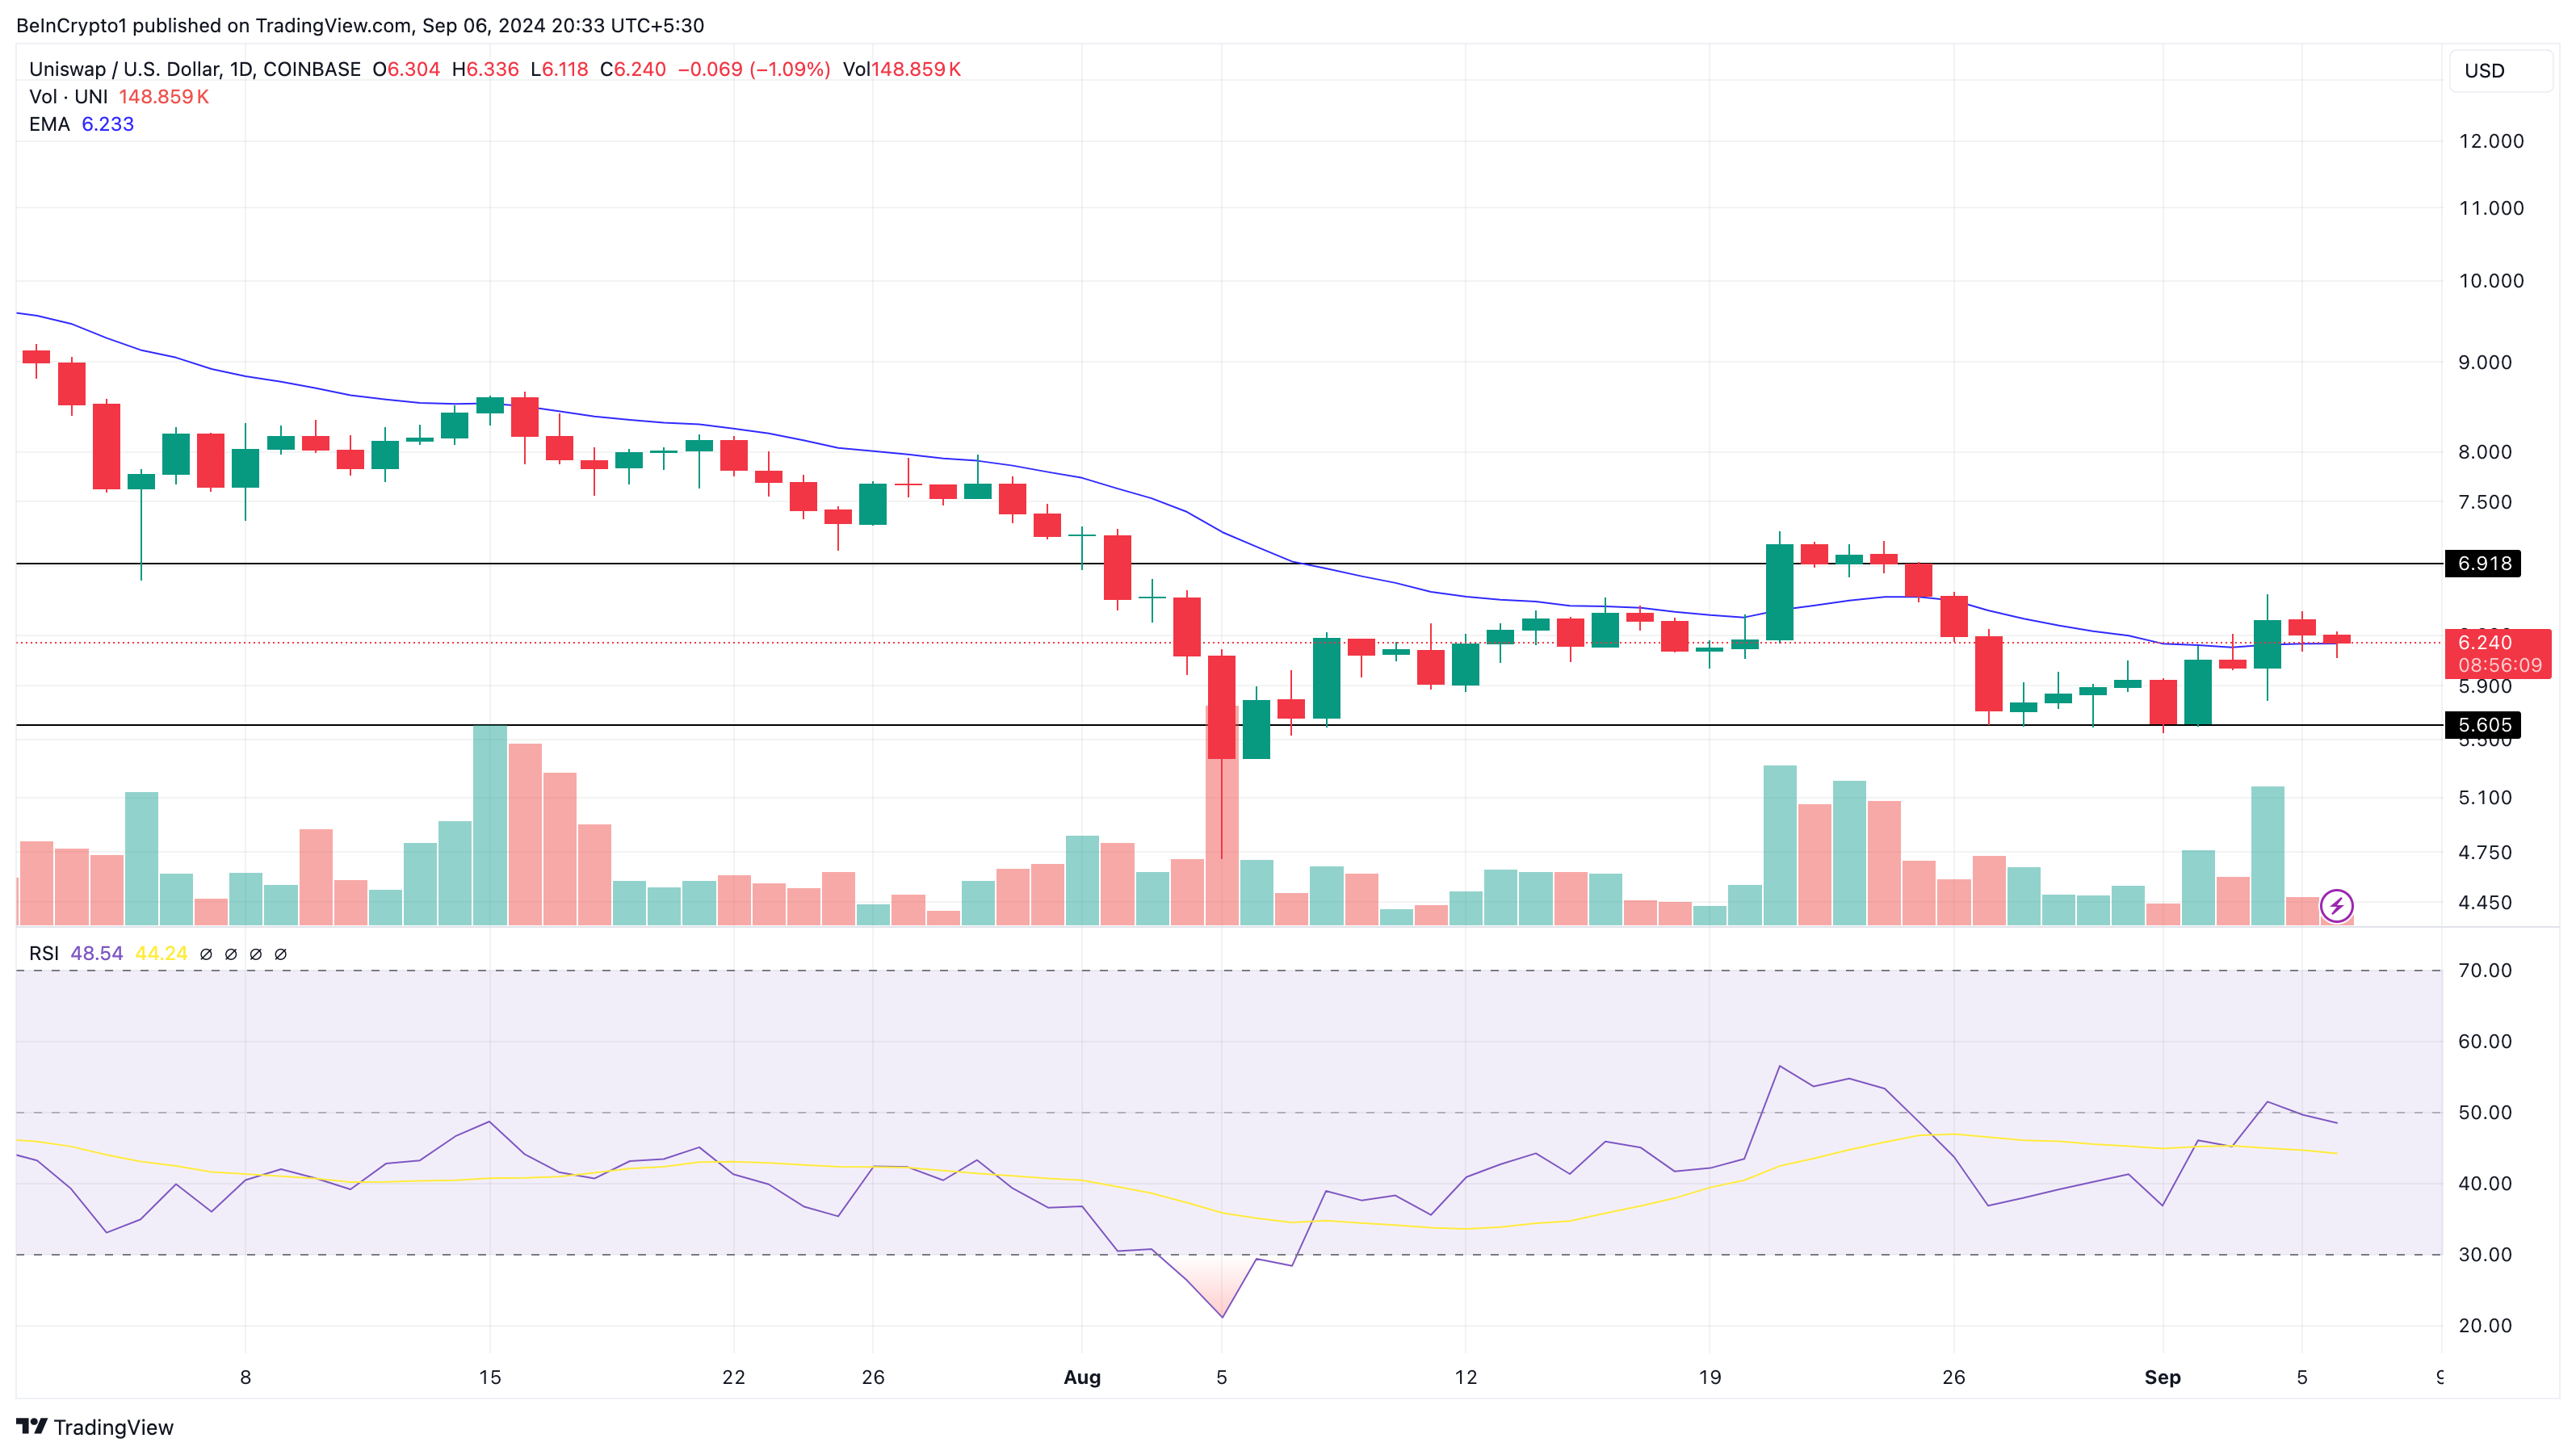
However, if a positive development for UNI emerges, this prediction could be invalidated, potentially pushing the price up to $6.91.
Disclaimer
In line with the Trust Project guidelines, this price analysis article is for informational purposes only and should not be considered financial or investment advice. BeInCrypto is committed to accurate, unbiased reporting, but market conditions are subject to change without notice. Always conduct your own research and consult with a professional before making any financial decisions. Please note that our Terms and Conditions, Privacy Policy, and Disclaimers have been updated.


Ripple’s (XRP) price rallied by 25% in the last 24 hours following Gary Gensler’s announcement that he would resign as the US Securities and Exchange Commission (SEC) chair on January 20, 2025.
This development comes as a relief to the popular “XRP Army,” which has had to deal with suppressed price action due to the Gensler-led SEC’s nonstop petitions against Ripple. But that is not all that happened.
Ripple Bears Face Notable Liquidation Following Gensler’s Notification
Gensler’s announcement appears to be a positive development for the broader crypto market. But XRP holders seemed to benefit the most. This was particularly significant given the unresolved Ripple-SEC legal issues that have persisted throughout the SEC Chair’s tenure.
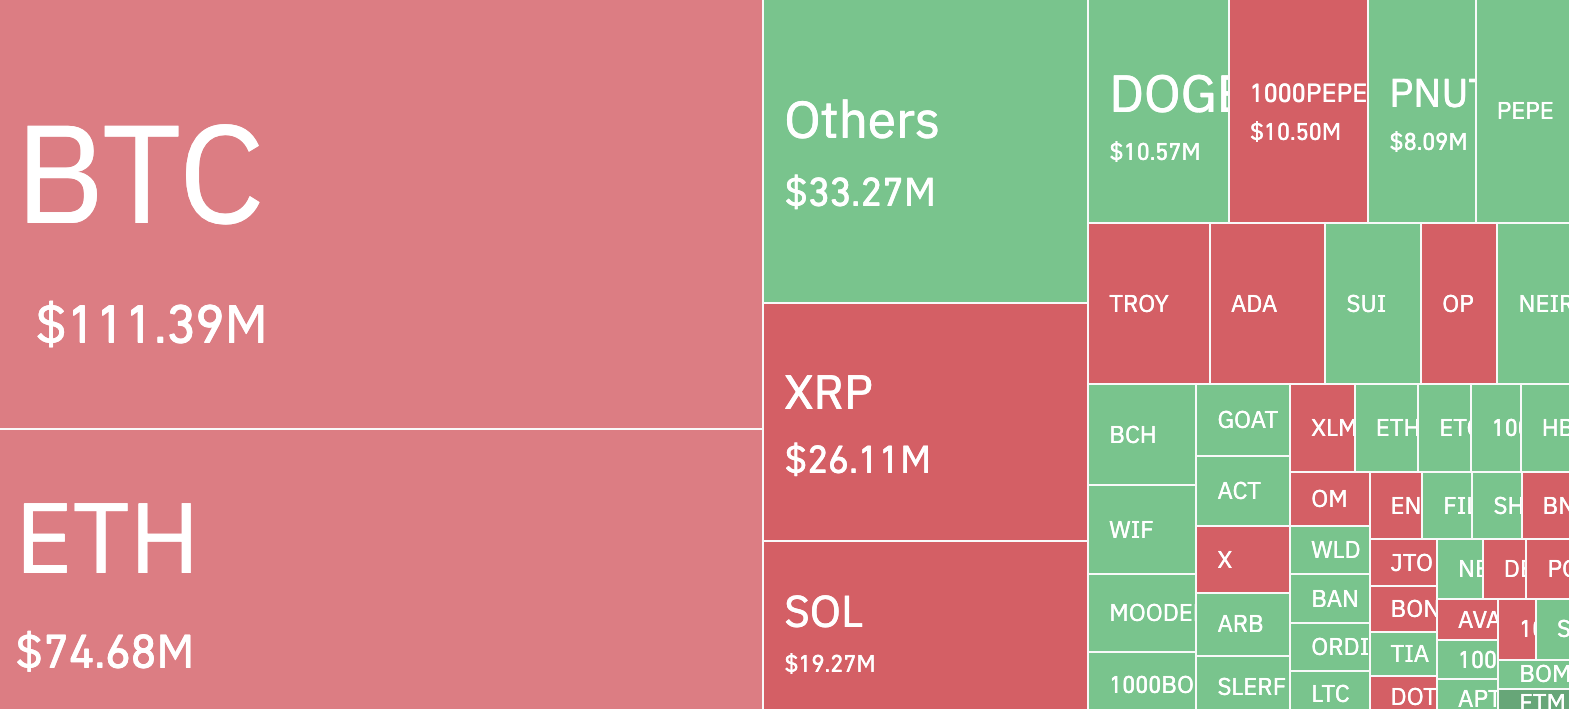
As a result, it came as no surprise that XRP price rallied and outpaced those of any other cryptocurrency in the top 10. Furthermore, the development triggered liquidations totaling $26.11 million over the last 24 hours.
Liquidation occurs when a trader fails to meet the margin requirements for a leveraged position. This forces the exchange to sell off their assets to prevent further losses. In XRP’s case, the liquidation primarily resulted in a short squeeze.
A short squeeze happens when a large number of short positions (traders betting on price declines) are forced to close, driving the price higher as they rush back to buy back the asset.
At press time, XRP trades at $1.40 and currently has a market cap of $80.64 billion. With Gensler almost gone, crypto lawyer John Deaton noted that XRP price gains could be higher, and the market cap could climb to $100 billion.
“XRP soon will achieve a $100B market cap. Times are changing,” Deaton wrote on X.
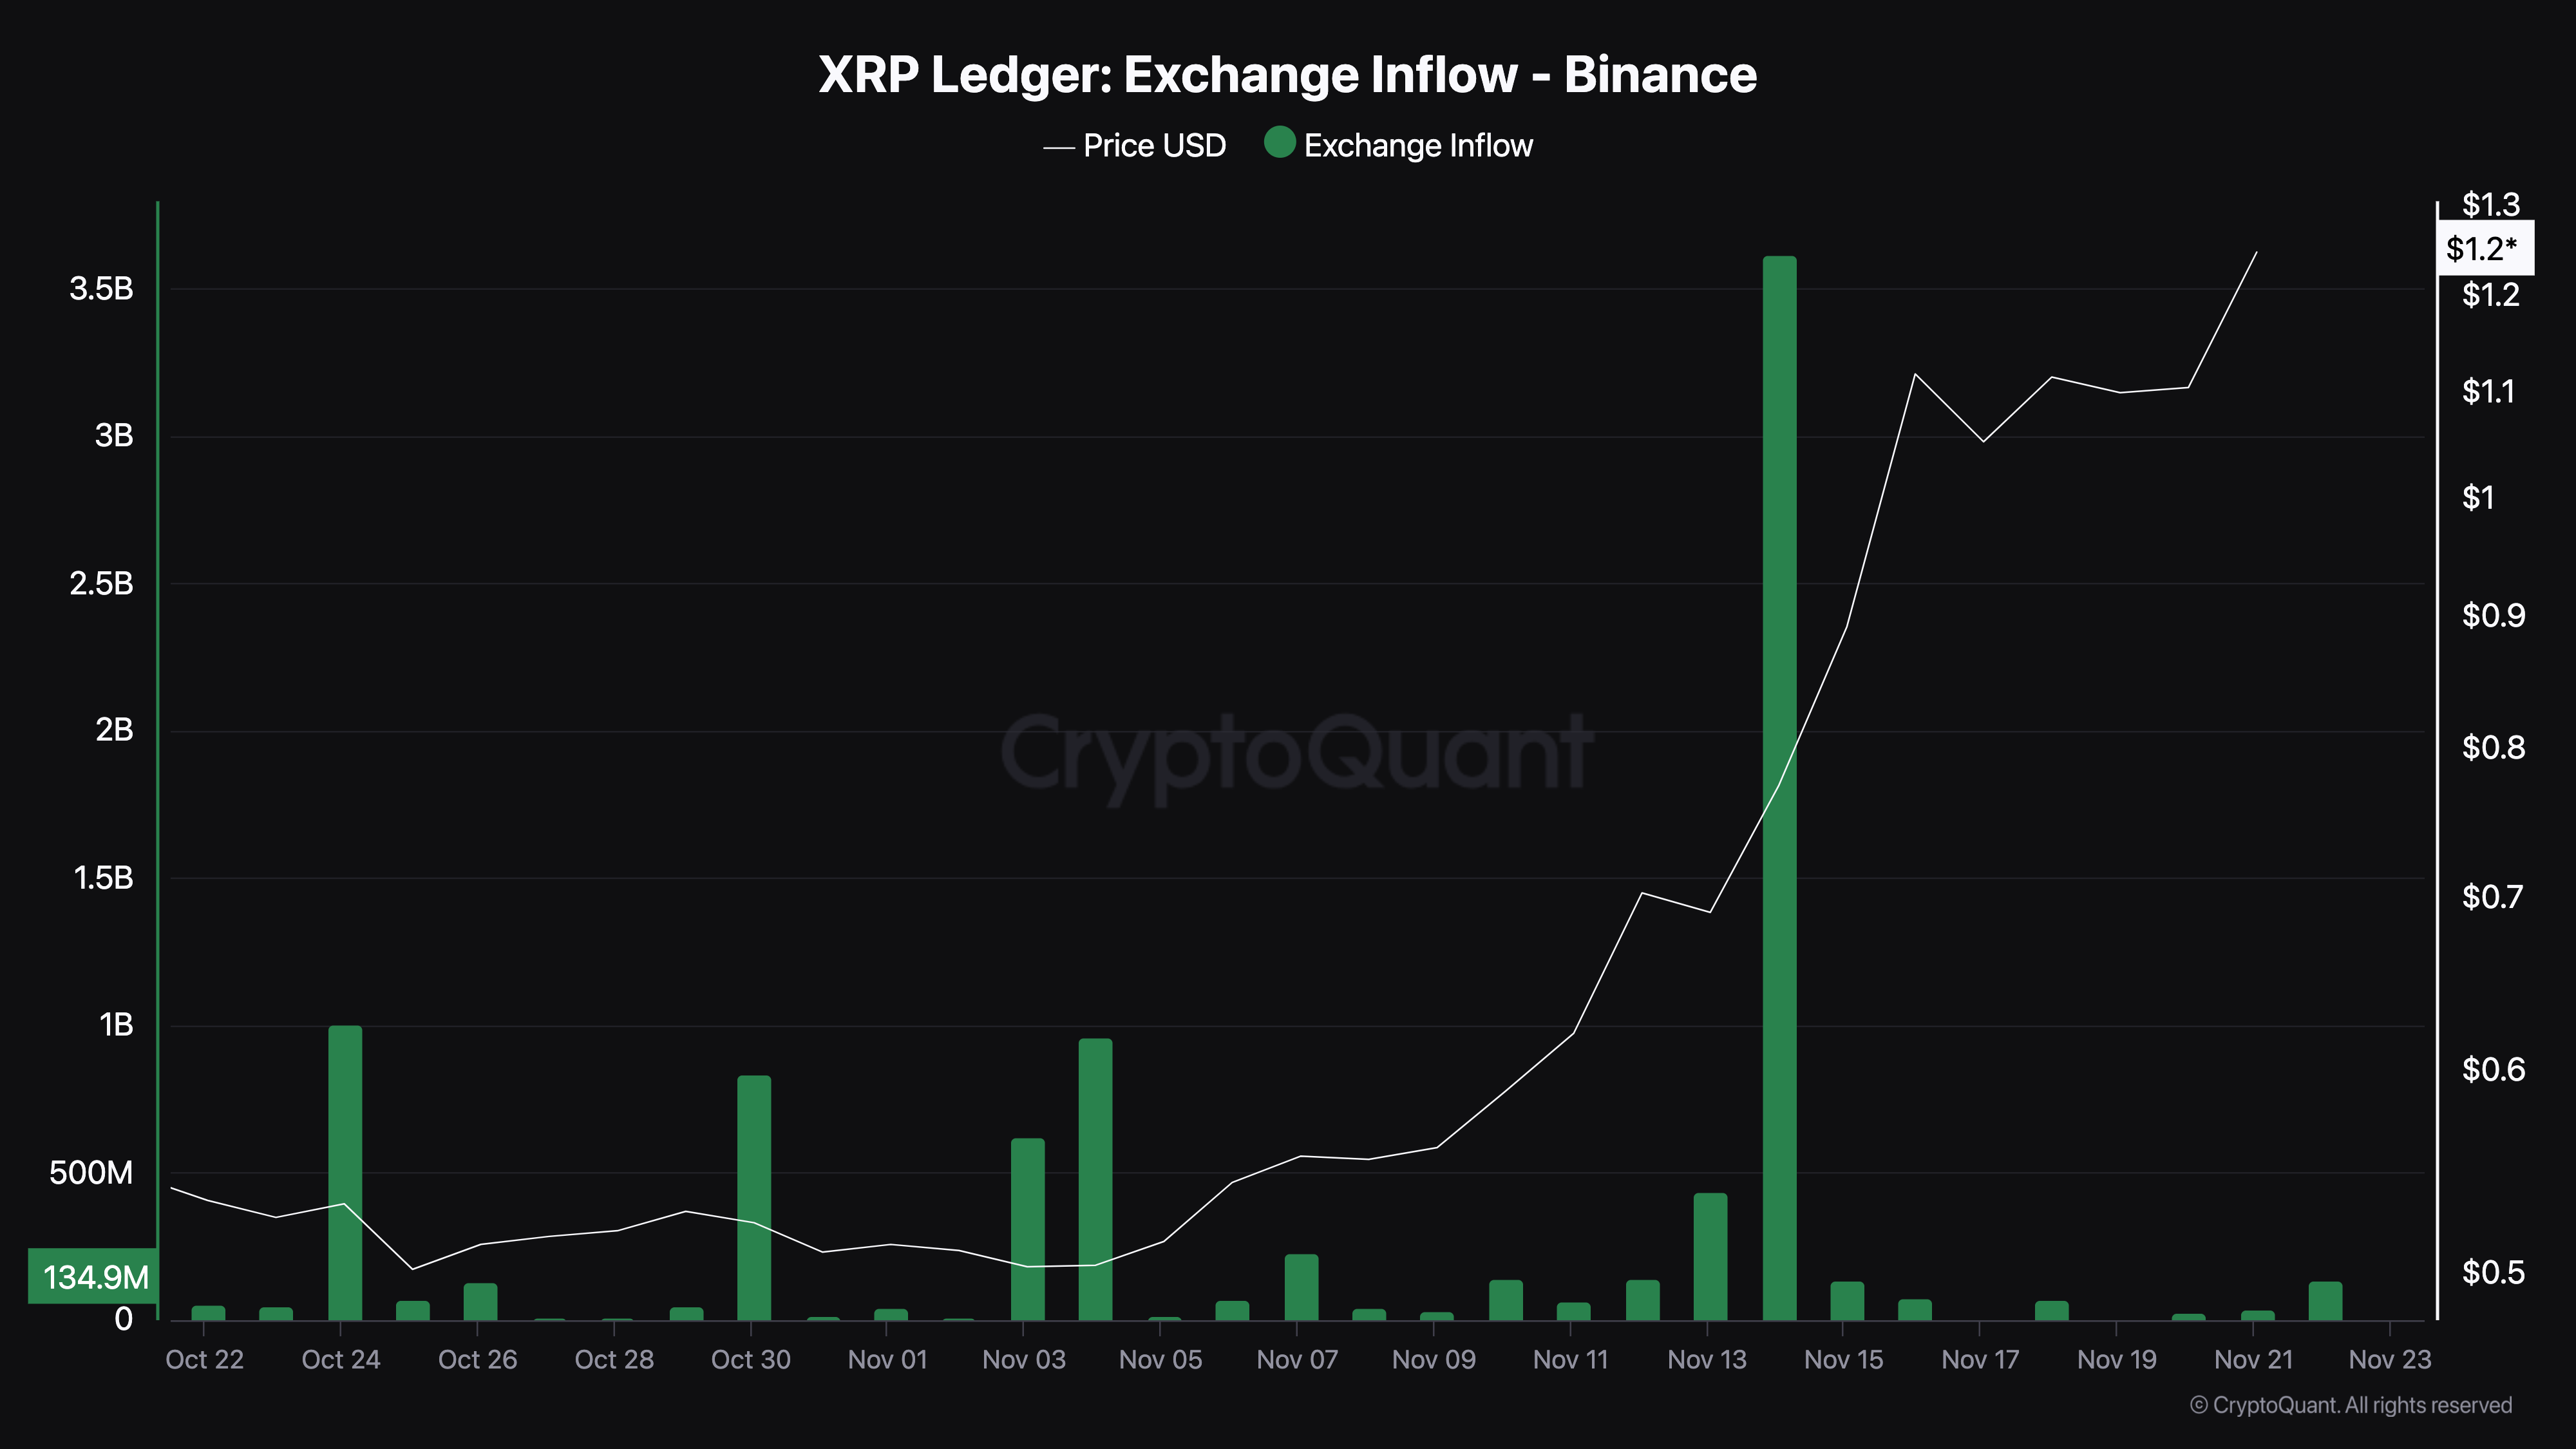
Meanwhile, CryptoQuant data shows that the total number of XRP sent into exchange has significantly decreased. Typically, high values indicate increased selling pressure in the spot market. This is because it suggests that more assets are being offloaded, potentially driving prices lower.
However, since it is low, XRP holders are refraining from selling. If this remains the case, the token’s value could rise higher than $1.40.
XRP Price Prediction: $2 Coming?
According to the 4-hour chart, XRP has been trading within a range of $1.04 to $1.17 since November 18. This sideways movement has resulted in the formation of a bull flag — a bullish chart pattern that signals potential upward momentum.
The bull flag begins with a sharp price surge, forming the flagpole, driven by significant buying pressure that outpaces sellers. This is followed by a consolidation phase, where the price retraces slightly and moves within parallel trendlines, creating the flag structure.
Yesterday, XRP broke out of this pattern, signaling that bulls have seized control of the market. If this momentum persists, XRP’s price could surpass $1.50, potentially approaching the $2 threshold.
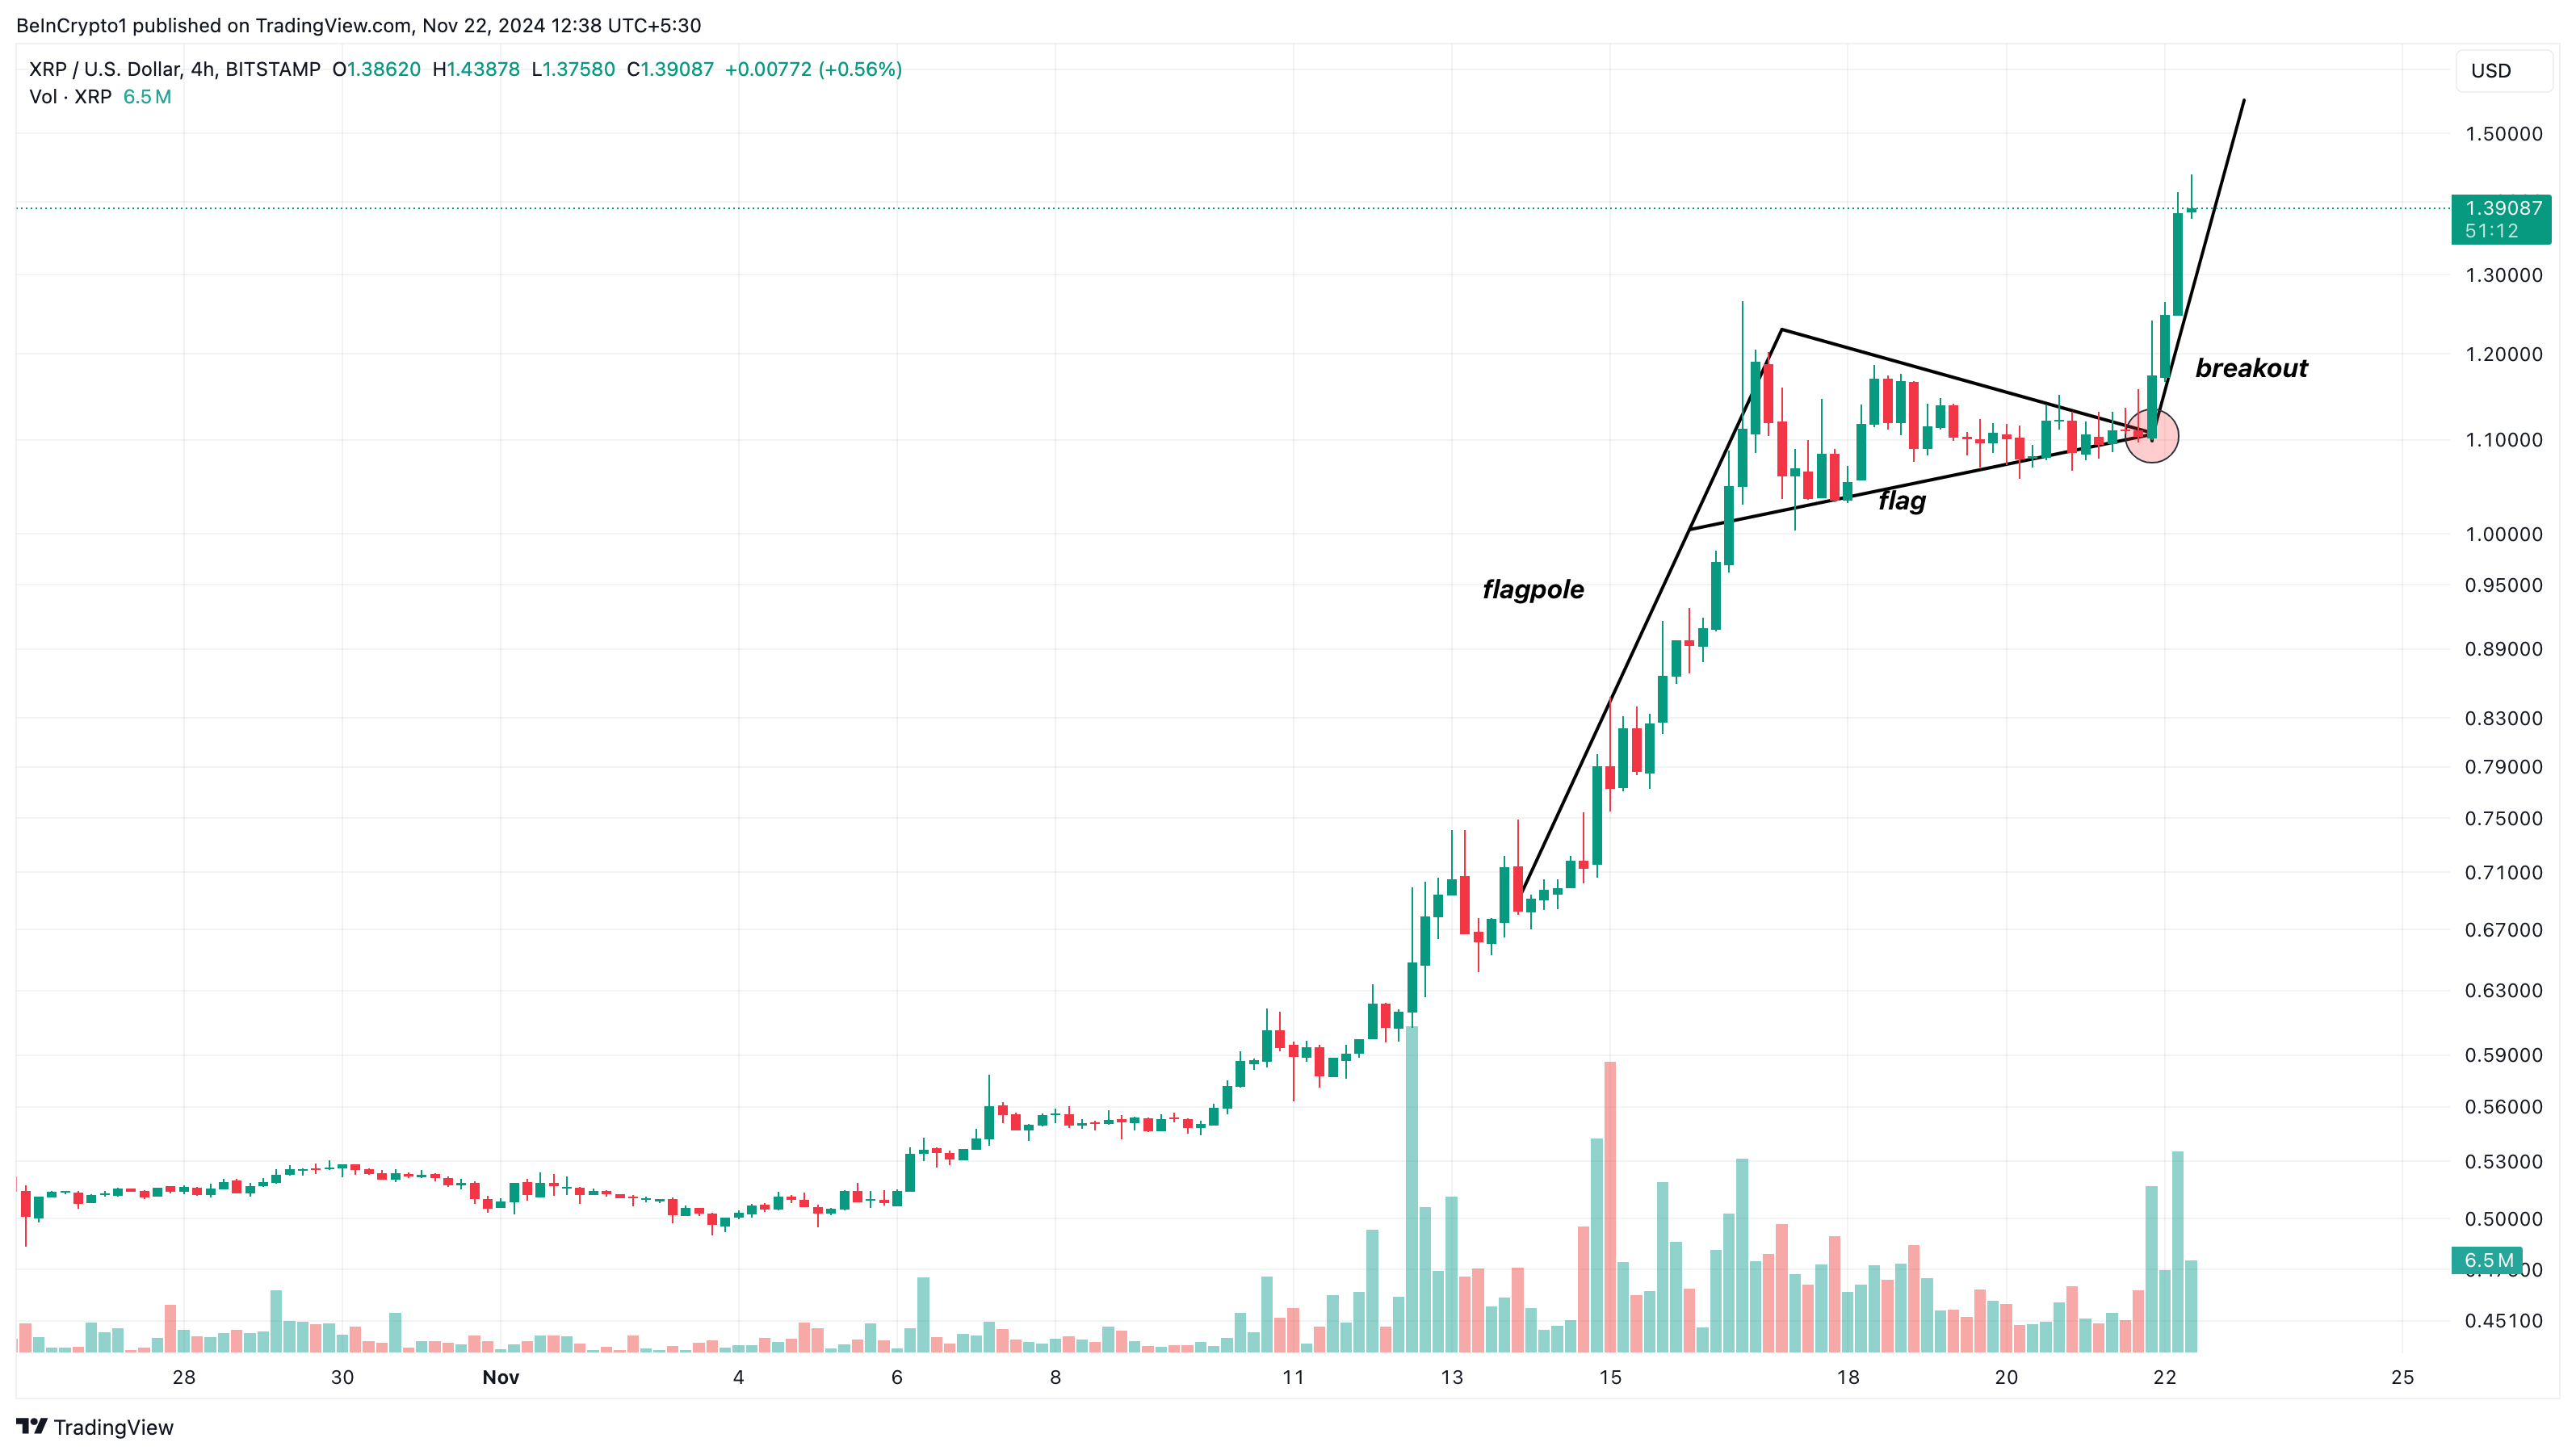
However, this bullish scenario hinges on market behavior. If holders decide to secure profits, selling pressure could push XRP’s price below $1, erasing recent gains.
Disclaimer
In line with the Trust Project guidelines, this price analysis article is for informational purposes only and should not be considered financial or investment advice. BeInCrypto is committed to accurate, unbiased reporting, but market conditions are subject to change without notice. Always conduct your own research and consult with a professional before making any financial decisions. Please note that our Terms and Conditions, Privacy Policy, and Disclaimers have been updated.
Dogecoin is consolidating gains above the $0.380 resistance against the US Dollar. DOGE is holding gains and eyeing more upsides above $0.400.
- DOGE price started a fresh increase above the $0.3750 resistance level.
- The price is trading above the $0.3800 level and the 100-hourly simple moving average.
- There was a break above a short-term contracting triangle with resistance at $0.390 on the hourly chart of the DOGE/USD pair (data source from Kraken).
- The price could continue to rally if it clears the $0.400 and $0.4080 resistance levels.
Dogecoin Price Eyes More Upsides
Dogecoin price remained supported above the $0.350 level and recently started a fresh increase like Bitcoin and Ethereum. DOGE was able to clear the $0.3650 and $0.3750 resistance levels.
The price climbed above the 50% Fib retracement level of the downward move from the $0.4208 swing high to the $0.3652 low. Besides, there was a break above a short-term contracting triangle with resistance at $0.390 on the hourly chart of the DOGE/USD pair.
Dogecoin price is now trading above the $0.3750 level and the 100-hourly simple moving average. Immediate resistance on the upside is near the $0.3950 level or the 61.8% Fib retracement level of the downward move from the $0.4208 swing high to the $0.3652 low.

The first major resistance for the bulls could be near the $0.400 level. The next major resistance is near the $0.4080 level. A close above the $0.4080 resistance might send the price toward the $0.4200 resistance. Any more gains might send the price toward the $0.4500 level. The next major stop for the bulls might be $0.500.
Are Dips Supported In DOGE?
If DOGE’s price fails to climb above the $0.400 level, it could start a downside correction. Initial support on the downside is near the $0.3850 level. The next major support is near the $0.3750 level.
The main support sits at $0.3550. If there is a downside break below the $0.3550 support, the price could decline further. In the stated case, the price might decline toward the $0.3200 level or even $0.300 in the near term.
Technical Indicators
Hourly MACD – The MACD for DOGE/USD is now gaining momentum in the bullish zone.
Hourly RSI (Relative Strength Index) – The RSI for DOGE/USD is now above the 50 level.
Major Support Levels – $0.3850 and $0.3750.
Major Resistance Levels – $0.4000 and $0.4200.
On Friday, Solana (SOL) soared to a new all-time high (ATH), now trading at approximately $261. This breakthrough surpasses its previous peak set in November 2021.
Solana’s rise to a new ATH marks an increase of over 32 times from its lows recorded in December 2022.
Solana Hits All-Time High as Gary Gensler Plans Resignation
Solana’s path to this new high has been anything but smooth. After reaching its previous high in 2021, the platform faced a downturn in 2022 amid a broader crypto bear market, further exacerbated by technical issues and network downtimes.
The collapse of FTX in November 2022 pushed Solana’s price down to around $8.

However, Solana has since made a remarkable recovery, increasing more than 32-fold from its low. Now, Solana enthusiasts believe that SOL could eventually outpace Ethereum (ETH) in market capitalization.
“Solana has been at an all-time high by market cap for a while actually. Now, we’re finally in price discovery. The flippening is coming,” Birch, the founder of PathCrypto, said.
The surge in Solana’s market value coincides with the news of SEC Chairman Gary Gensler’s planned resignation, slated for January 20, 2025, as Donald Trump assumes office.
Known for his strict regulatory stance on cryptocurrencies, Gensler’s departure signals a potential shift toward a more crypto-friendly administration. Consequently, this political change is stoking speculations about the approval of a Solana exchange-traded fund (ETF). According to Fox Business journalist Eleanor Terrett, the SEC has begun engaging with issuers to explore the possibility of a Solana ETF.
“Talks between SEC staff and issuers looking to launch a Solana spot ETF are “progressing” with the SEC now engaging on S-1 applications. Recent engagement from staff, coupled with the incoming pro-crypto administration, is sparking a renewed sense of optimism that a Solana ETF could be approved sometime in 2025,” Terrett claimed.
Previous efforts to launch a Solana ETF were stalled by regulatory roadblocks, often stopping early in the process. However, the changing political environment and the SEC’s increased openness have reignited hopes within the crypto community. Recent filings for a Solana ETF by Canary Capital and BitWise reflect a growing interest and anticipation for regulatory approval.
Despite these encouraging developments, the odds of a Solana ETF approval in 2024 remain low, with Polymarket estimates placing it at around 4%.

Meanwhile, the crypto community is also closely watching Bitcoin as it approaches the highly anticipated $100,000 mark. On Friday, Bitcoin recorded a new high of about $99,300. This milestone is viewed as a pivotal moment for Bitcoin and could impact other cryptocurrencies, including Solana.
Disclaimer
In adherence to the Trust Project guidelines, BeInCrypto is committed to unbiased, transparent reporting. This news article aims to provide accurate, timely information. However, readers are advised to verify facts independently and consult with a professional before making any decisions based on this content. Please note that our Terms and Conditions, Privacy Policy, and Disclaimers have been updated.

This Is Why XRP Price Rallied By 25% and Could Soon Hit $2

Hidden Bullish Divergence Appears On Dogecoin Price Chart, Here’s What To Expect Next

Dogecoin (DOGE) Shows Renewed Energy: Rally Incoming?

XRP Price Rally to $2 As Paul Atkins Leads to Replace US SEC Chair Gary Gensler

Solana Hits New All-Time High After 3 Years

Bitcoin’s Put-to-Call Ratio Tops 1.0: Bearish Signs Ahead?

2.52 Million Altcoins Are Ruining Crypto’s Future

Animoca Brands Valuation Tanks 75% In Two Years, Here’s Why

Crypto exchange BingX hacked for $43 million

Are The Big Players Losing Interest?

Hong Kong’s Securities Association Tips Authorities On Crypto Self-Regulation

Coinbase cbBTC Set to go Live on Solana
2.52 Million Altcoins Are Ruining Crypto’s Future
Animoca Brands Valuation Tanks 75% In Two Years, Here’s Why
Crypto exchange BingX hacked for $43 million
Are The Big Players Losing Interest?
Hong Kong’s Securities Association Tips Authorities On Crypto Self-Regulation
Coinbase cbBTC Set to go Live on Solana
-

 Market22 hours ago
South Korea Unveils North Korea’s Role in Upbit Hack
-

 Bitcoin17 hours ago
Marathon Digital Raises $1B to Expand Bitcoin Holdings
-

 Regulation12 hours ago
UK to unveil crypto and stablecoin regulatory framework early next year
-
 Market17 hours ago
ETH/BTC Ratio Plummets to 42-Month Low Amid Bitcoin Surge
-
 Altcoin20 hours ago
Sui Network Back Online After 2-Hour Outage, Price Slips
-
 Altcoin19 hours ago
Dogecoin Whale Accumulation Sparks Optimism, DOGE To Rally 9000% Ahead?
-
 Altcoin22 hours ago
Vitalik Buterin, Coinbase’s Jesse Pollack Buy Super Anon (ANON) Tokens On Base
-
 Altcoin17 hours ago
5 Key Indicators To Watch For Ethereum Price Rally To $10K