
Market
Cardano Price Sees Short-Term Gains After Chang Hard Fork

Cardano’s (ADA) much-anticipated Chang hard fork has put some of its holders in gains in the past 24 hours. Transactions involving the altcoin have returned more gains than losses during that period.
However, this may be temporary as the altcoin eyes its August 5 low.
Cardano Upgrade Puts Holders in Profit
As reported earlier, Cardano’s Chang hard fork, which occurred on September 1, was a “sell the news” event. Its whale investors reduced their holdings by selling large amounts of ADA after the upgrade was implemented, putting downward pressure on the price.
However, the tides have since changed as daily transactions involving the altcoin have begun to yield profits. This is evident in ADA’s positive ratio of daily transaction volume in profit to loss. On Thursday, this sits at 1.15, indicating that for every ADA transaction that ends in a loss, 1.14 transactions have returned a profit.
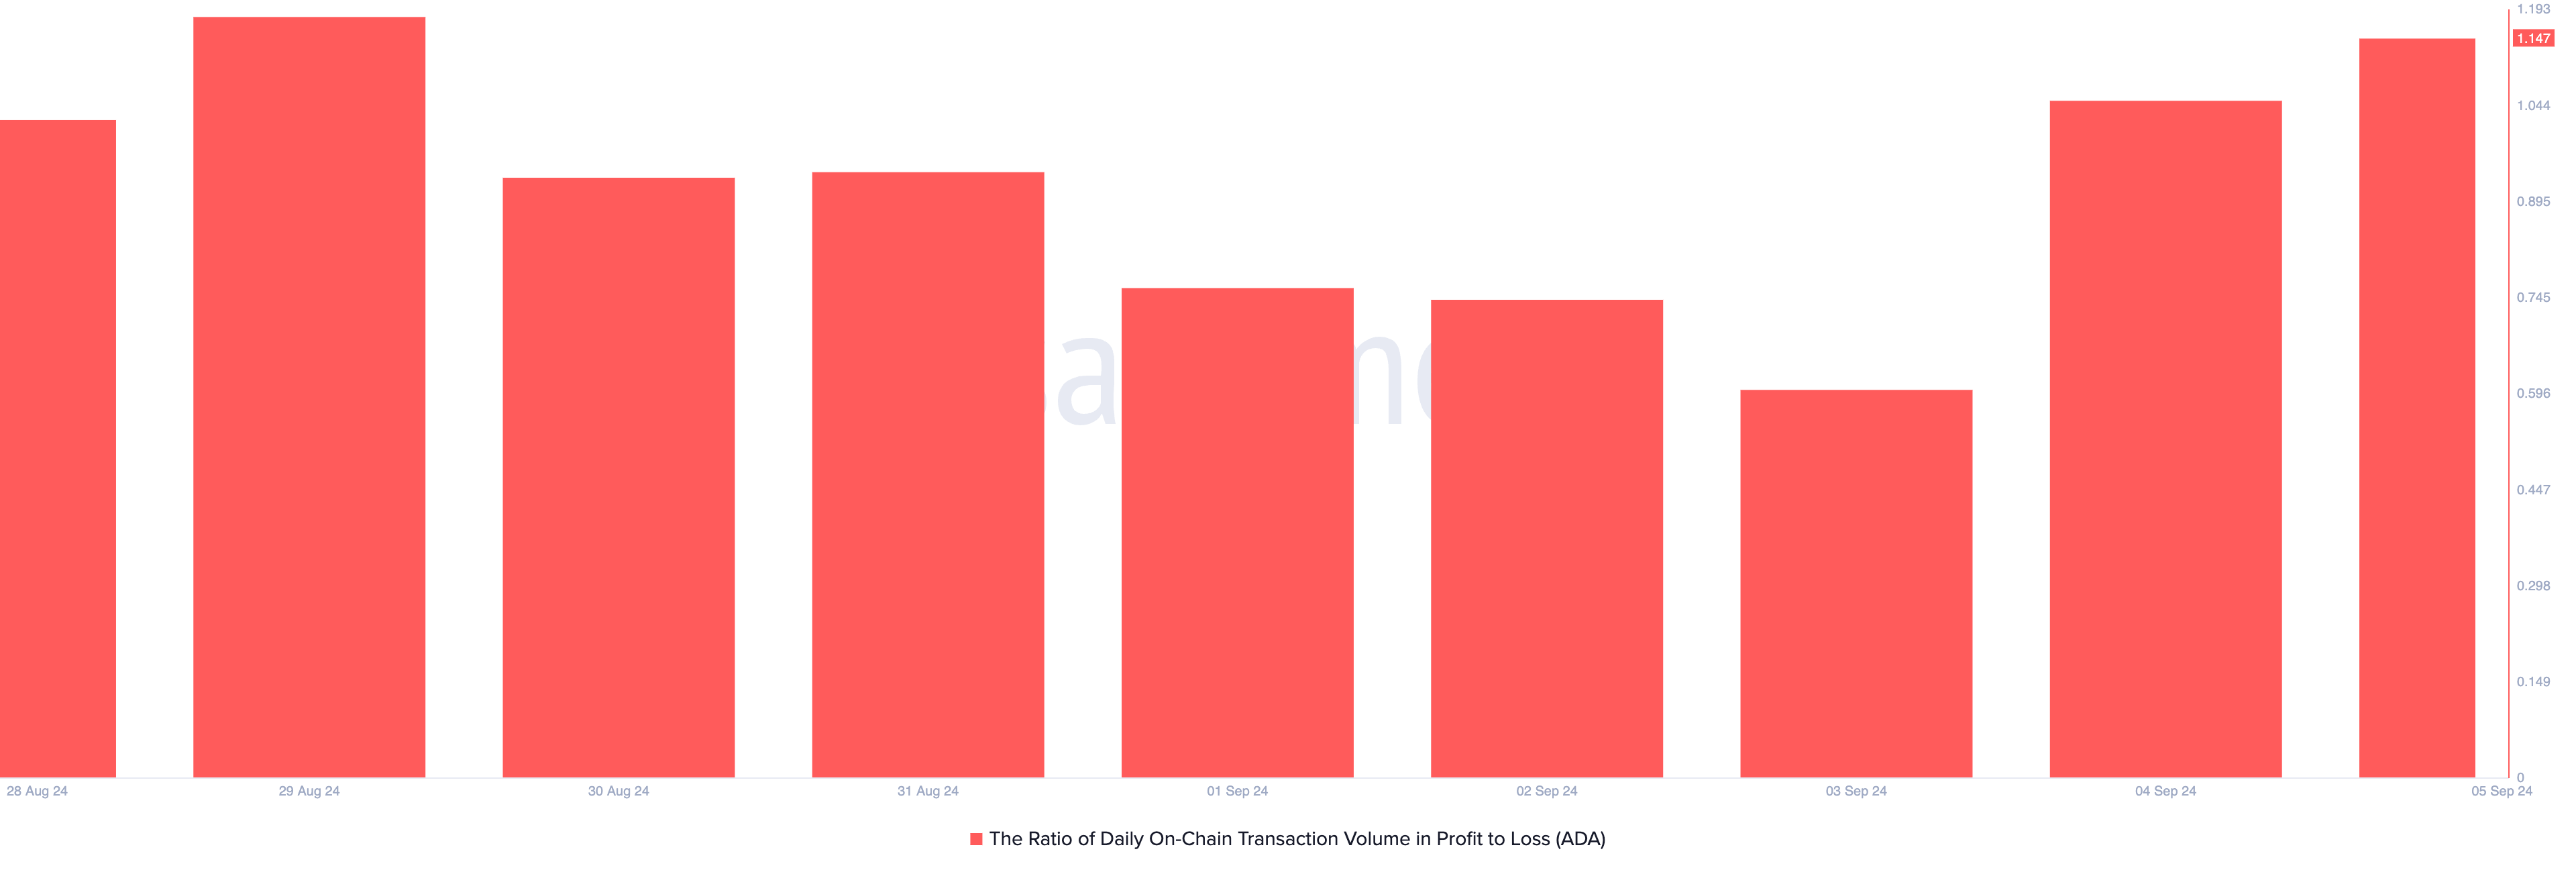
The reason for this is not far-fetched. ADA’s price decline has slowed over the last 24 hours, giving traders an opportunity to sell for profits if they bought at lower prices. ADA is currently trading at $0.32, reflecting a 0.39% uptick in that time frame.
While this may prompt a rally in new demand for ADA, traders must understand that its current uptick may be shortlived as indicated by the coin’s negative price daily active address (DAA) divergence. This indicator, which tracks whether a corresponding network activity supports an asset’s price movement, is -30.93% at press time.
Read More: Cardano (ADA) Price Prediction 2024/2025/2030
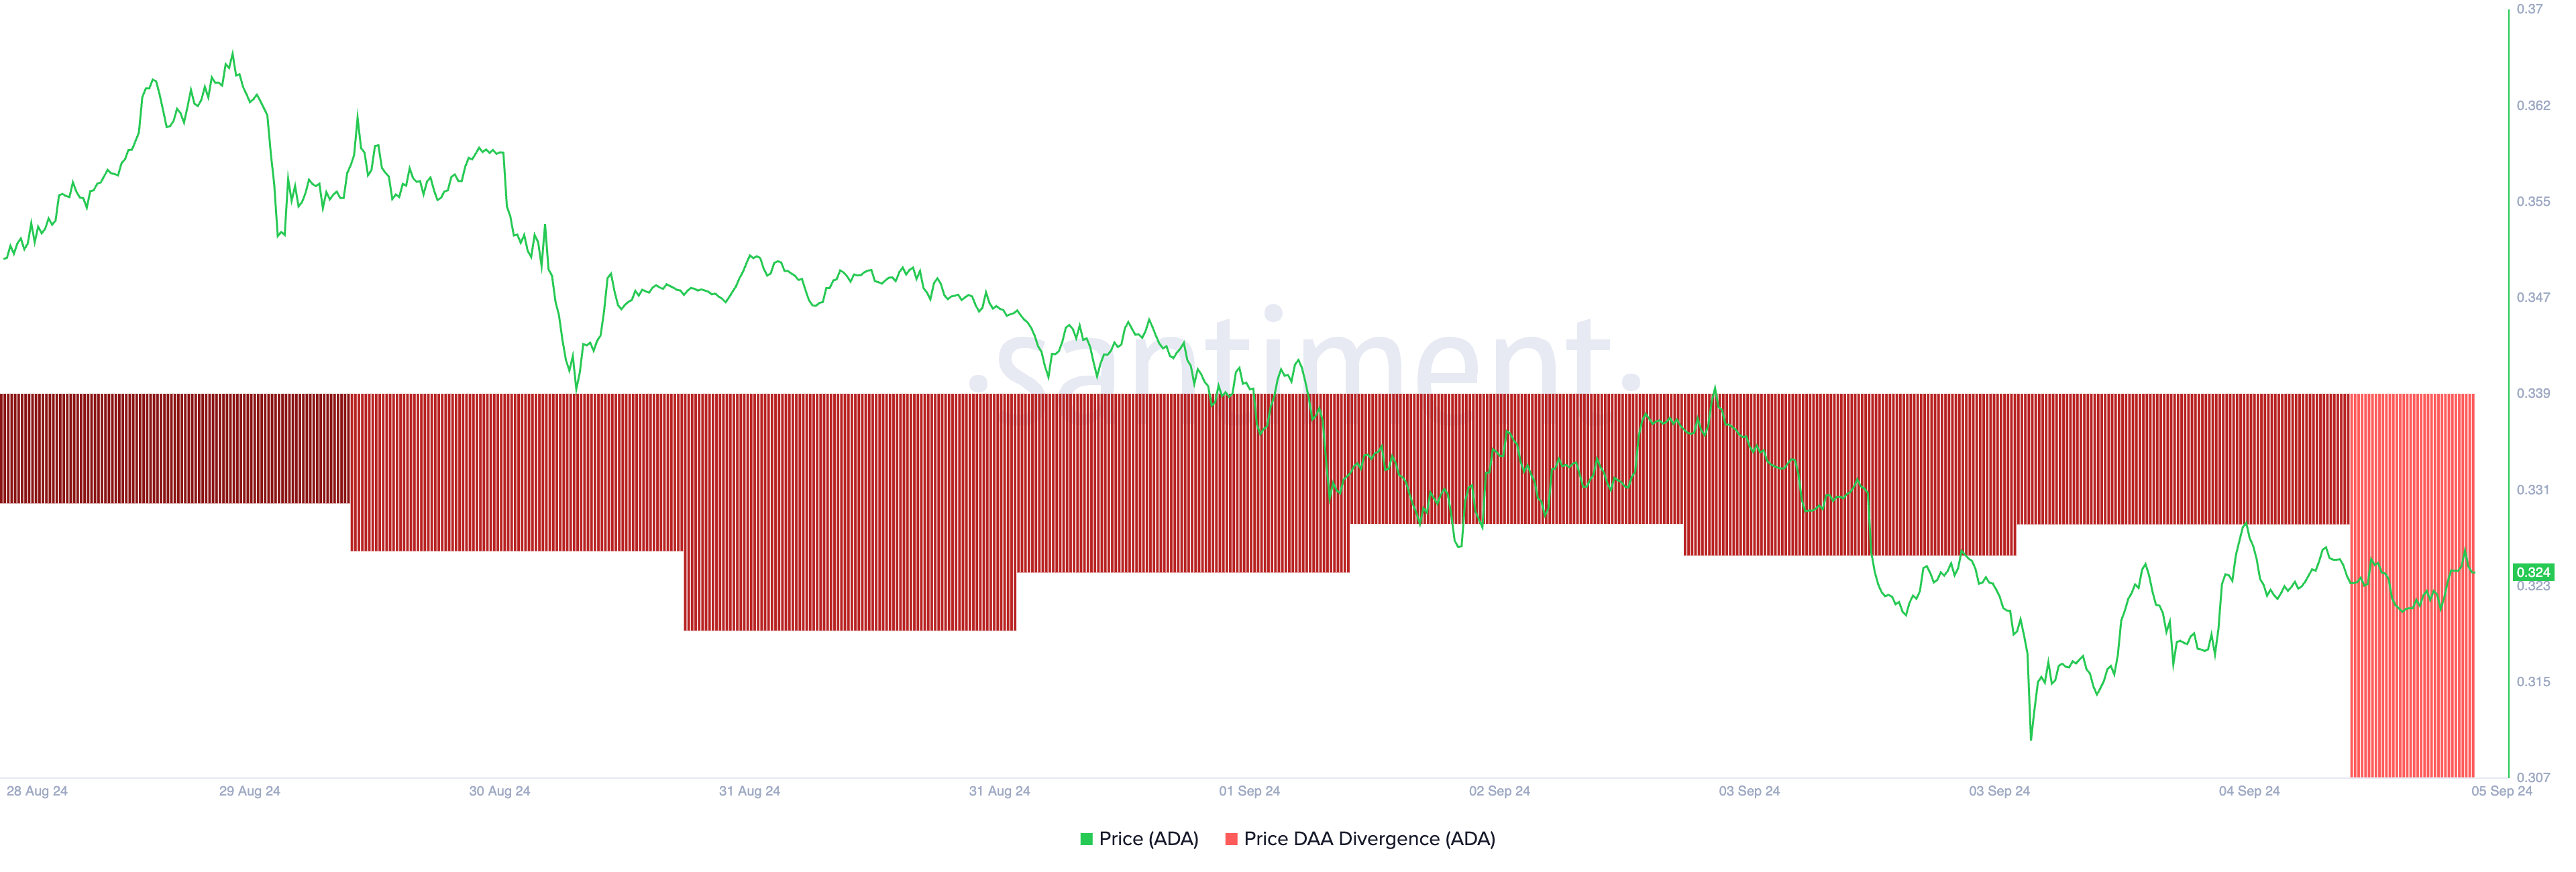
When an asset’s price climbs while its price DAA divergence remains negative, it suggests only a few unique addresses are actively trading. This is usually interpreted as a warning sign that the price uptick is due to speculative activity or trading by a small group of investors or whales who are artificially inflating the asset’s price.
ADA Price Prediction: The Troubles Are Far From Over
Although ADA has logged some uptick over the past 24 hours, it is still trailed by bearish bias. This is clear from the position of the dots of its Parabolic Stop and Reverse (SAR) indicator. At press time, these sit above ADA’s price.
When this indicator, which helps identify an asset’s trend direction and potential reversals, is set in this manner, it signals a continued market decline. This suggests that the asset’s price has been falling, and the downtrend may persist.
Read more: How To Buy Cardano (ADA) and Everything You Need To Know
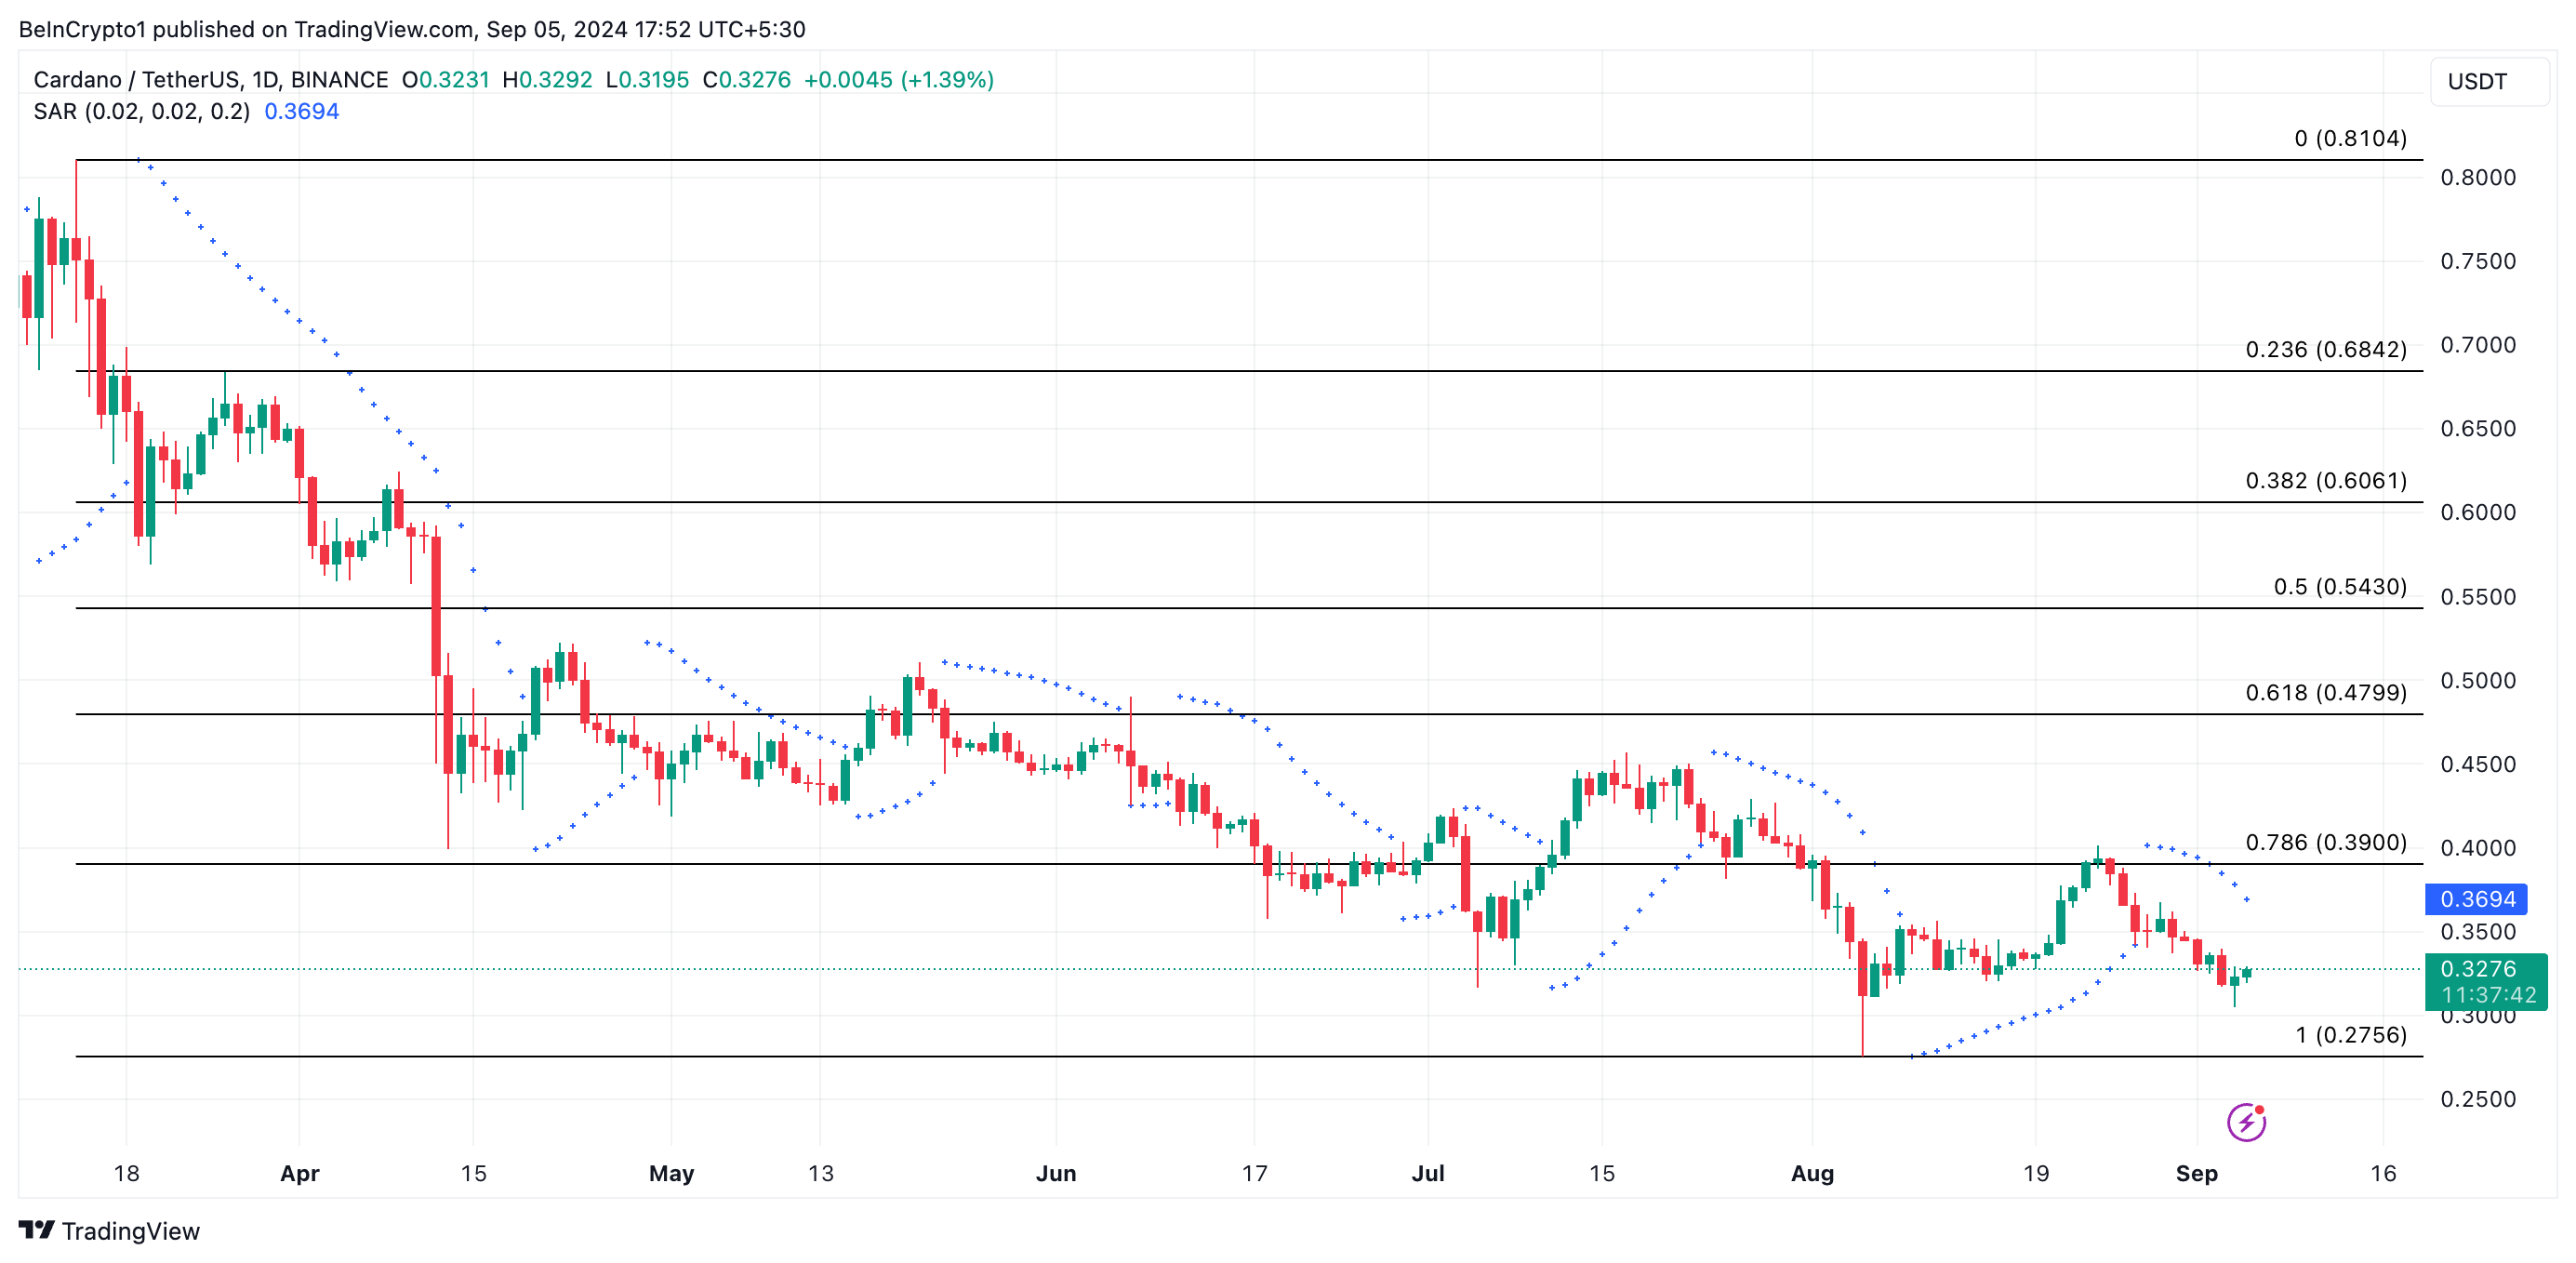
If this trend continues, ADA’s value could revisit its August 5 low of $0.27. However, if the altcoin witnesses a spike in new demand, its price may rally toward $0.39, invalidating the bearish projections above.
Disclaimer
In line with the Trust Project guidelines, this price analysis article is for informational purposes only and should not be considered financial or investment advice. BeInCrypto is committed to accurate, unbiased reporting, but market conditions are subject to change without notice. Always conduct your own research and consult with a professional before making any financial decisions. Please note that our Terms and Conditions, Privacy Policy, and Disclaimers have been updated.


XRP is under heavy selling pressure, down more than 5% in the last 24 hours and over 12% in the past seven days. The recent downturn has been accompanied by increasingly bearish technical indicators, including a sharp spike in trend strength and a collapse in on-chain activity.
With price momentum weakening and user engagement dropping, concerns are mounting over XRP’s ability to hold key support levels. Unless sentiment shifts quickly, the path of least resistance appears to remain to the downside.
DMI Chart Shows The Current Downtrend Is Very Strong
XRP’s Directional Movement Index (DMI) is currently flashing strong bearish signals, with the Average Directional Index (ADX) surging to 47.14 from 25.43 just a day ago.
The ADX measures the strength of a trend, regardless of its direction, and values above 25 generally indicate that a trend is gaining momentum.
A reading above 40—like XRP’s current level—suggests a very strong trend is in play. Given that XRP is currently in a downtrend, this rising ADX points to intensifying bearish momentum and a market leaning heavily toward further declines.
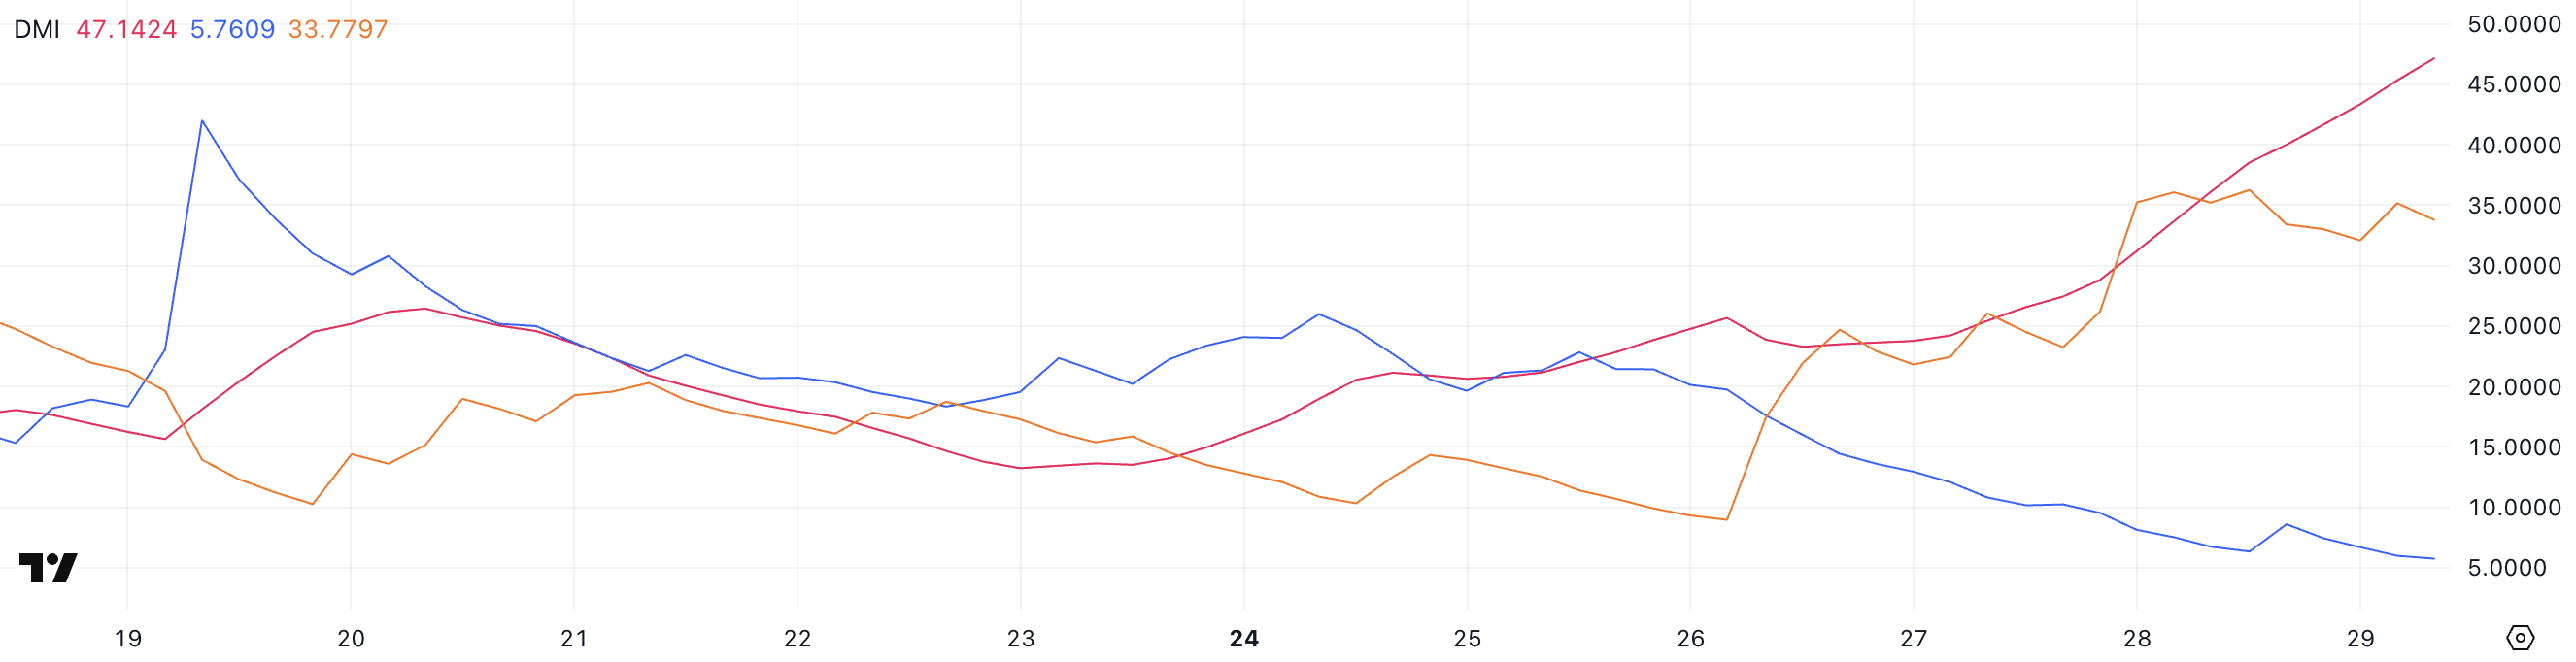
Digging deeper into the DMI components, the +DI, which tracks upward price pressure, has dropped sharply from 20.13 to 5.76. Meanwhile, the -DI, which tracks downward price pressure, has surged from 8.97 to 33.77.
This stark divergence reinforces the bearish trend, indicating that sellers are aggressively taking control while buyer strength fades.
With ADX confirming the strength of this move and directional indicators tilting heavily to the downside, XRP’s price could remain under pressure in the short term unless a significant reversal in sentiment occurs.
XRP Active Addresses Are Heavily Down
XRP’s 7-day active addresses have seen a sharp decline over the past week, following a recent surge to new all-time highs. On March 19, the metric peaked at 1.22 million, signaling strong network activity and user engagement.
However, since then, it has plummeted to just 331,000—a drop of over 70%. This sudden fall suggests that interest in transacting on the XRP has cooled off significantly in a short span of time.
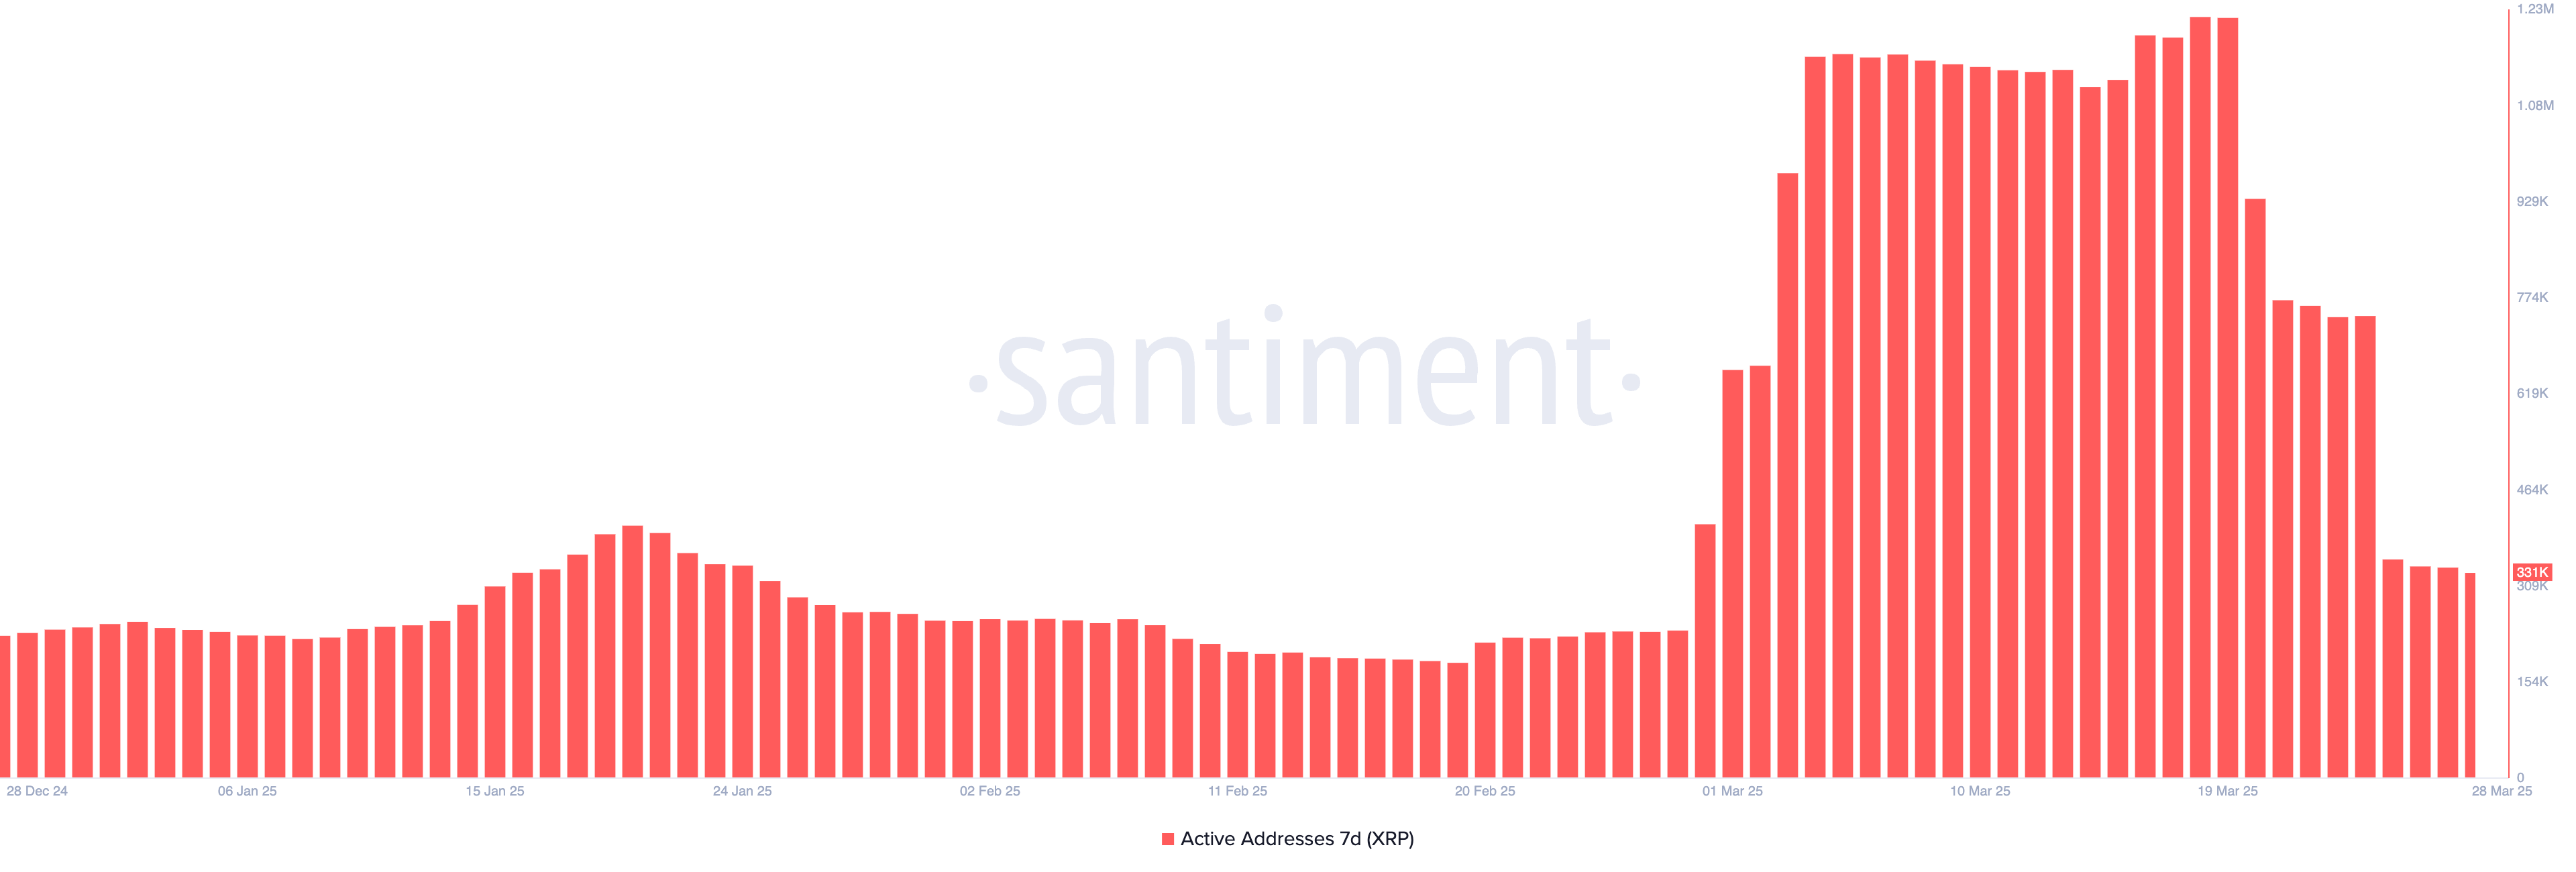
Tracking active addresses is a key way to gauge on-chain activity and overall network health. A rising number of active addresses typically reflects growing user participation, increased demand, and potential investor interest—factors that can support price strength.
Conversely, a sharp decline like the one XRP is currently experiencing can point to weakening momentum and fading interest, which could put additional pressure on price.
Unless user activity begins to rebound, this drop in network engagement may continue to weigh on XRP’s short-term outlook.
XRP Could Drop Below $2 Soon
XRP’s Exponential Moving Average (EMA) lines are currently signaling a strong downtrend, with the short-term EMAs positioned below the longer-term ones—a classic bearish alignment.
This setup indicates that recent price momentum is weaker than the longer-term average, often seen during sustained corrections. If this downtrend continues, XRP could retest the support level at $1.90.
A break below that could open the door to a deeper drop toward $1.77 in April.
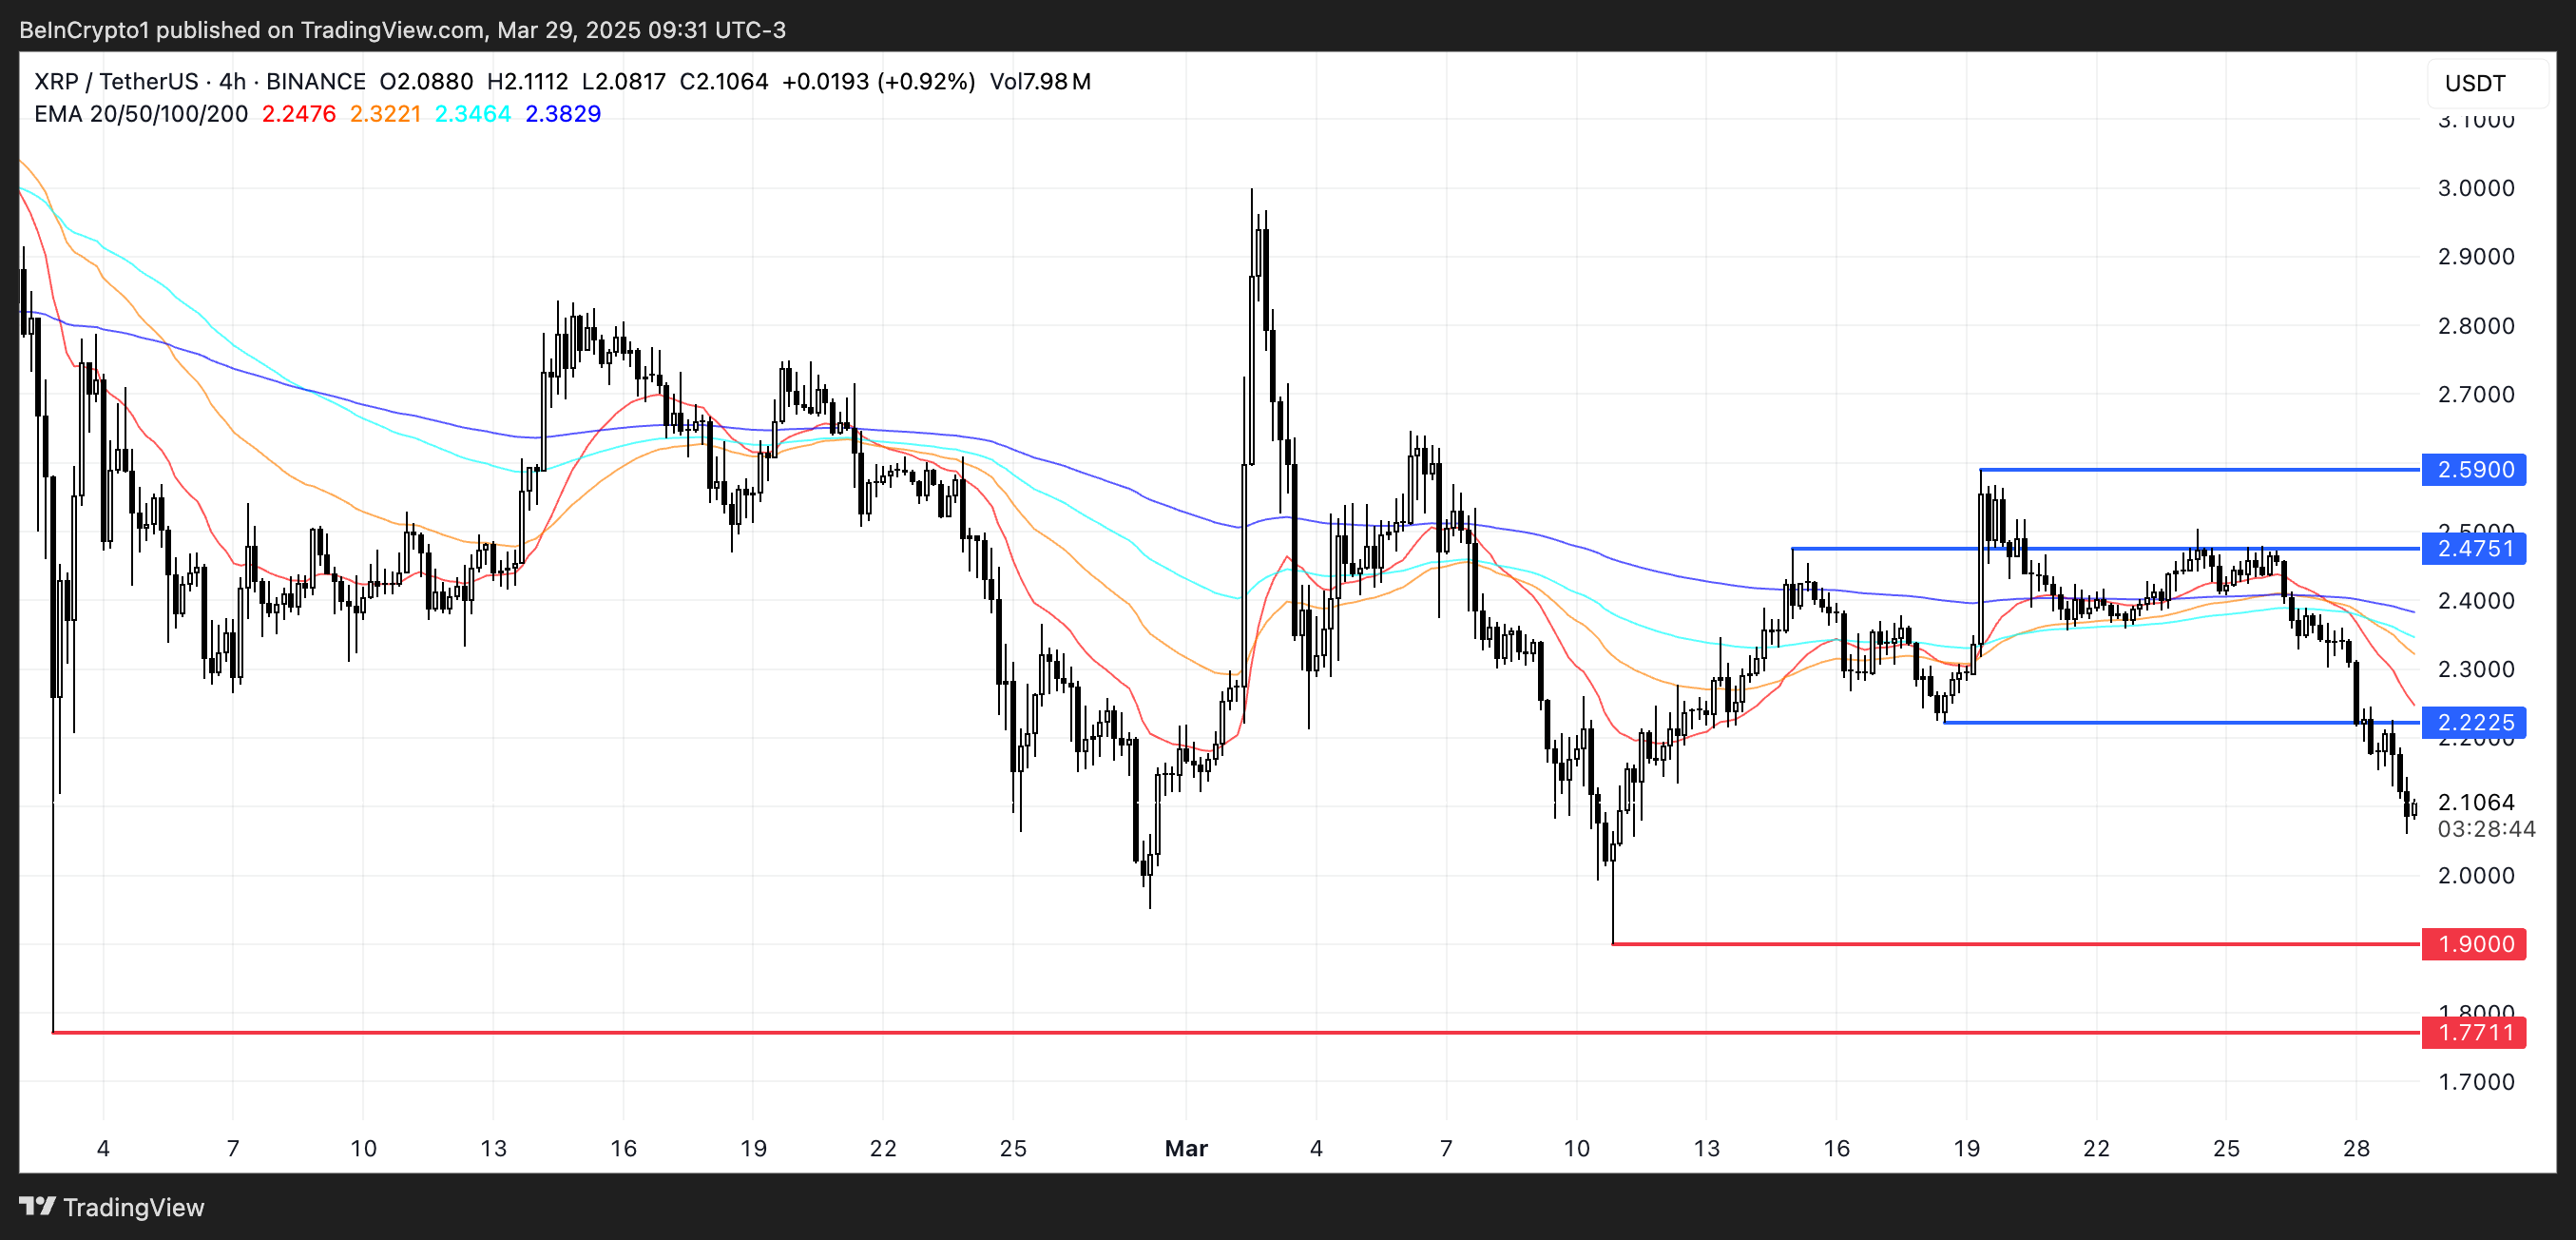
However, if market sentiment shifts and XRP price manages to reverse course, the first key level to watch is the resistance at $2.22.
A successful breakout above this point could trigger renewed bullish momentum, potentially driving the price up to $2.47.
If that level also gets breached, XRP could push further to test the $2.59 mark.
Disclaimer
In line with the Trust Project guidelines, this price analysis article is for informational purposes only and should not be considered financial or investment advice. BeInCrypto is committed to accurate, unbiased reporting, but market conditions are subject to change without notice. Always conduct your own research and consult with a professional before making any financial decisions. Please note that our Terms and Conditions, Privacy Policy, and Disclaimers have been updated.

ONDO is facing notable downside pressure. It has been down over 5% in the last 24 hours and corrected more than 19% over the past 30 days. With its market cap now sitting around $2.5 billion, the coin is way below competitors like Chainlink and Mantra in terms of market cap.
Recent technical indicators and whale behavior suggest that the current weakness may not be over, despite a slight recovery in momentum.
ONDO RSI Is Recovering From Oversold Levels
ONDO’s Relative Strength Index (RSI) is currently sitting at 34 after rebounding slightly from an earlier dip to 27.5. Just two days ago, the RSI was at 54.39, indicating how quickly momentum has shifted.
The RSI is a momentum oscillator that measures the speed and magnitude of recent price changes. It ranges from 0 to 100.
Readings below 30 are typically considered oversold, suggesting the asset may be undervalued and due for a bounce, while readings above 70 are viewed as overbought, indicating potential for a pullback.
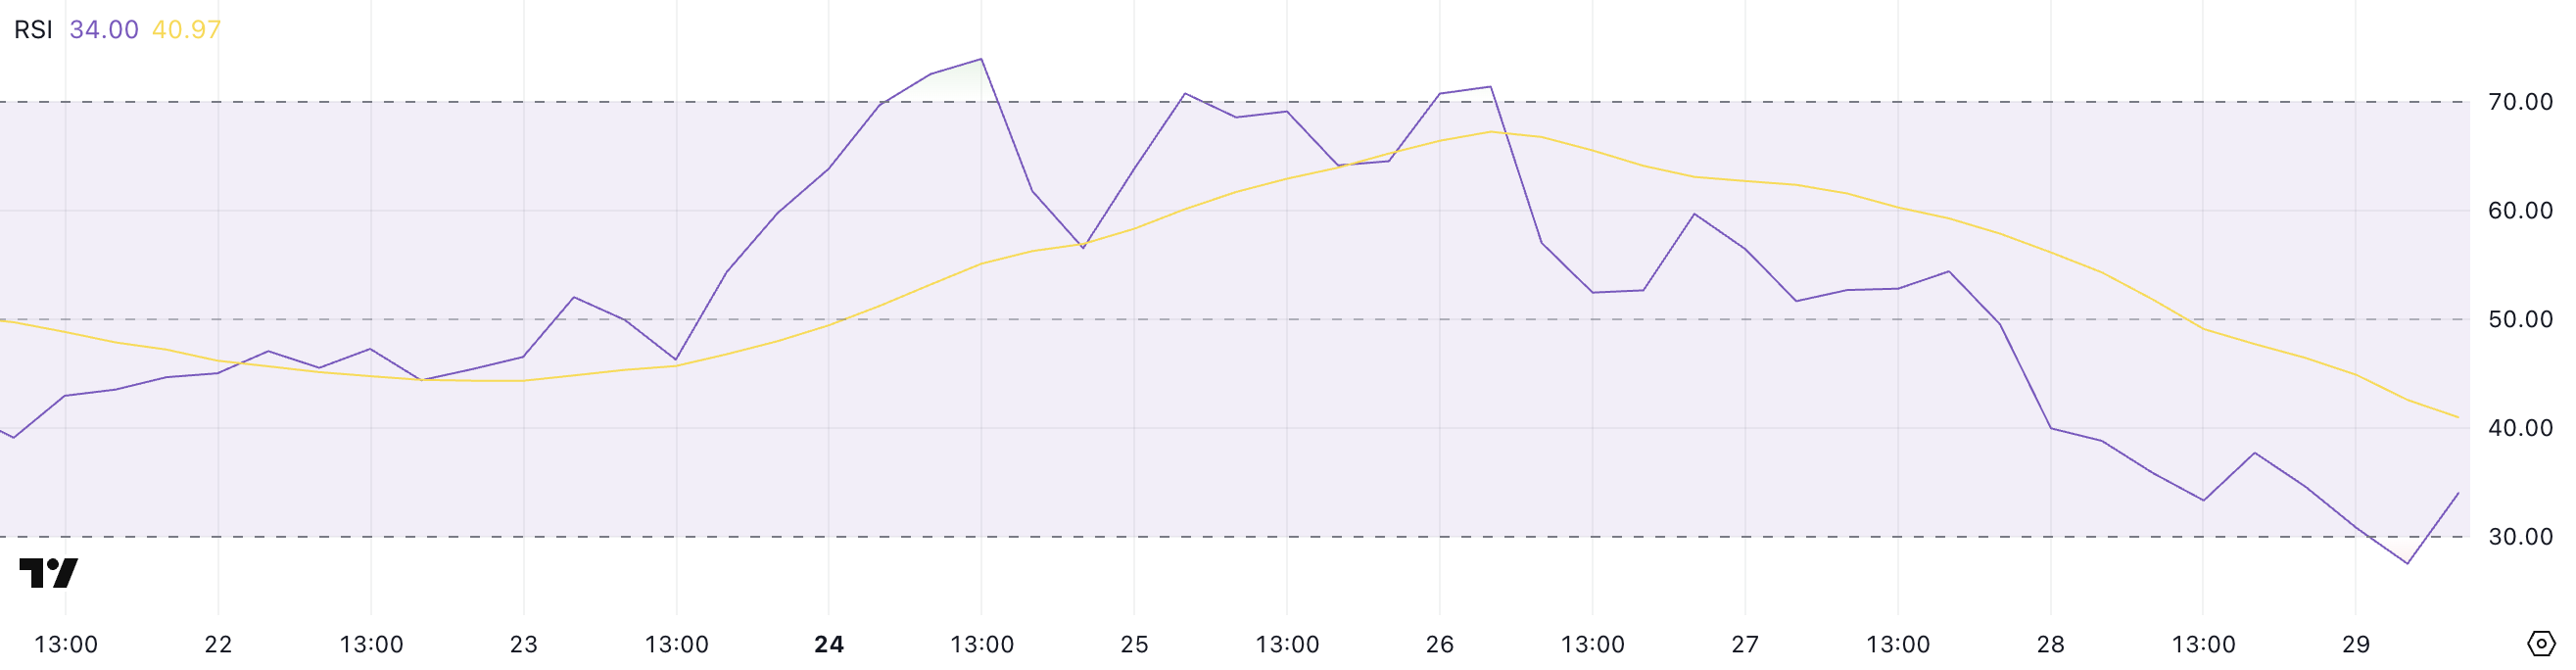
With ONDO’s RSI now at 34, it has technically exited oversold territory but remains near the lower end of the scale. This suggests that while the sharpest selling pressure may have eased, the market is still fragile ,and sentiment remains cautious.
If the RSI continues to recover and climbs above 40 or 50, it could signal a shift toward more bullish momentum.
However, if selling resumes and RSI falls back below 30, it would indicate renewed downside risk and potential for further price declines.
Whales Recently Stopped Their Accumulation
The number of ONDO whales—addresses holding between 1 million and 10 million ONDO—fluctuated in late March, initially increasing from 188 to 195 between March 22 and March 26 before declining to 191 in recent days.
This whale activity pattern is significant as these large holders often influence market sentiment and price movements, with their accumulation or distribution phases potentially foreshadowing broader market trends.
Tracking whale addresses provides valuable insights into how influential investors are positioning themselves, which can help predict potential price action.
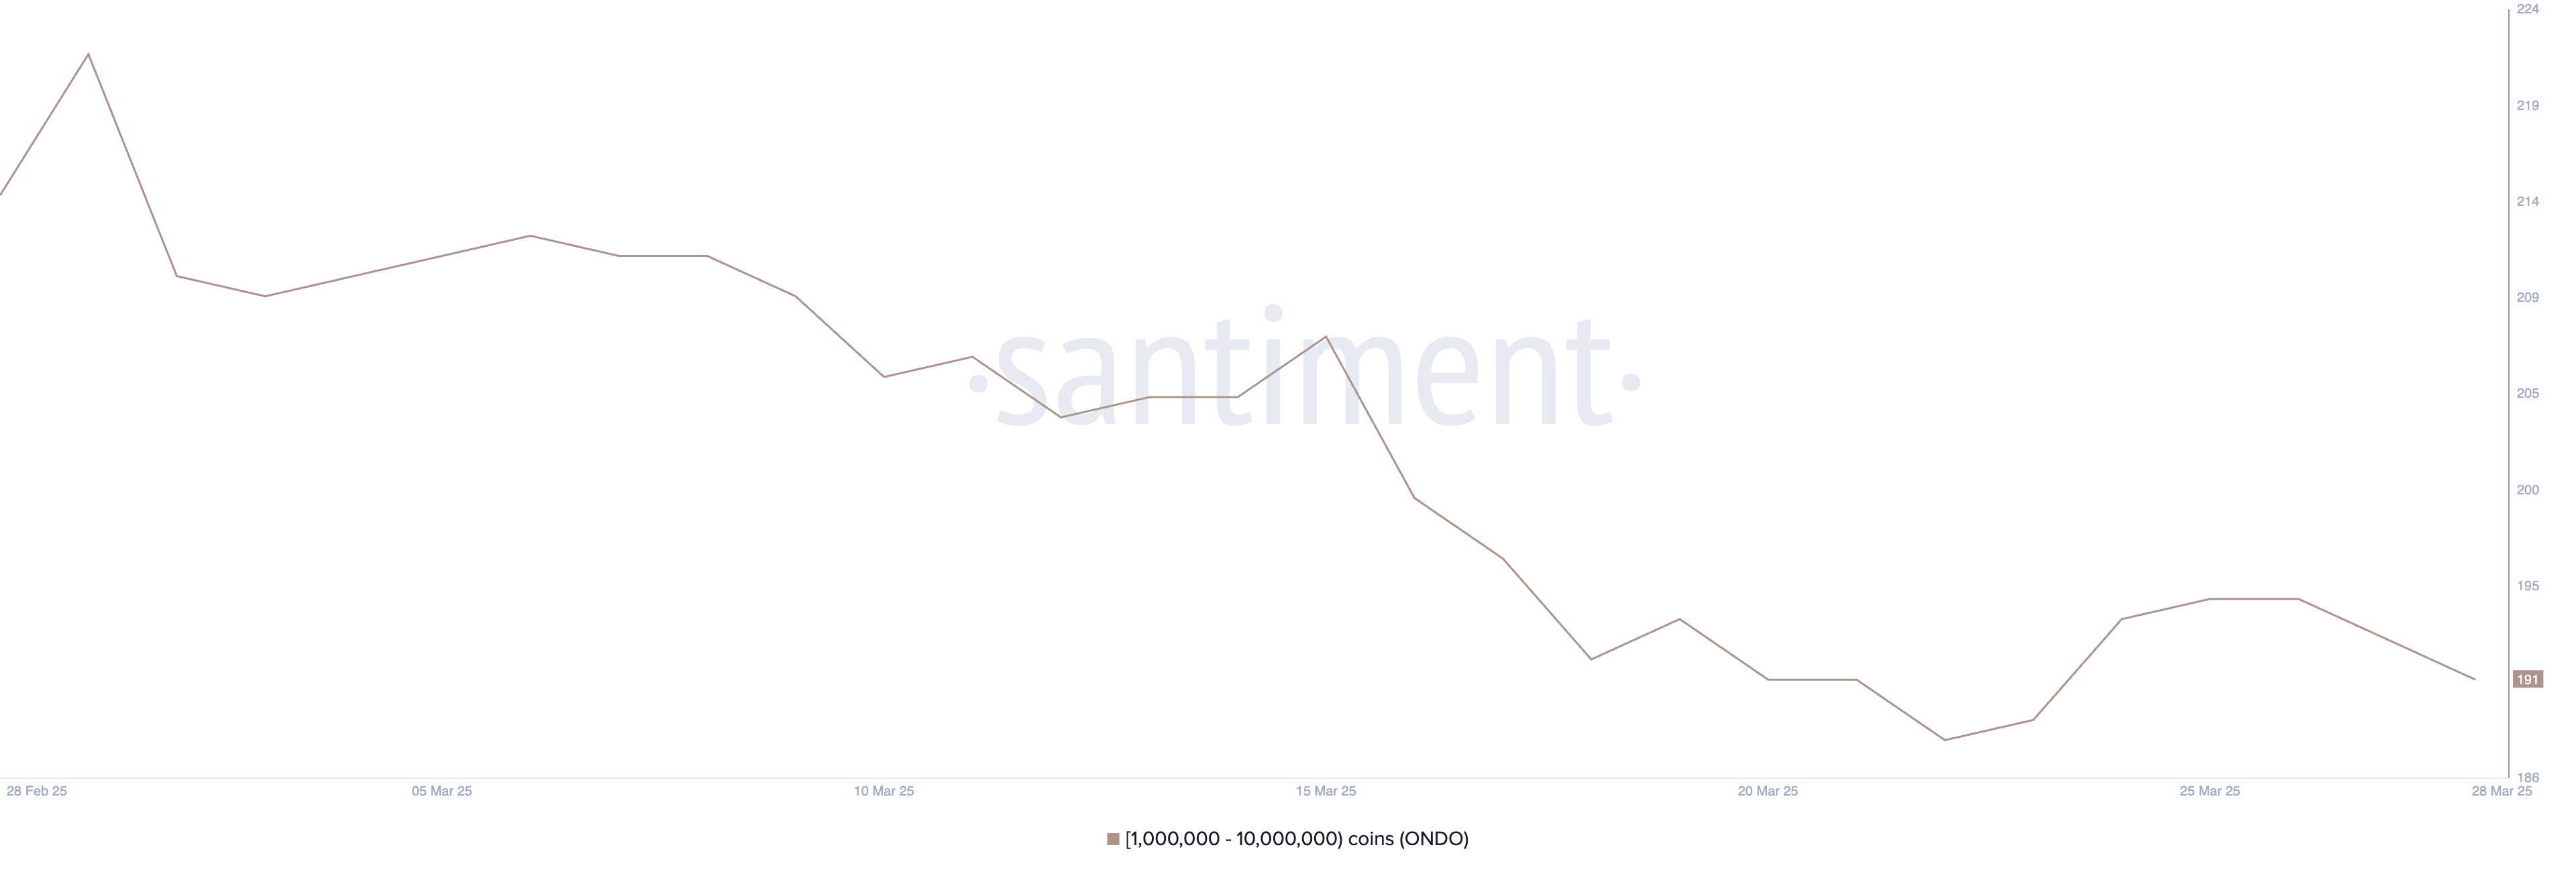
The failure of Whale addresses to maintain the breakout above 195 and the subsequent return to 191 could signal bearish sentiment among larger investors.
This retreat might indicate that whales are taking profits or reducing exposure, which could create downward price pressure on ONDO in the short term.
When large holders begin to reduce their positions after a period of accumulation, it often precedes price corrections, suggesting that ONDO may experience resistance in maintaining upward momentum until whale confidence returns and accumulation resumes.
Will ONDO Fall Below $0.70 For The First Time Since November?
ONDO’s Exponential Moving Average (EMA) lines are currently aligned in a bearish formation, suggesting the ongoing downtrend may persist. If this weakness continues, ONDO could drop to test the key support level at $0.73.
A break below that would be significant, potentially sending the price under $0.70 for the first time since November 2024.
The token has been struggling to keep pace with other Real World Asset (RWA) coins like Mantra, and this underperformance adds further pressure to ONDO’s short-term outlook.
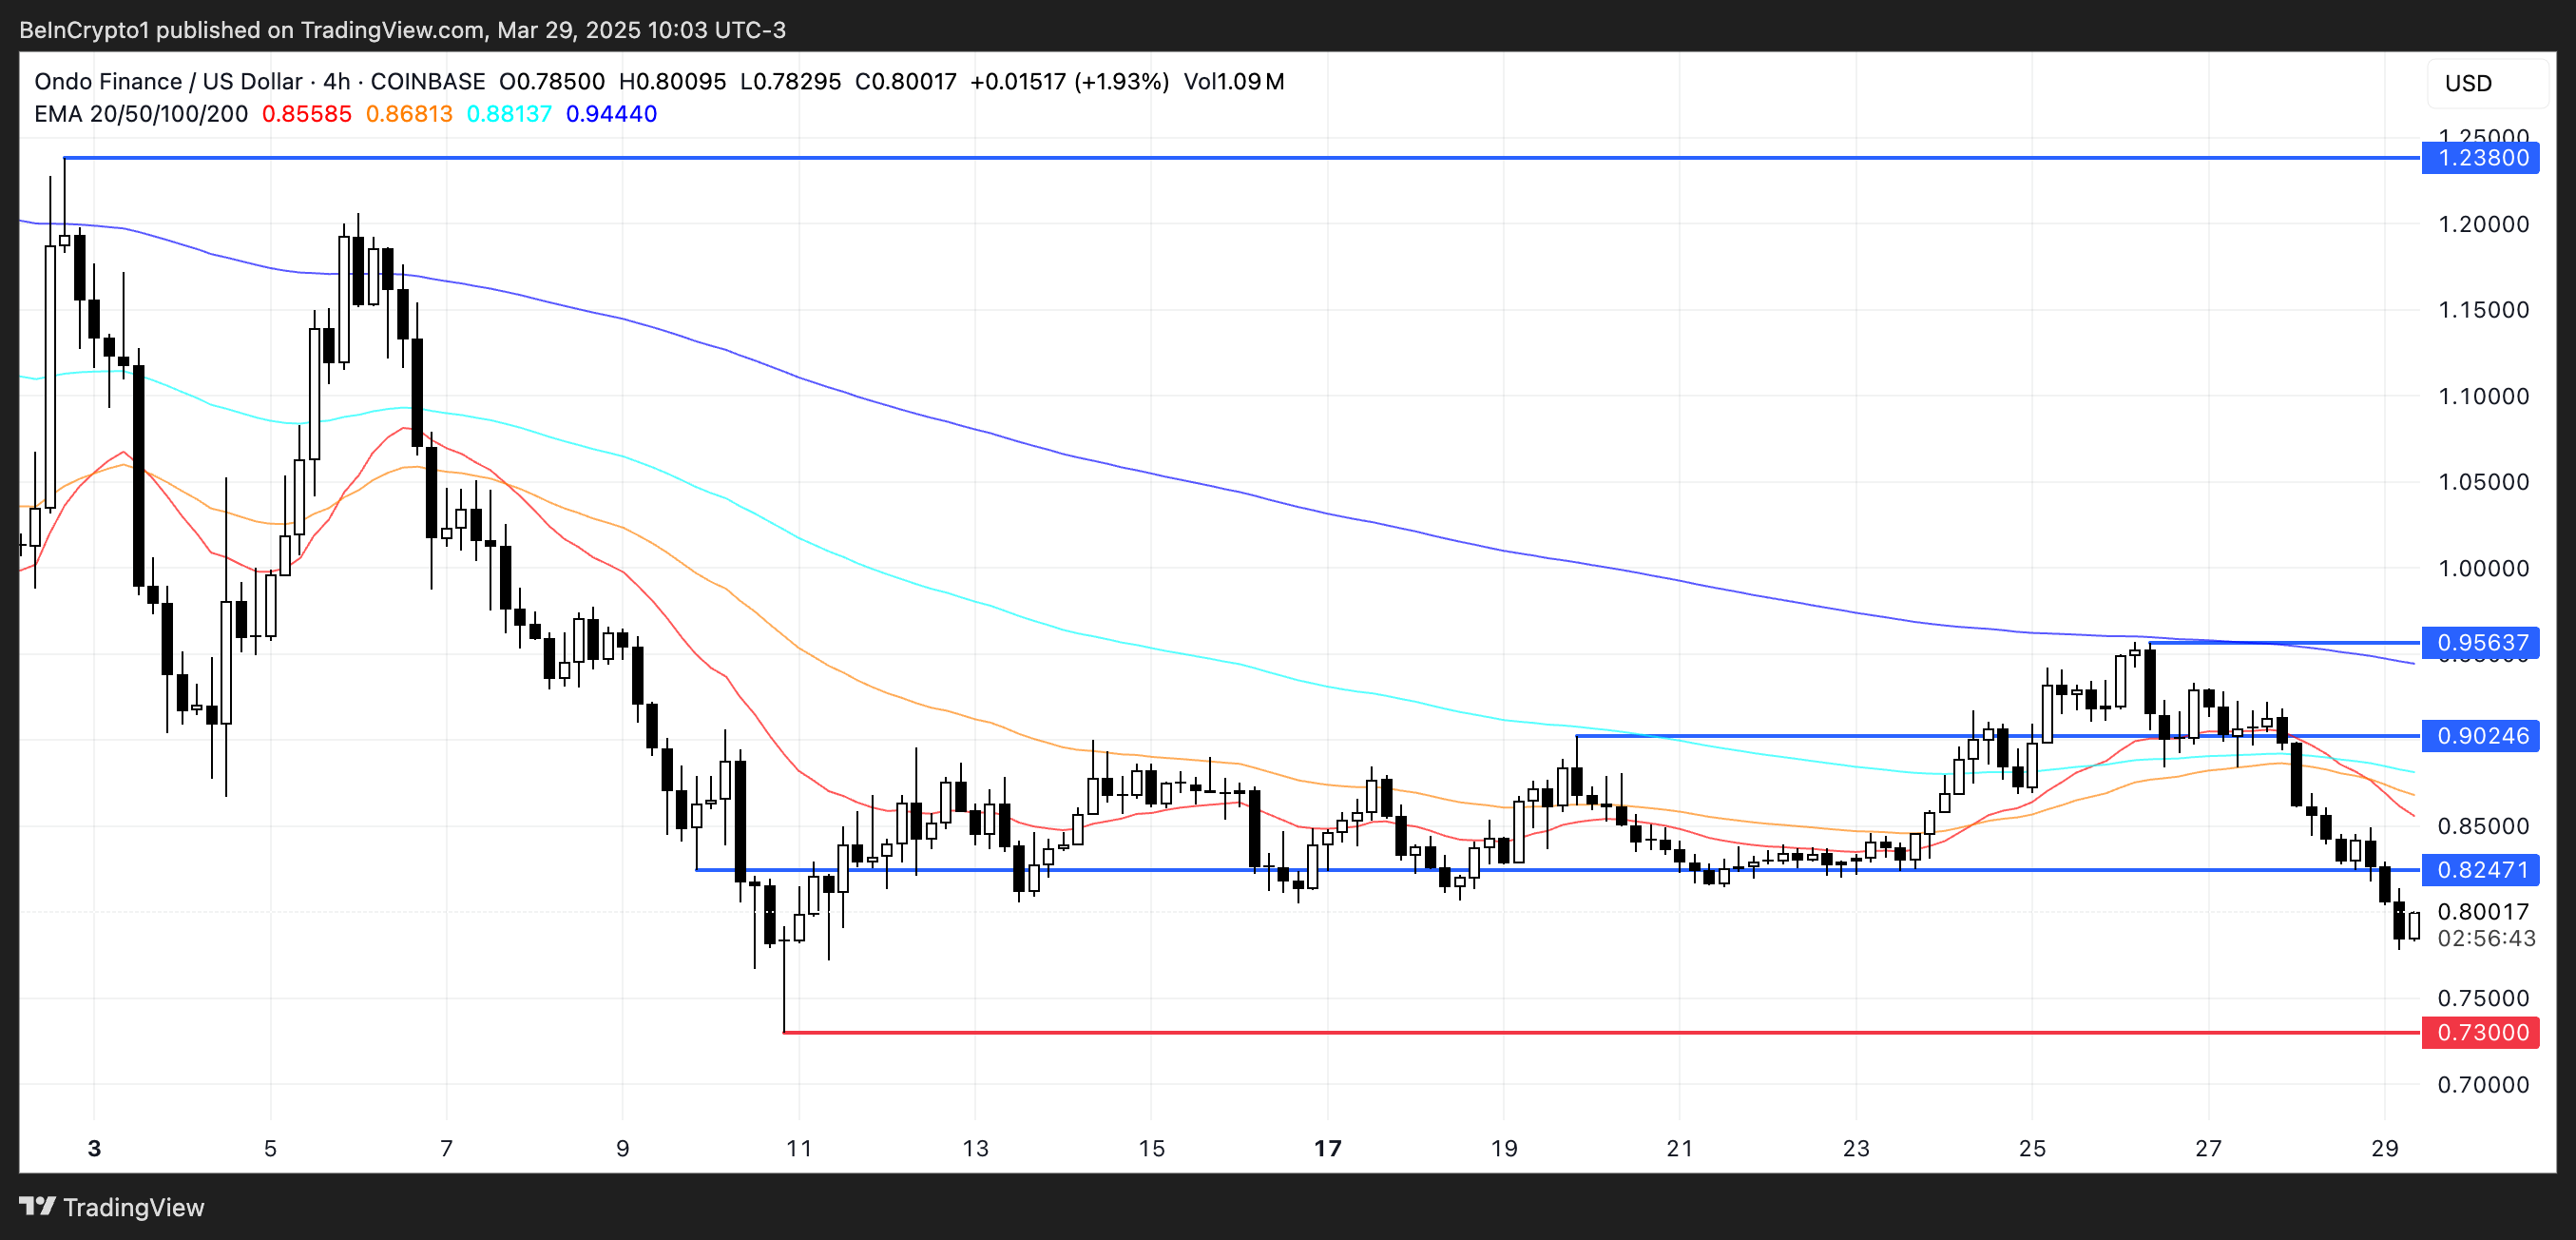
However, if sentiment shifts and ONDO manages to reverse its trend, the first key level to watch is the resistance at $0.82.
A breakout above this level could trigger a broader recovery, with price targets at $0.90 and $0.95.
If the RWA sector as a whole regains momentum, ONDO could even rise above the $1 mark and aim for the next major resistance at $1.23.
Disclaimer
In line with the Trust Project guidelines, this price analysis article is for informational purposes only and should not be considered financial or investment advice. BeInCrypto is committed to accurate, unbiased reporting, but market conditions are subject to change without notice. Always conduct your own research and consult with a professional before making any financial decisions. Please note that our Terms and Conditions, Privacy Policy, and Disclaimers have been updated.

GRASS has surged nearly 30% over the past week, with its market cap climbing back to $415 million and its price breaking above $1.70 for the first time since March 10.
This strong performance has been backed by bullish technical signals, including a consistently positive BBTrend and a rising ADX. However, with momentum indicators beginning to cool slightly, the next few days will be key in determining whether GRASS continues its rally or enters a period of consolidation.
GRASS BBTrend Remains Strong, But Is Slightly Declining
GRASS’s BBTrend is currently at 11.28, marking the fourth consecutive day in positive territory, after peaking at 14.85 two days ago.
The BBTrend (Bollinger Band Trend) indicator measures the strength of price trends by analyzing how far the price moves away from its moving average within Bollinger Bands.
Generally, values above zero indicate an uptrend, while values below zero suggest a downtrend. The higher the positive reading, the stronger the bullish momentum, whereas deep negative values reflect strong selling pressure.
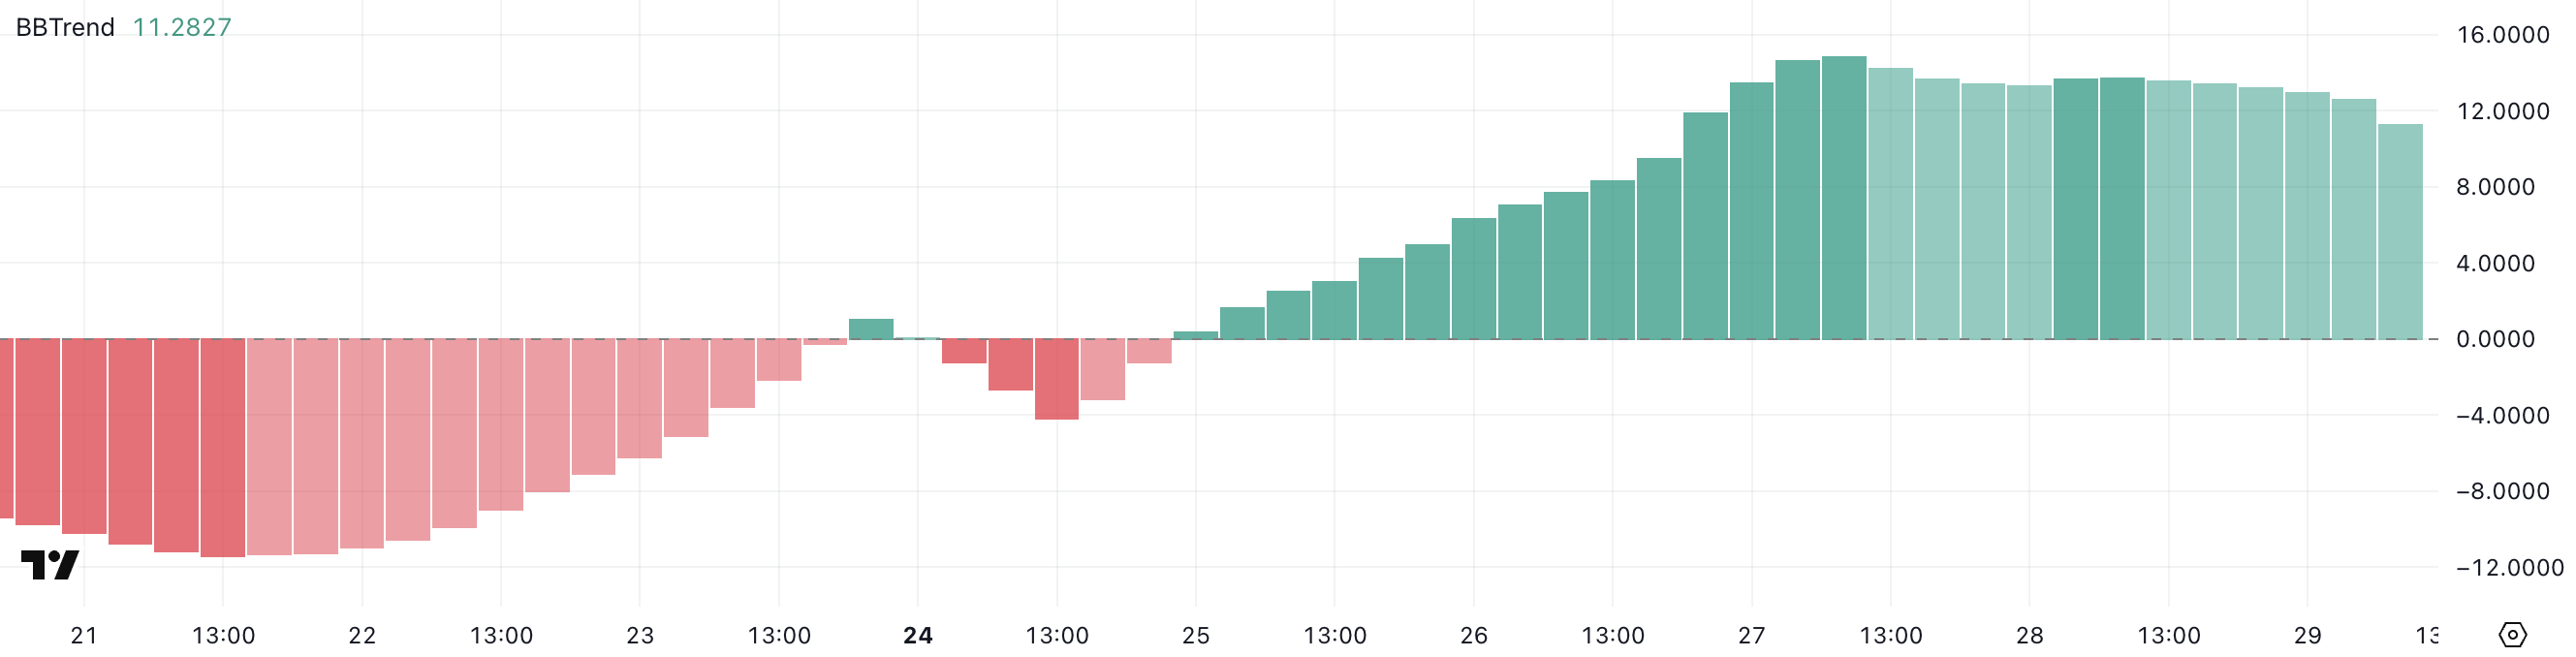
With GRASS maintaining a BBTrend of 11.28, the token is still in an active uptrend, although slightly cooler than its recent peak.
Sustained positive BBTrend readings typically signal that buyers remain in control and that upward momentum could continue.
However, the slight pullback from 14.85 might suggest that momentum is starting to ease. If the BBTrend begins to decline further, it could be an early sign of consolidation or a possible reversal.
For now, GRASS appears to be holding onto bullish momentum, but traders should monitor any shifts in trend strength closely.
GRASS ADX Shows The Uptrend Is Getting Stronger
GRASS is currently in an uptrend, with its Average Directional Index (ADX) rising to 30.31 from 26.49 just a day ago, indicating a strengthening trend momentum.
The ADX is a widely used technical indicator that measures the strength of a trend, regardless of its direction, on a scale from 0 to 100.
Values below 20 suggest a weak or non-existent trend, while readings above 25 indicate that a trend is gaining traction.
When the ADX moves above 30, it typically signals that the trend is becoming well-established and may continue in the same direction.
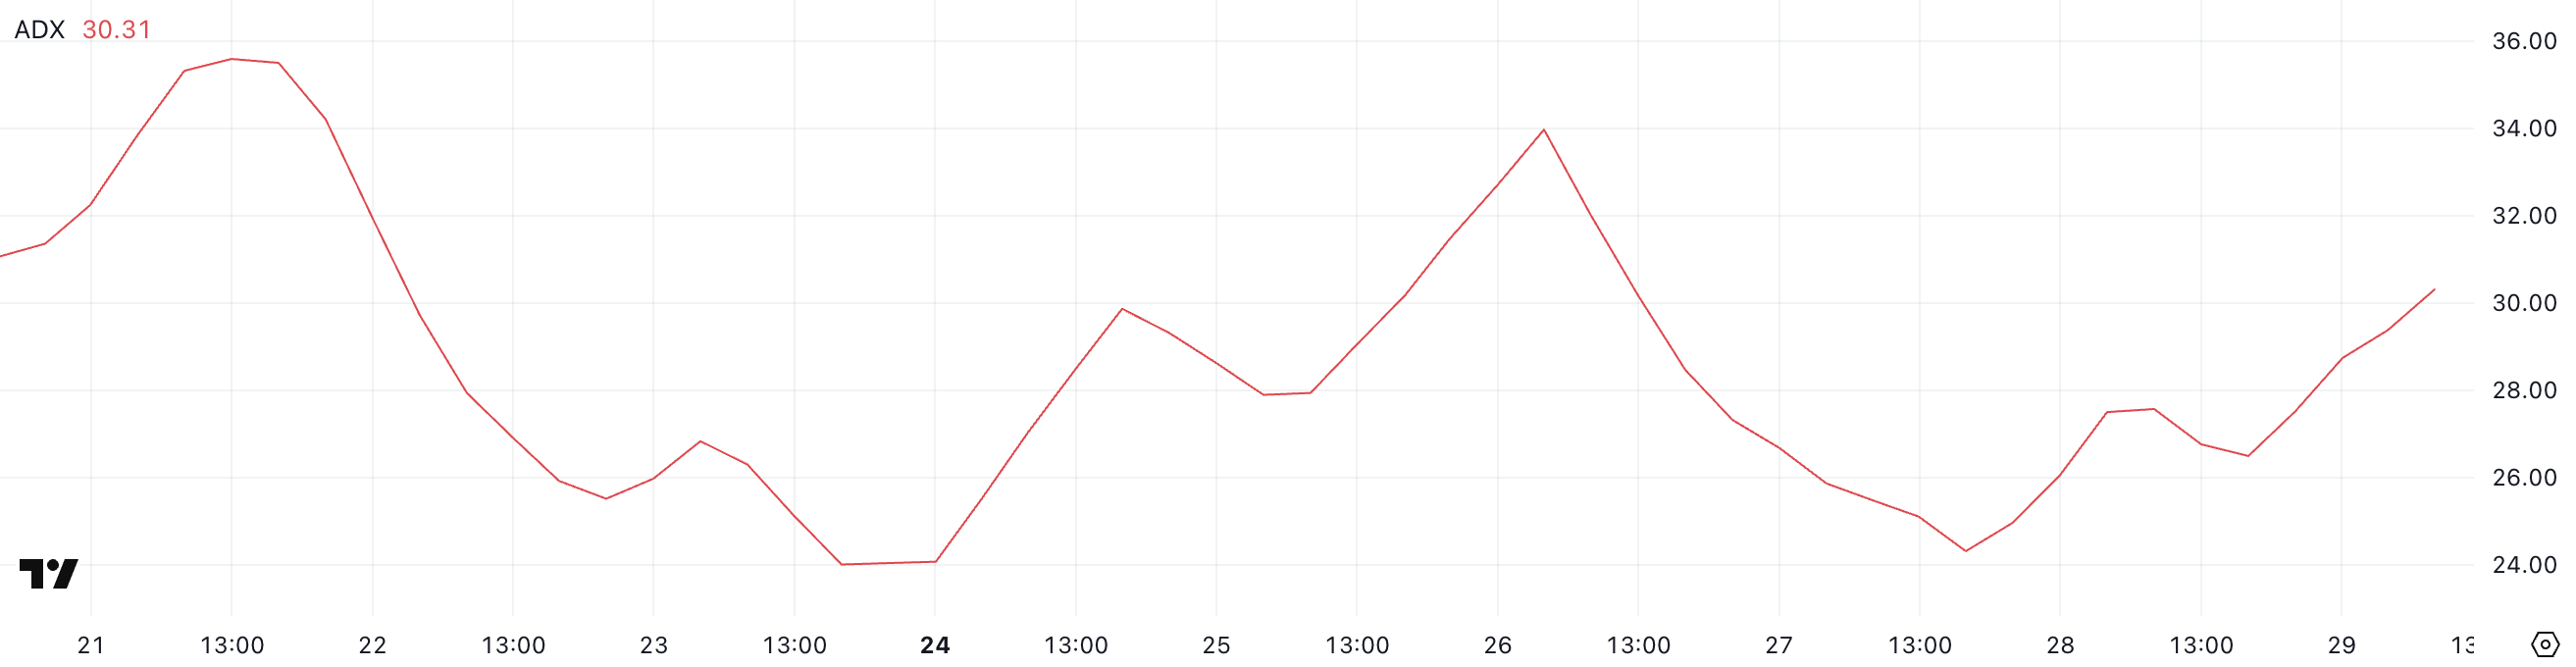
With GRASS’s ADX now above the 30 threshold, the current uptrend appears to be gaining strength. This suggests that bullish momentum is firming up and that price action may continue favoring the upside in the near term.
As long as the ADX remains elevated or continues climbing, the trend is likely to sustain, attracting more interest from momentum traders.
However, if the ADX begins to plateau or reverse, it could signal a potential slowdown or consolidation phase ahead.
GRASS Could Form A New Golden Cross Soon
GRASS’s Exponential Moving Average (EMA) lines are showing signs of a potential golden cross, a bullish signal that occurs when a short-term EMA crosses above a long-term one.
If this crossover confirms, it could mark the beginning of a sustained uptrend. GRASS is likely to test the immediate resistance at $1.85 as some artificial intelligence coins start to recover good momentum.
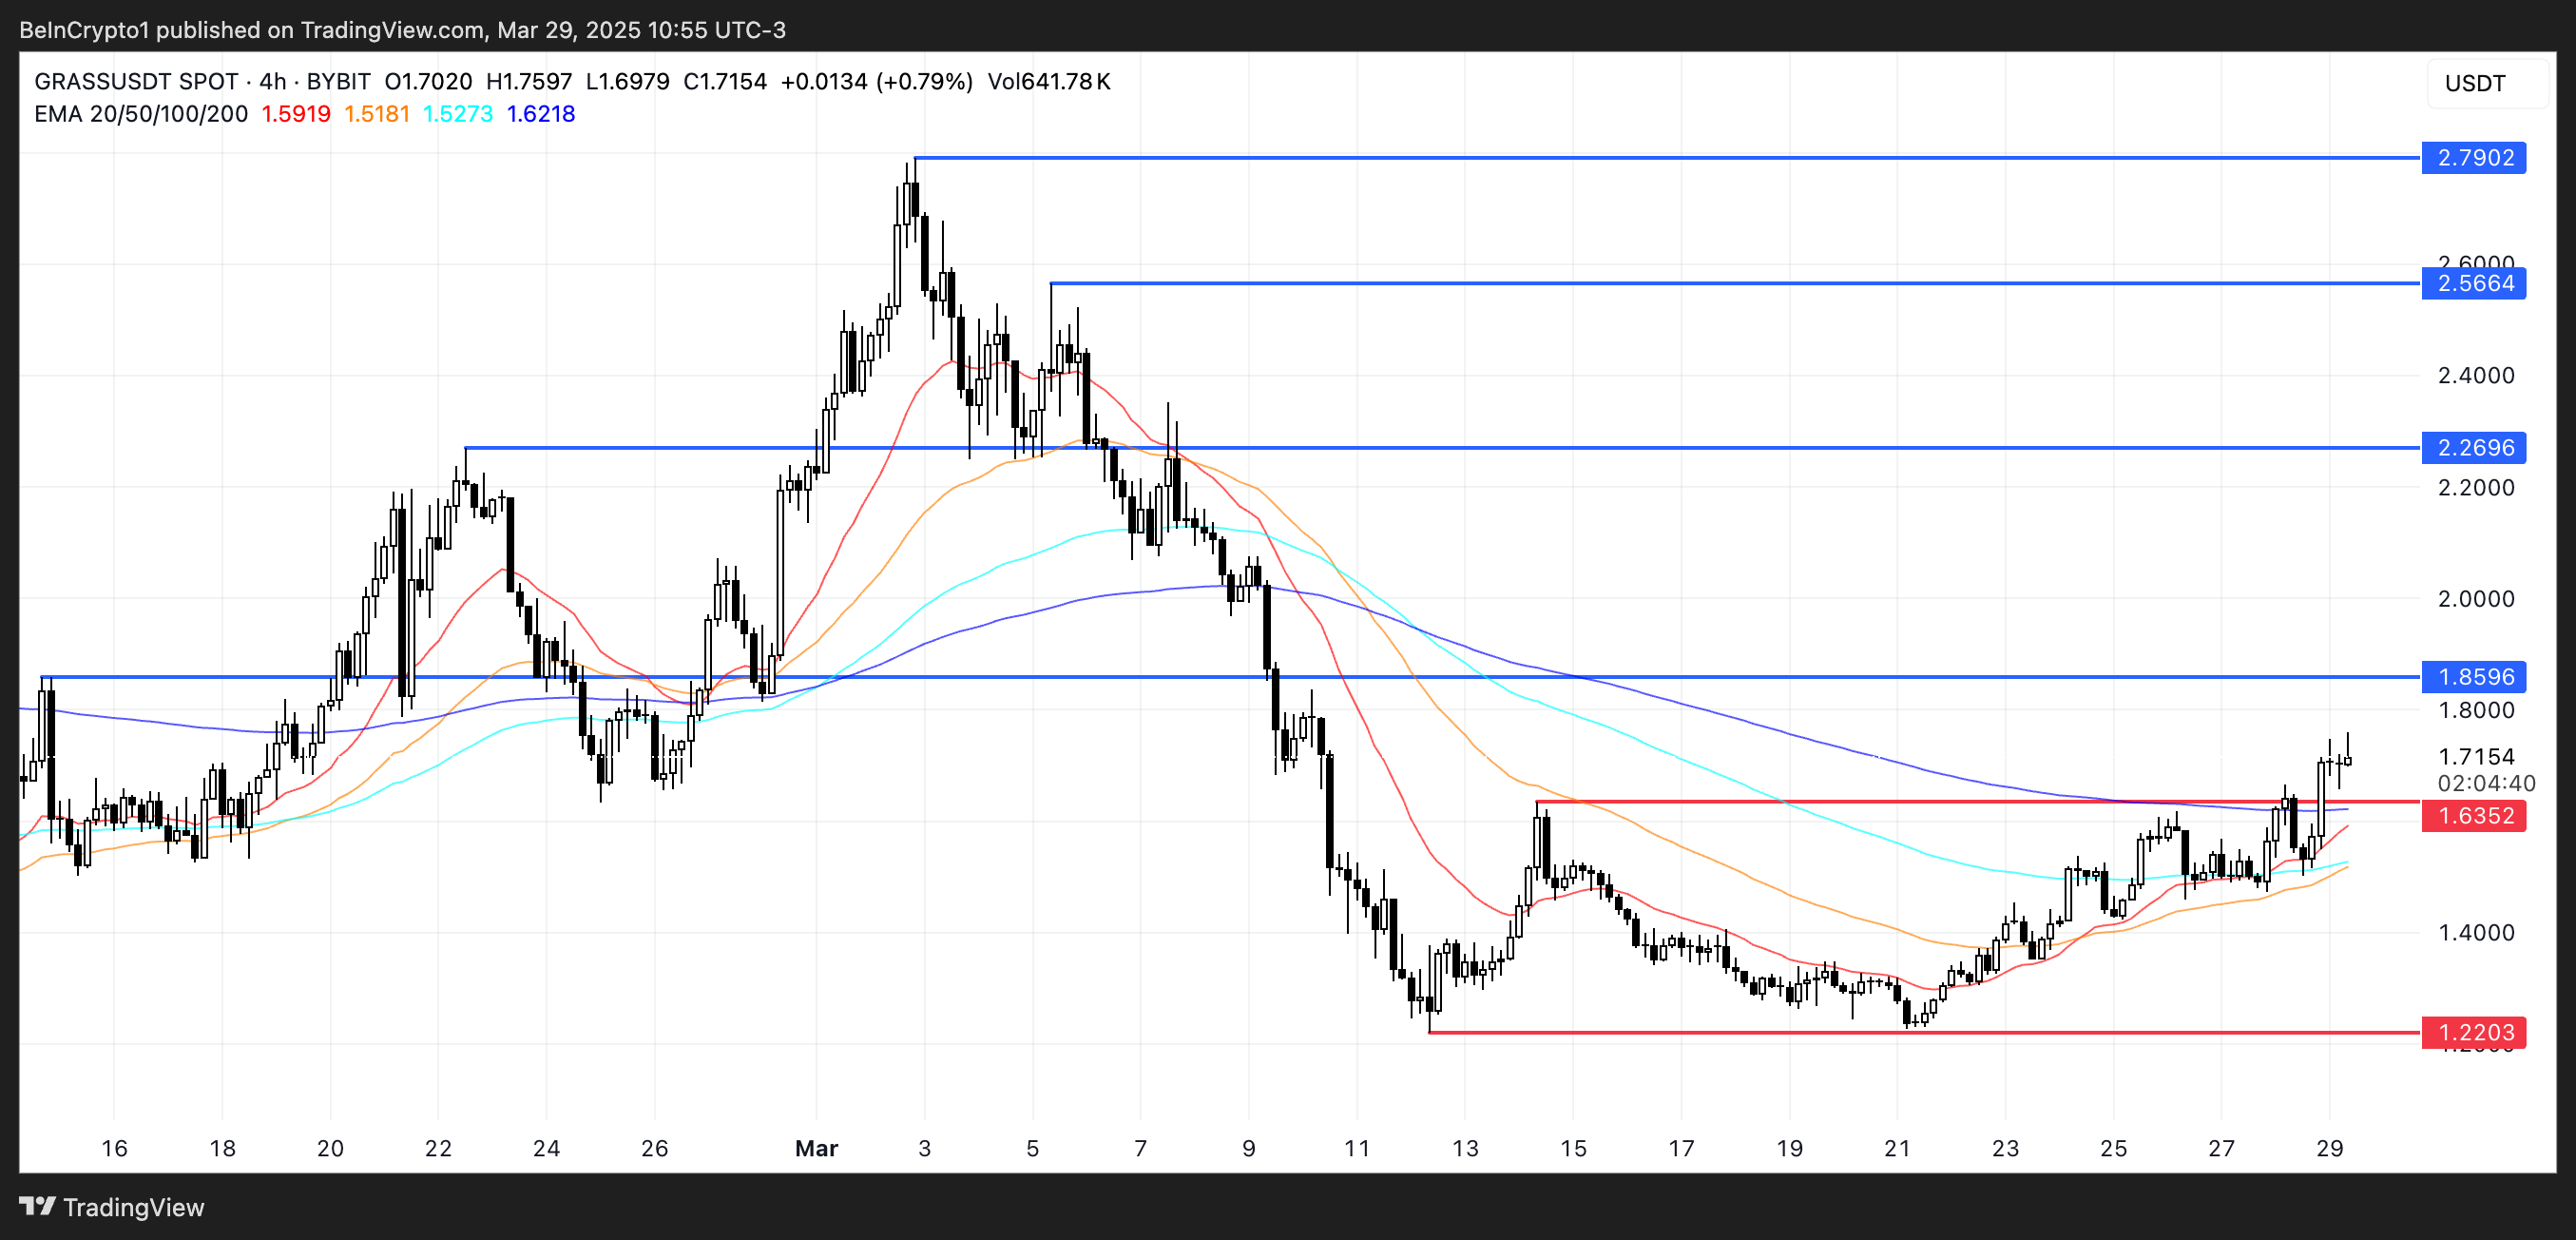
Should bullish momentum from the past week persist, the token may push even higher toward $2.26 and eventually $2.56 or $2.79, possibly solidifying its position as one of the best-performing altcoins in the market.
However, if the trend fails to hold and sentiment shifts bearish, GRASS could pull back to retest the support at $1.63.
A break below this level might open the door to a deeper correction, potentially driving the price down to $1.22.
Disclaimer
In line with the Trust Project guidelines, this price analysis article is for informational purposes only and should not be considered financial or investment advice. BeInCrypto is committed to accurate, unbiased reporting, but market conditions are subject to change without notice. Always conduct your own research and consult with a professional before making any financial decisions. Please note that our Terms and Conditions, Privacy Policy, and Disclaimers have been updated.

Ethereum Bulls Disappointed As Recovery Attempt Fails At $2,160 Resistance

Is Burger King Teasing Crypto Launch? Decoding Their X Post

XRP Falls 12% in a Week as Network Activity Declines
Pepe Coin Whale Sells 150 Billion Tokens, Price Fall Ahead?

ONDO Whales Retreat as Price Risks Dropping Below $0.70

8,000 Dormant Bitcoin Suddenly Move: What’s Next For The Market?

2.52 Million Altcoins Are Ruining Crypto’s Future

Animoca Brands Valuation Tanks 75% In Two Years, Here’s Why

Crypto exchange BingX hacked for $43 million

Are The Big Players Losing Interest?

Hong Kong’s Securities Association Tips Authorities On Crypto Self-Regulation

Coinbase cbBTC Set to go Live on Solana
2.52 Million Altcoins Are Ruining Crypto’s Future
Animoca Brands Valuation Tanks 75% In Two Years, Here’s Why
Crypto exchange BingX hacked for $43 million
Are The Big Players Losing Interest?
Hong Kong’s Securities Association Tips Authorities On Crypto Self-Regulation
Coinbase cbBTC Set to go Live on Solana
-

 Market22 hours ago
Why Did MUBARAK Drop 40% Despite Binance Listing?
-

 Altcoin21 hours ago
Analyst Reveals Bullishness On Ethereum Price At This Point, Can It Hit $4,000 Again?
-

 Market20 hours ago
Cronos (CRO) Jumps 7%, Tops Altcoin Gainers Today
-

 Bitcoin19 hours ago
Is Bitcoin About To Skyrocket Or Crash? What Truflation Says
-

 Market19 hours ago
XRP Price Eyes 20% Move With Golden Pocket Appearance
-

 Altcoin18 hours ago
Chainlink Price Leads Altcoin Selloff, Where Is LINK Price Floor?
-

 Market17 hours ago
Pi Network (PI) Drops Further Despite Telegram Wallet Deal
-

 Market16 hours ago
FDIC and CFTC Rescind Old Crypto Guidelines