
Market
Robinhood to Pay $3.9 Million Fine for Misleading Crypto Clients


Cryptocurrency trading platform Robinhood has agreed to pay up to $3.9 million in settlement fees following complaints filed by customers several years ago. The penalties also include new, stricter conduct requirements.
The investigation into Robinhood was prompted by consumer grievances related to questionable practices within its cryptocurrency division.
Robinhood to Pay $3.9 Million to Customers
California Attorney General Rob Bonta announced in a Wednesday press release that Robinhood will pay penalties for denying customers access to their cryptocurrency holdings between 2018 and 2022. The platform also failed to disclose key details regarding its trading and order-handling practices.
Bonta revealed that Robinhood violated the California Commodities Law (CCL) by selling commodities contracts. The company allowed users to buy cryptocurrency with the expectation of value growth but failed to deliver the assets. As a result, customers were forced to sell their holdings back to Robinhood when they couldn’t access their investments.
“Robinhood misled customers by advertising it would connect to multiple trading venues, to ensure customers receive the most competitive prices between the venues, which was not always true. Robinhood also represented to its customers that Robinhood itself held all its customers’ cryptocurrencies purchased through Robinhood’s platform. Despite these assurances, Robinhood did not tell customers that there were instances in which it arranged for trading venues to hold customer assets for extended periods,” the California AG wrote.
Read more: How to Buy and Sell Crypto on Robinhood: A Step-by-Step Guide
The Wednesday settlement officially closes the investigation into Robinhood’s violations of the California Commodities Law (CCL). Bonta cited the state’s consumer protection laws, which safeguard residents against misrepresentation, including by cryptocurrency companies. The settlement also includes stringent conduct requirements for the platform moving forward.
Additionally, the US Securities and Exchange Commission (SEC) investigated Robinhood’s cryptocurrency operations, issuing a Wells Notice signaling potential enforcement actions. While the company expressed disappointment, with Chief Legal Officer Dan Gallagher referencing their prior good faith efforts, Robinhood has made strides toward compliance, including applying to register as a special-purpose broker-dealer under SEC regulations.
Platform Thrives Despite Regulator Woes
Despite ongoing legal challenges, Robinhood remains on a positive trajectory following strong second-quarter (Q2) earnings. In early August, BeInCrypto reported that the platform’s Q2 revenues climbed to $682 million, marking a 40% year-over-year increase, driven largely by crypto and options trading.
Notably, crypto revenues skyrocketed by 161% year-over-year, reaching $81 million in Q2 2024. While the company saw a 10% sequential increase in overall net revenues from $618 million in Q1 to $682 million in Q2, crypto transaction-based revenue slightly declined, dropping from $126 million in Q1 to $81 million in Q2.
A crucial factor behind Robinhood’s recent success is its strategic acquisitions and initiatives. In June, the platform acquired European crypto exchange Bitstamp, Ltd., followed by the July purchase of AI-powered investment research platform Pluto Capital Inc. According to Jason Warnick, Robinhood’s Chief Financial Officer, these acquisitions are part of a broader plan to fuel growth.
Read more: Coinbase vs. Robinhood: Which Is the Best Crypto Platform?
However, following news of the $3.9 million penalty, Robinhood’s stock (HOOD) dropped 1.34%, trading at $19.11 as of 2:30 a.m. ET.
Disclaimer
In adherence to the Trust Project guidelines, BeInCrypto is committed to unbiased, transparent reporting. This news article aims to provide accurate, timely information. However, readers are advised to verify facts independently and consult with a professional before making any decisions based on this content. Please note that our Terms and Conditions, Privacy Policy, and Disclaimers have been updated.


Welcome to the US Morning Crypto Briefing—your essential rundown of the most important developments in crypto for the day ahead.
Grab a coffee to see how Bitcoin is holding firm above $79,000 despite a sharp equities sell-off. Markets are bracing for the March NFP report and rising recession risks. With Fed rate cuts on the table and ETF inflows staying strong, all eyes are on what’s next for macro and crypto markets.
Is Bitcoin in a Bear Market?
The highly anticipated March U.S. non-farm payrolls (NFP) report is due later today, and it’s expected to play a key role in shaping market sentiment heading into the weekend.
“With the key macro risk event now behind us, attention turns to tonight’s non-farm payroll report. Investors are bracing for signs of softness in the U.S. labour market. A weaker-than-expected print would bolster the case for further Fed rate cuts this year, as policymakers attempt to cushion a decelerating economy. At the time of writing, markets are pricing in four rate cuts in 2025—0.25 bps each in June, July, September and December,” QCP Capital analysts said.
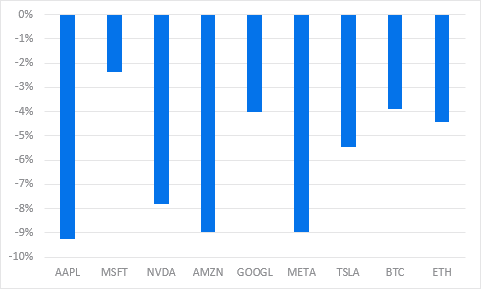
Traditional markets are increasingly pricing in a recession, with equities retreating sharply—a 7% decline overall, including a 5% drop just yesterday. This broad de-risking environment helps explain the current pause in crypto inflows.
On the derivatives front, QCP adds:
“On the options front, the desk continues to observe elevated volatility in the short term, with more buyers of downside protection. This skew underscores the prevailing mood – uncertain and cautious.”
However, they also note that “with positioning now light and risk assets largely oversold, the stage may be set for a near-term bounce.”
Bitcoin remains resilient despite market volatility, holding above $79,000 with strong ETF inflows and signs of decoupling from stocks and altcoins. According to Nic Puckrin, crypto analyst, investor, and founder of The Coin Bureau: “Bitcoin is nowhere near a bear market at this stage. The future of many altcoins, however, is more questionable.”
Chart of the Day
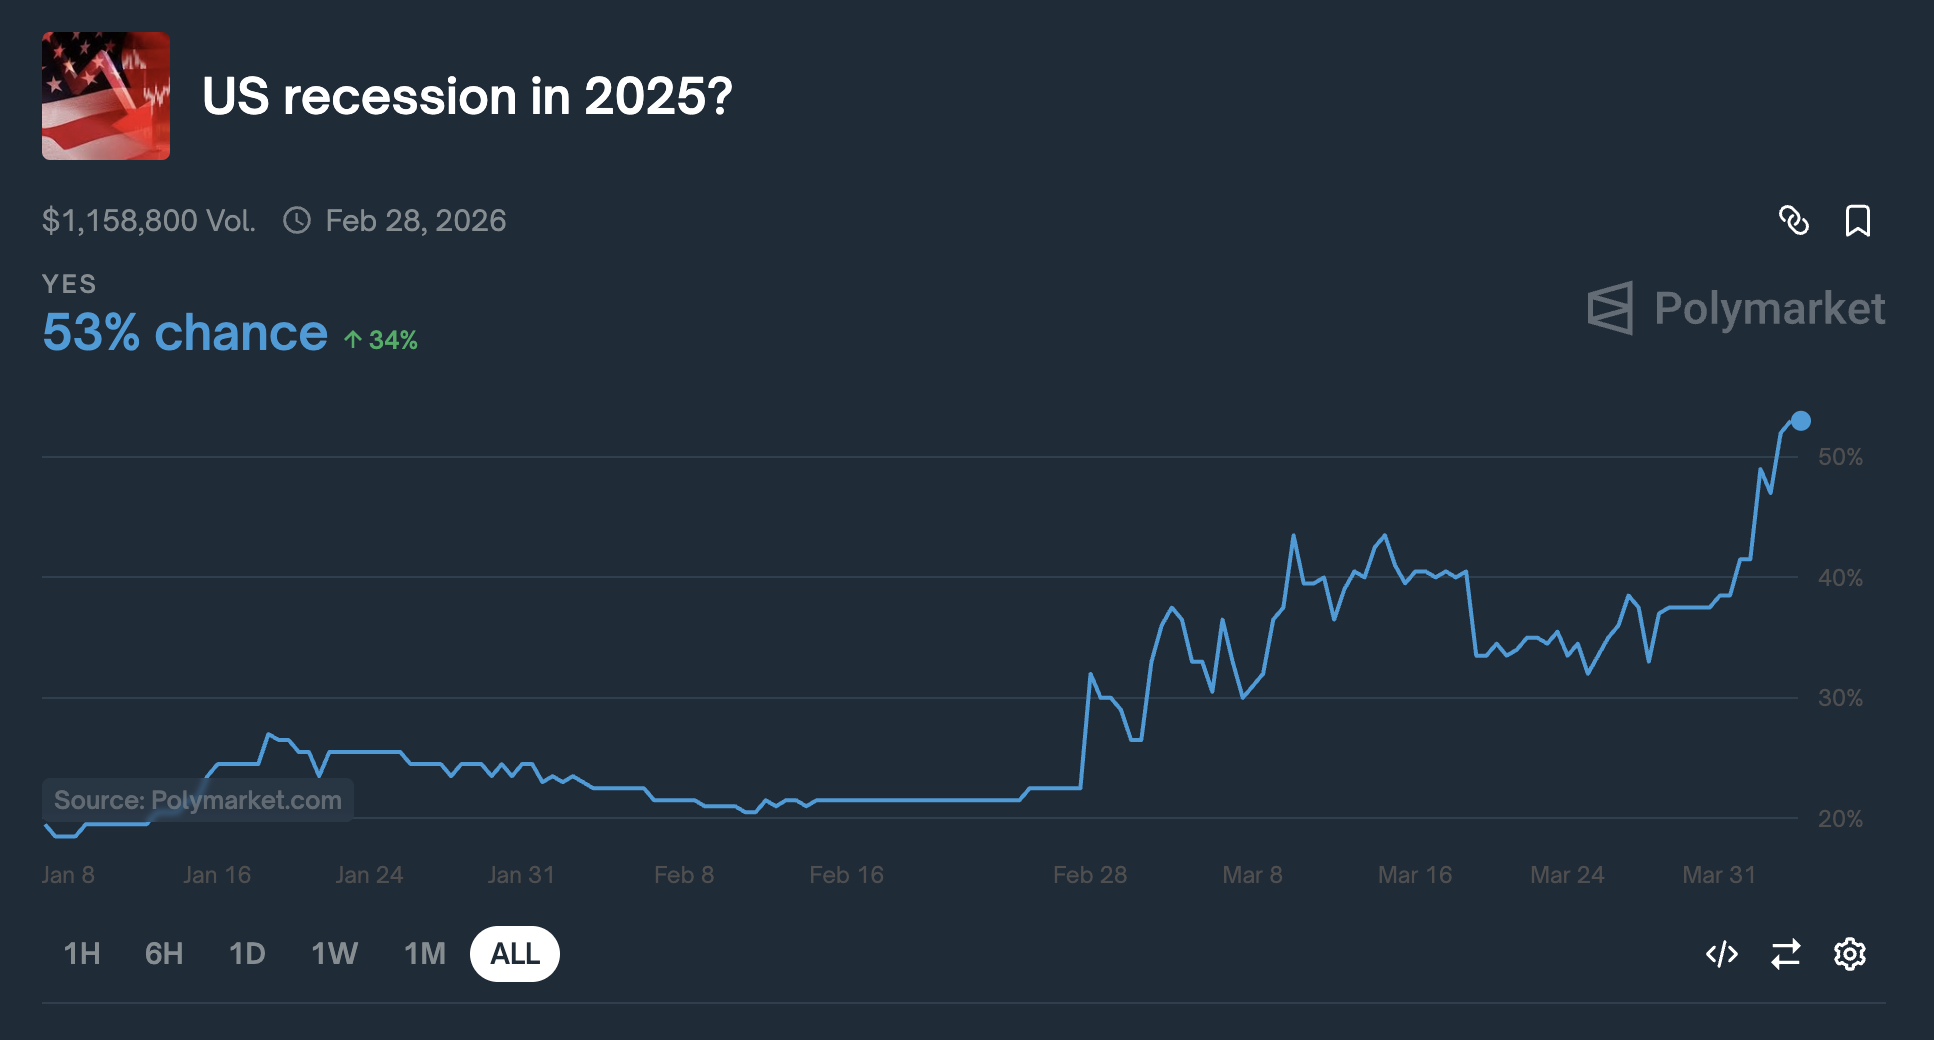
Chances of a US Recession in 2025 jumped above 50% for the first time, currently at 53%.
Byte-Sized Alpha
– Major ETF issuers are buying Bitcoin, with $220 million in inflows showing strong confidence despite volatility.
– Futures show bullish BTC sentiment, but options traders remain cautious, signaling mixed market outlook.
– Coinbase is launching XRP futures after Illinois lawsuit relief, signaling growing regulatory support for crypto.
– Despite Trump’s tariff-driven crash, analysts see potential for a Bitcoin rebound—though inflation may cap gains.
– The Anti-CBDC bill passed a key House vote, aiming to block Fed-issued digital currencies and protect privacy.
– Today at 11:25 AM, Fed Chair Jerome Powell will deliver a speech on the U.S. economic outlook.
Disclaimer
In line with the Trust Project guidelines, this price analysis article is for informational purposes only and should not be considered financial or investment advice. BeInCrypto is committed to accurate, unbiased reporting, but market conditions are subject to change without notice. Always conduct your own research and consult with a professional before making any financial decisions. Please note that our Terms and Conditions, Privacy Policy, and Disclaimers have been updated.

Cardano has experienced a tough period, with the failed price recovery and declining market conditions. However, the recent buying behavior of whales and the potential for a price surge suggest a change in momentum.
If Cardano (ADA) can break through the $0.70 level, it could signal the end of the bearish sentiment.
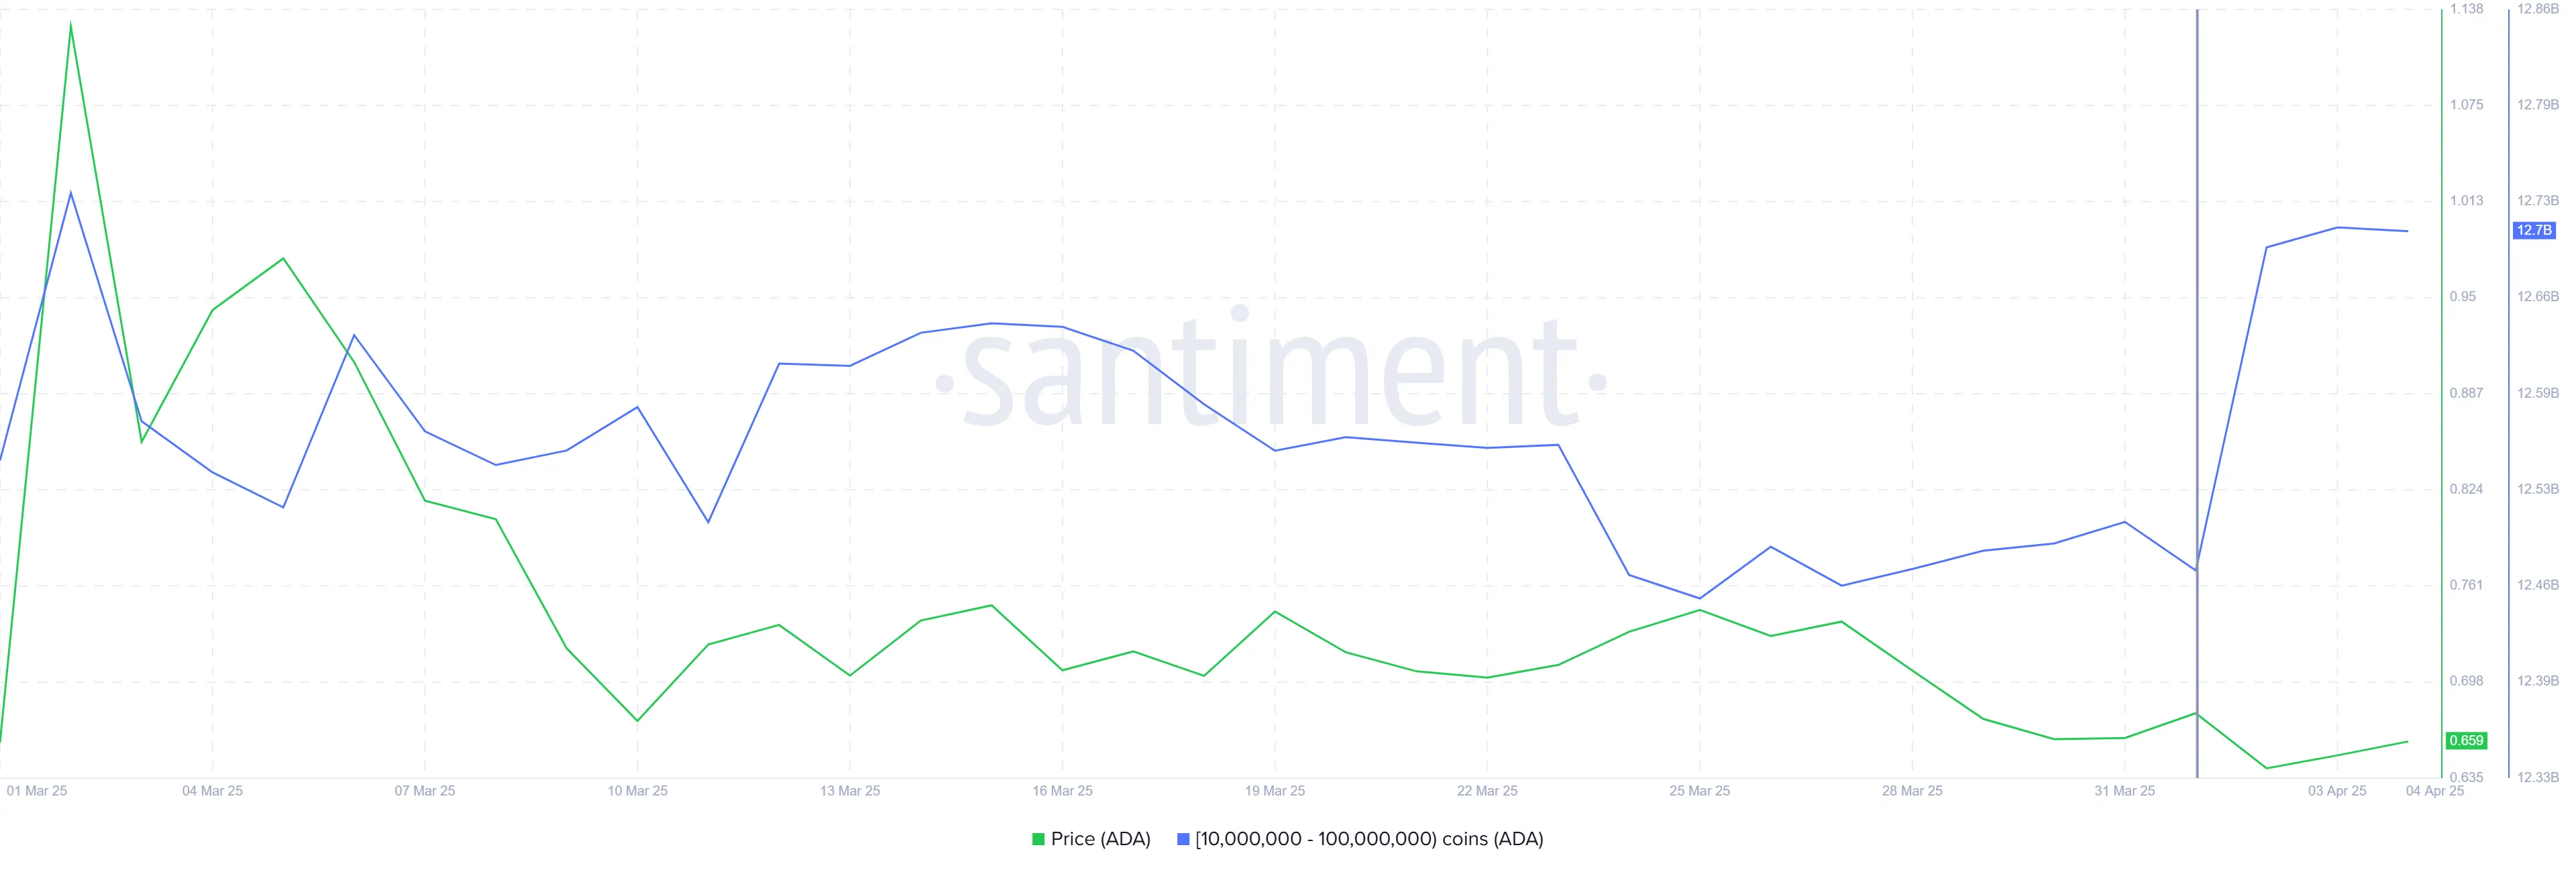
Cardano Whales Are Hopeful
Over the past 72 hours, whales holding between 10 million and 100 million ADA have accumulated over 230 million ADA, valued at over $150 million at current prices. This shift from selling and staying neutral to accumulation indicates a shift in sentiment, with whales optimistic about ADA’s potential for Q2 2025. Their recent activity signals confidence in the altcoin’s recovery despite the recent market struggles.
Whale accumulation is often a bullish indicator as these investors have significant influence over the market. The accumulation is crucial, as it provides the support needed for ADA to break through resistance levels.
The liquidation map for Cardano shows that approximately $15 million in short contracts will expire as soon as ADA rises above the $0.70 level. This presents a key opportunity for the altcoin. Short-sellers may be forced to close their positions, which could lead to a short squeeze and drive the price higher.
Potential liquidation of short positions may create upward pressure, preventing further declines and allowing ADA to recover. The combination of whale accumulation and the looming liquidation of short contracts could provide Cardano with the momentum it needs to break free from its recent downtrend.

Can ADA Price Breach $0.70?
At the time of writing, Cardano’s price is at $0.65, holding above the crucial $0.62 support level. The altcoin has struggled in recent weeks, but the whale-buying activity offers hope for recovery. A breach of the $0.70 barrier could lead to further upward movement.
Should ADA successfully break through $0.70, it could gain the necessary momentum to continue its recovery. Flipping $0.77 into support would provide an additional boost, positioning Cardano to regain recent losses and possibly challenge higher resistance levels.

However, if Cardano fails to breach $0.70, the price may return to the $0.62 support level. Losing this support would invalidate the bullish outlook and send ADA to a lower level of $0.58, extending the ongoing decline.
Disclaimer
In line with the Trust Project guidelines, this price analysis article is for informational purposes only and should not be considered financial or investment advice. BeInCrypto is committed to accurate, unbiased reporting, but market conditions are subject to change without notice. Always conduct your own research and consult with a professional before making any financial decisions. Please note that our Terms and Conditions, Privacy Policy, and Disclaimers have been updated.
Standard Chartered has predicted that Bitcoin (BTC) will likely break above $88,500 this weekend following a strong performance in the tech sector.
The bank’s Global Head of Digital Assets Research, Geoff Kendrick, shared these expectations in an exclusive with BeInCrypto.
What Standard Chartered Says About Bitcoin This Weekend
In an email to BeInCrypto, Kendrick pointed to recent price action among major technology stocks, including Microsoft, as an indicator of Bitcoin’s short-term trajectory.
“Strongest performers were MSFT and BTC. Same again so for today in Bitcoin spot and tech futures,” Kendrick said.
He explained that a decisive break above the critical $85,000 level appears likely post-US non-farm payrolls. The Standard Chartered executive explained that such an outcome would pave the way for a return to Wednesday’s pre-tariff level of $88,500.
However, China’s retaliatory tariffs could increase market uncertainty, driving prices down in the short term. This volatility might dampen investor confidence, overshadowing any weekend gains.
Kendrick’s assertions come ahead of the much-anticipated US employment report, Non-Farm Payrolls (NFP). The report would present a comprehensive labor market update, including jobs added, the unemployment rate, and wage growth.
A strong report could bolster faith in the economy, particularly if it comes in higher than the previous reading of 151,000 jobs. This is more so if accompanied by a steady 4.1% unemployment rate. Such an outcome could curb crypto gains if the dollar rallies.
Conversely, a disappointing tally, potentially below the median forecast of 140,000 jobs with unemployment ticking beyond 4.1%, could ignite recession worries. This would send investors flocking to Bitcoin and crypto.
Standard Chartered may be pivoting to the latter outcome, with Kendrick emphasizing Bitcoin’s growing role as a key asset.
“Bitcoin is proving itself to be the best of tech upside when stocks go up and also as a hedge in multiple scenarios…I argued that Bitcoin trades more like tech stocks than it does gold most of the time. At other times, and structurally, Bitcoin is useful as a TradFi hedge,” he added.
Standard Chartered has increasingly highlighted Bitcoin’s strategic importance within financial markets. The bank recently identified Bitcoin and Avalanche (AVAX) as likely beneficiaries of a potential post-Liberation Day crypto surge. BeInCrypto reported the forecast, which now aligns with the latest one, that institutional investors could be preparing for a market upswing.
Additionally, the bank has positioned Bitcoin as a growing hedge against inflation. It argued that its limited supply and decentralized nature make it an attractive alternative to traditional safe-haven assets.
Standard Chartered Calls to HODL Bitcoin
Amid Bitcoin’s growing role in traditional finance (TradFi), Kendrick advised investors to maintain their holdings.
“Over the last 36 hours, I think we can also add ‘US isolation’ hedge to the list of Bitcoin uses,” he added.
This suggests that Bitcoin could serve as a protective asset in geopolitical and macroeconomic uncertainty.
Meanwhile, the BTC/USDT daily chart shows a critical technical setup, with Bitcoin’s price currently trading around $82,643. A former support level of $85,000 now stands as resistance, limiting the pioneer crypto’s upside potential. The supply zone near $86,508 adds further selling pressure.
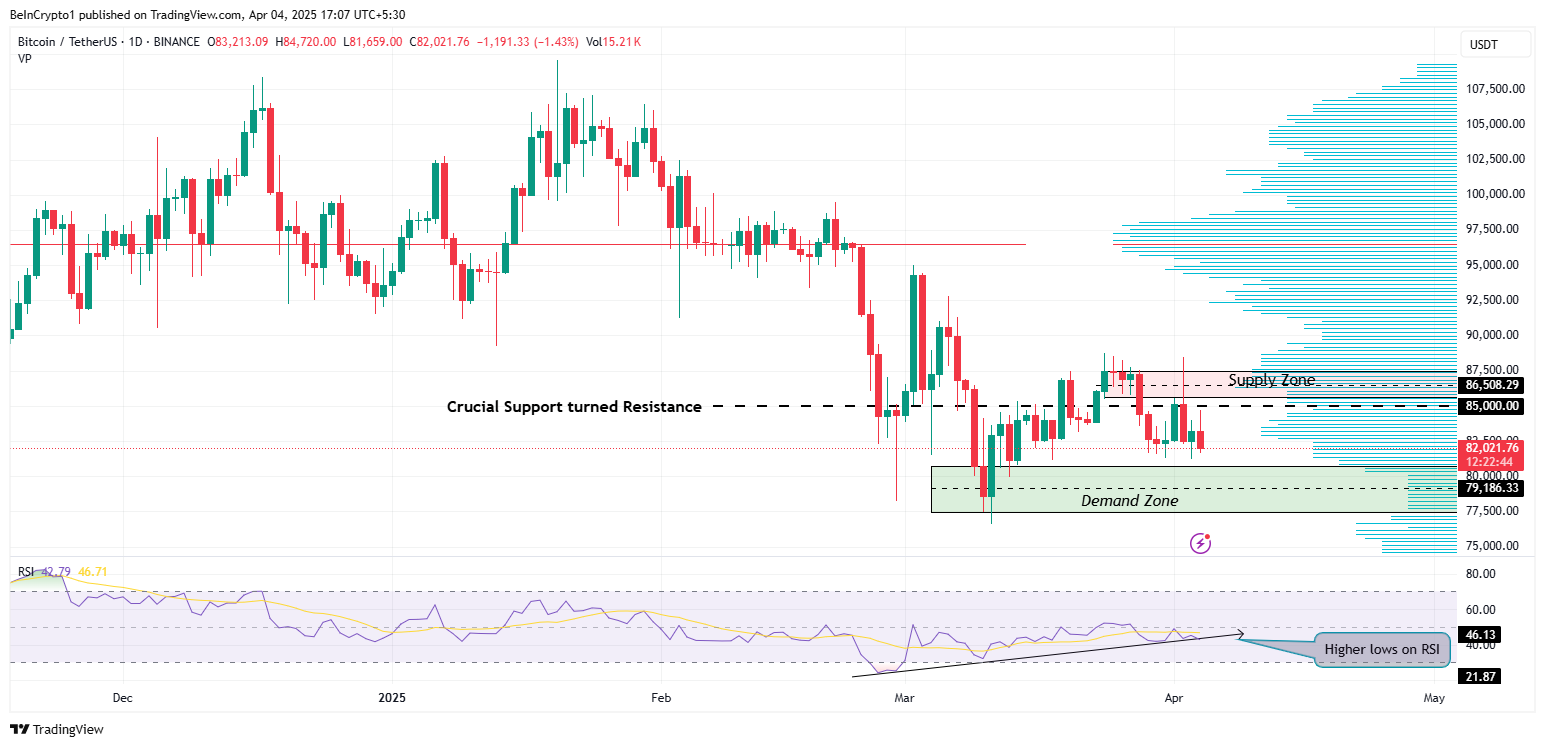
On the downside, a key demand zone between $77,500 and $80,708 provides support. Despite price consolidation, the Relative Strength Index (RSI) is forming higher lows, indicating sustained growing momentum and a potential reversal.
If BTC successfully reclaims $85,000, it could trigger a move toward $87,480. However, to confirm the continuation of the uptrend, BTC must record a daily candlestick close above the midline of the supply zone at $86,508.
The bullish volume profile (blue) supports this thesis, showing that bulls are waiting to interact with the Bitcoin price above the midline of the supply zone.
Failure to breach the immediate resistance at $85,000 might lead to a retest of the demand zone, potentially breaking lower. In such a directional bias, a break and close below the midline of this zone at $79,186 could exacerbate the downtrend.
Disclaimer
In adherence to the Trust Project guidelines, BeInCrypto is committed to unbiased, transparent reporting. This news article aims to provide accurate, timely information. However, readers are advised to verify facts independently and consult with a professional before making any decisions based on this content. Please note that our Terms and Conditions, Privacy Policy, and Disclaimers have been updated.

Bitcoin is Far From a Bear Market But not Altcoins, Analysts Claim

Bitcoin Drops as China Escalates Trade War With 34% Tariff on US
Cardano Price Recovery Next As Whales Buy 230 Million ADA

Fresh $36M Bitcoin Transfer By Bhutan Sparks Speculation—Dump Alert?

Standard Chartered Calls for Bitcoin Push Above $88,500

BTC Holds $84K, ATOM & FIL Become Top Gainers


-
 Regulation23 hours ago
US Senate Banking Committee Approves Paul Atkins Nomination For SEC Chair Role
-

 Market21 hours ago
Binance Managed 94% of All Crypto Airdrops and Staking Rewards
-

 Market23 hours ago
TRUMP Token Hits Record Low Due To Liberation Day Tariffs
-
 Regulation20 hours ago
US SEC Acknowledges Fidelity’s Filing for Solana ETF
-

 Market22 hours ago
Pi Network Price Falls To Record New Low Amid Weak Inflows
-

 Market20 hours ago
XRP Battle Between Bulls And Bears Hinges On $1.97 – What To Expect
-

 Market19 hours ago
Ripple Shifts $1B in XRP Amid Growing Bearish Pressure
-

 Market18 hours ago
Wormhole (W) Jumps 10%—But Is a Pullback Coming?
 Arabic
 Chinese (Simplified)
 Dutch
Dutch English
 French
 German
 Italian
 Portuguese
 Russian
 Spanish
 Vietnamese