
Market
Is Bitcoin (BTC) Price Set for a Year-End Rally in 2024?

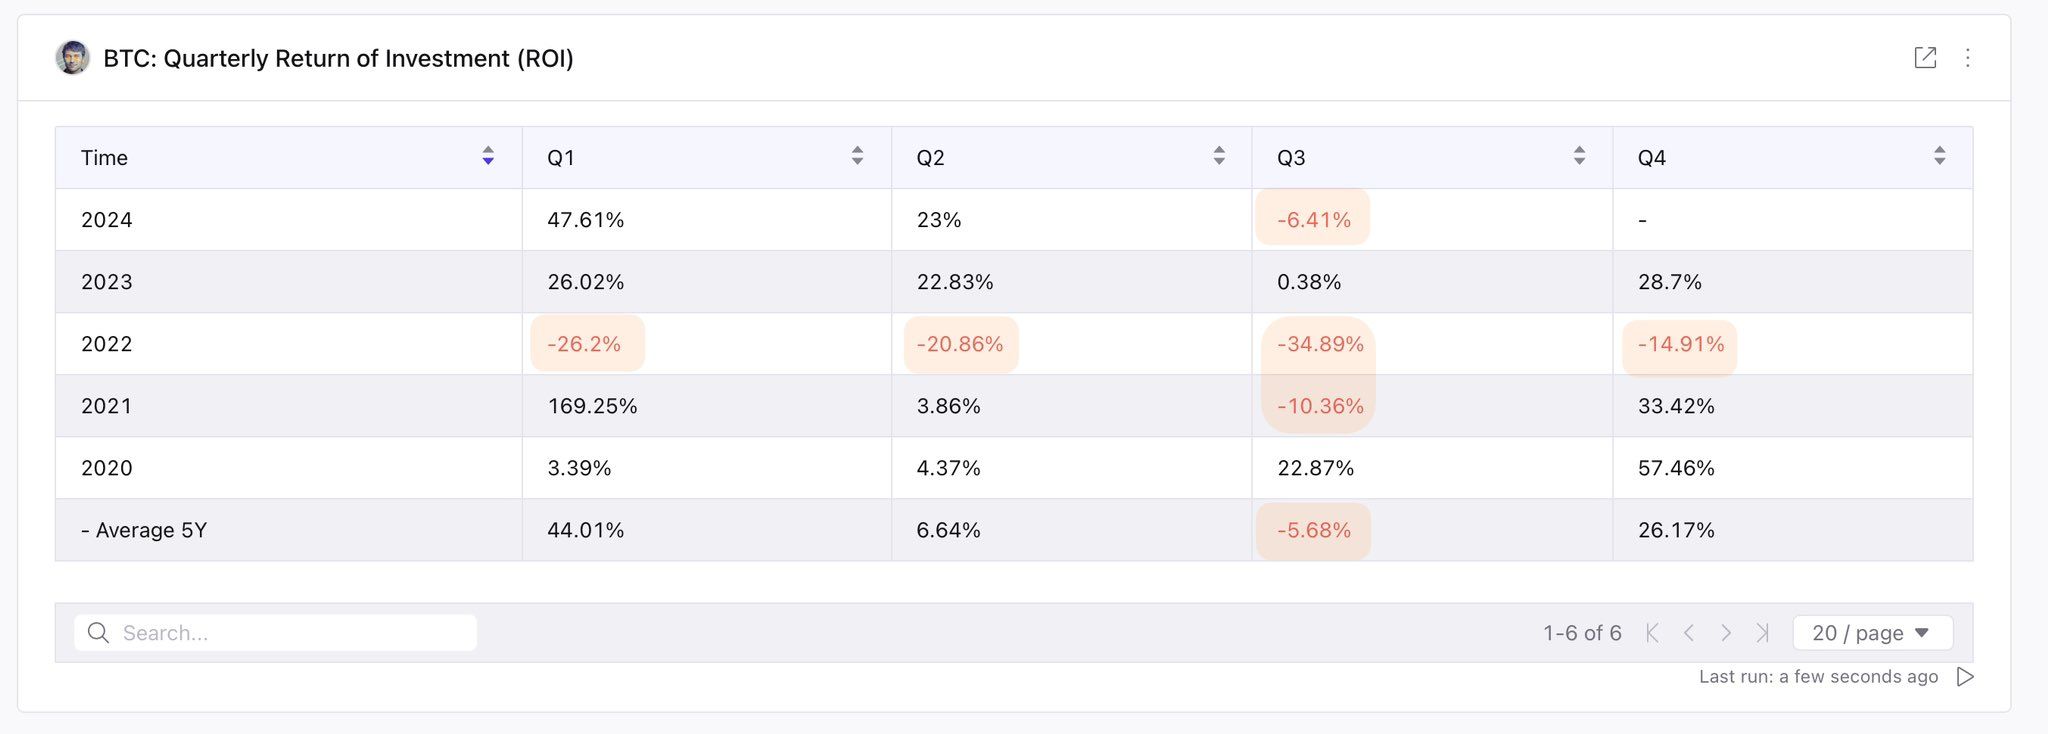
Bitcoin’s (BTC) price has experienced varying levels of return for each quarter of the last five years. However, one thing synonymous with these periods is how the coin produces a positive return between October and December.
With September approaching, BTC could be close to another season where the price might go on a parabolic rally. Will it be the same this time?
What History Says About Bitcoin Performance in Q4
Historically, Bitcoin’s price tends to underperform in the third quarter (Q3). However, according to a chart shared by analyst Axel Adler, Bitcoin has seen an average increase of 26% every fourth quarter (Q4) since 2019.
For example, in October 2023, BTC traded around $26,000. By December, it had surged to $44,000. In contrast, Bitcoin didn’t achieve such gains in 2022 due to the FTX contagion, which pushed the market into a bear phase.
In 2021, Bitcoin rose from $40,000 to $69,000 between September and November, before experiencing a slight decline in December. A similar pattern occurred in 2020 when BTC’s price doubled during Q4.
Read more: What Is Bitcoin? A Guide to the Original Cryptocurrency
If this pattern holds true, Bitcoin’s price could be poised for a significant increase once September ends. To gauge this potential, it’s crucial to evaluate the current market conditions surrounding the coin.
BeInCrypto specifically examines the Realized Price, which represents the average price the entire market paid for Bitcoin. Historically, this metric has served as an on-chain support or resistance level for BTC.
At press time, Bitcoin’s Realized Price is $31,400. This value appears to be providing support for the cryptocurrency, as indicated by the CryptoQuant chart below. For the Realized Price to act as resistance, it would need to align with or exceed Bitcoin’s current market value.
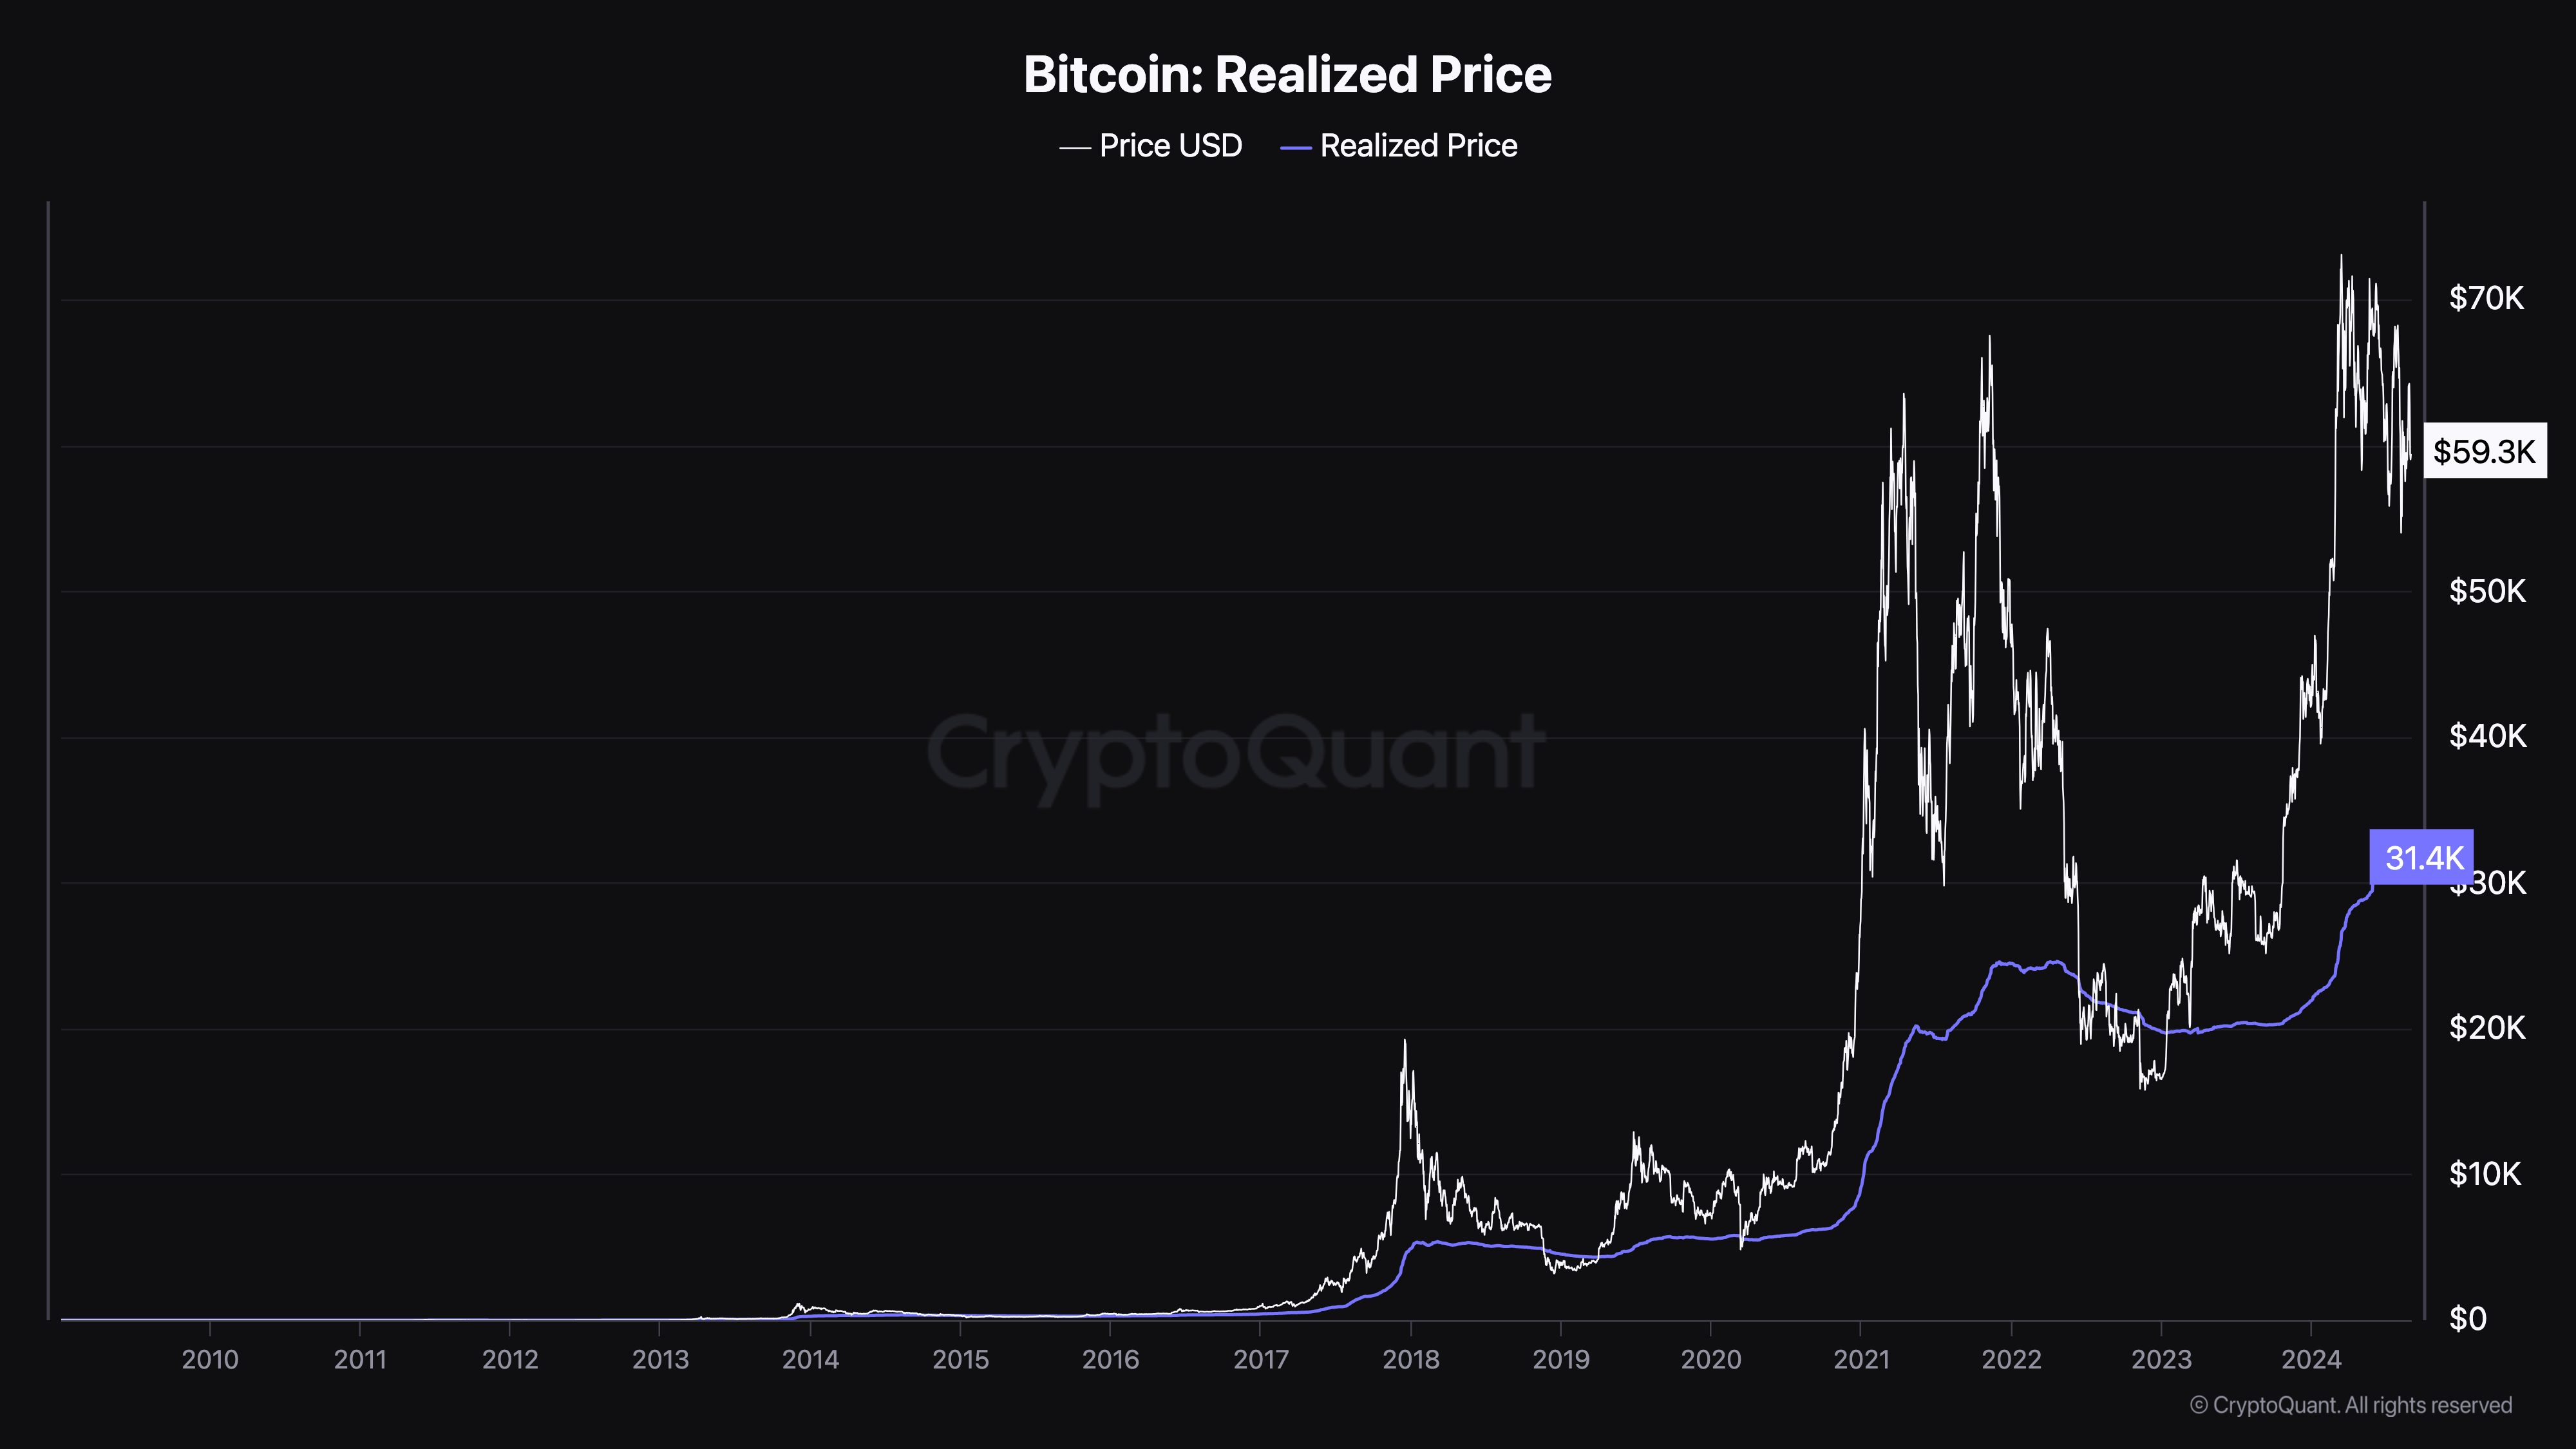
When this happens, the value tends to decrease afterward. Therefore, the current value of the metric suggests that Bitcoin still has a good upside potential. Hence, a significant price increase could be likely by Q4 and before the end of this year.
BTC Price Prediction: The Coin Hints at a 24% Gain, But First…
As of this writing, Bitcoin is trading at $59,551, down from $64,452. Notably, this price is hovering around the 200-day Exponential Moving Average (EMA), a key technical indicator that measures trend direction. The 200 EMA (blue) offers insights into the long-term trend.
When the 200 EMA rises above Bitcoin’s price, it often stalls the uptrend or pulls it down. Conversely, when the 200 EMA is below the price, it creates room for Bitcoin to grow. Currently, if BTC fails to climb above this indicator, its price could drop to $57,818 or potentially as low as $54,474.
The Chaikin Money Flow (CMF), which tracks the flow of liquidity into a cryptocurrency, also supports the possibility of a decline. The CMF reading has dropped, signaling a decrease in buying pressure.
Read more: Bitcoin (BTC) Price Prediction 2024/2025/2030
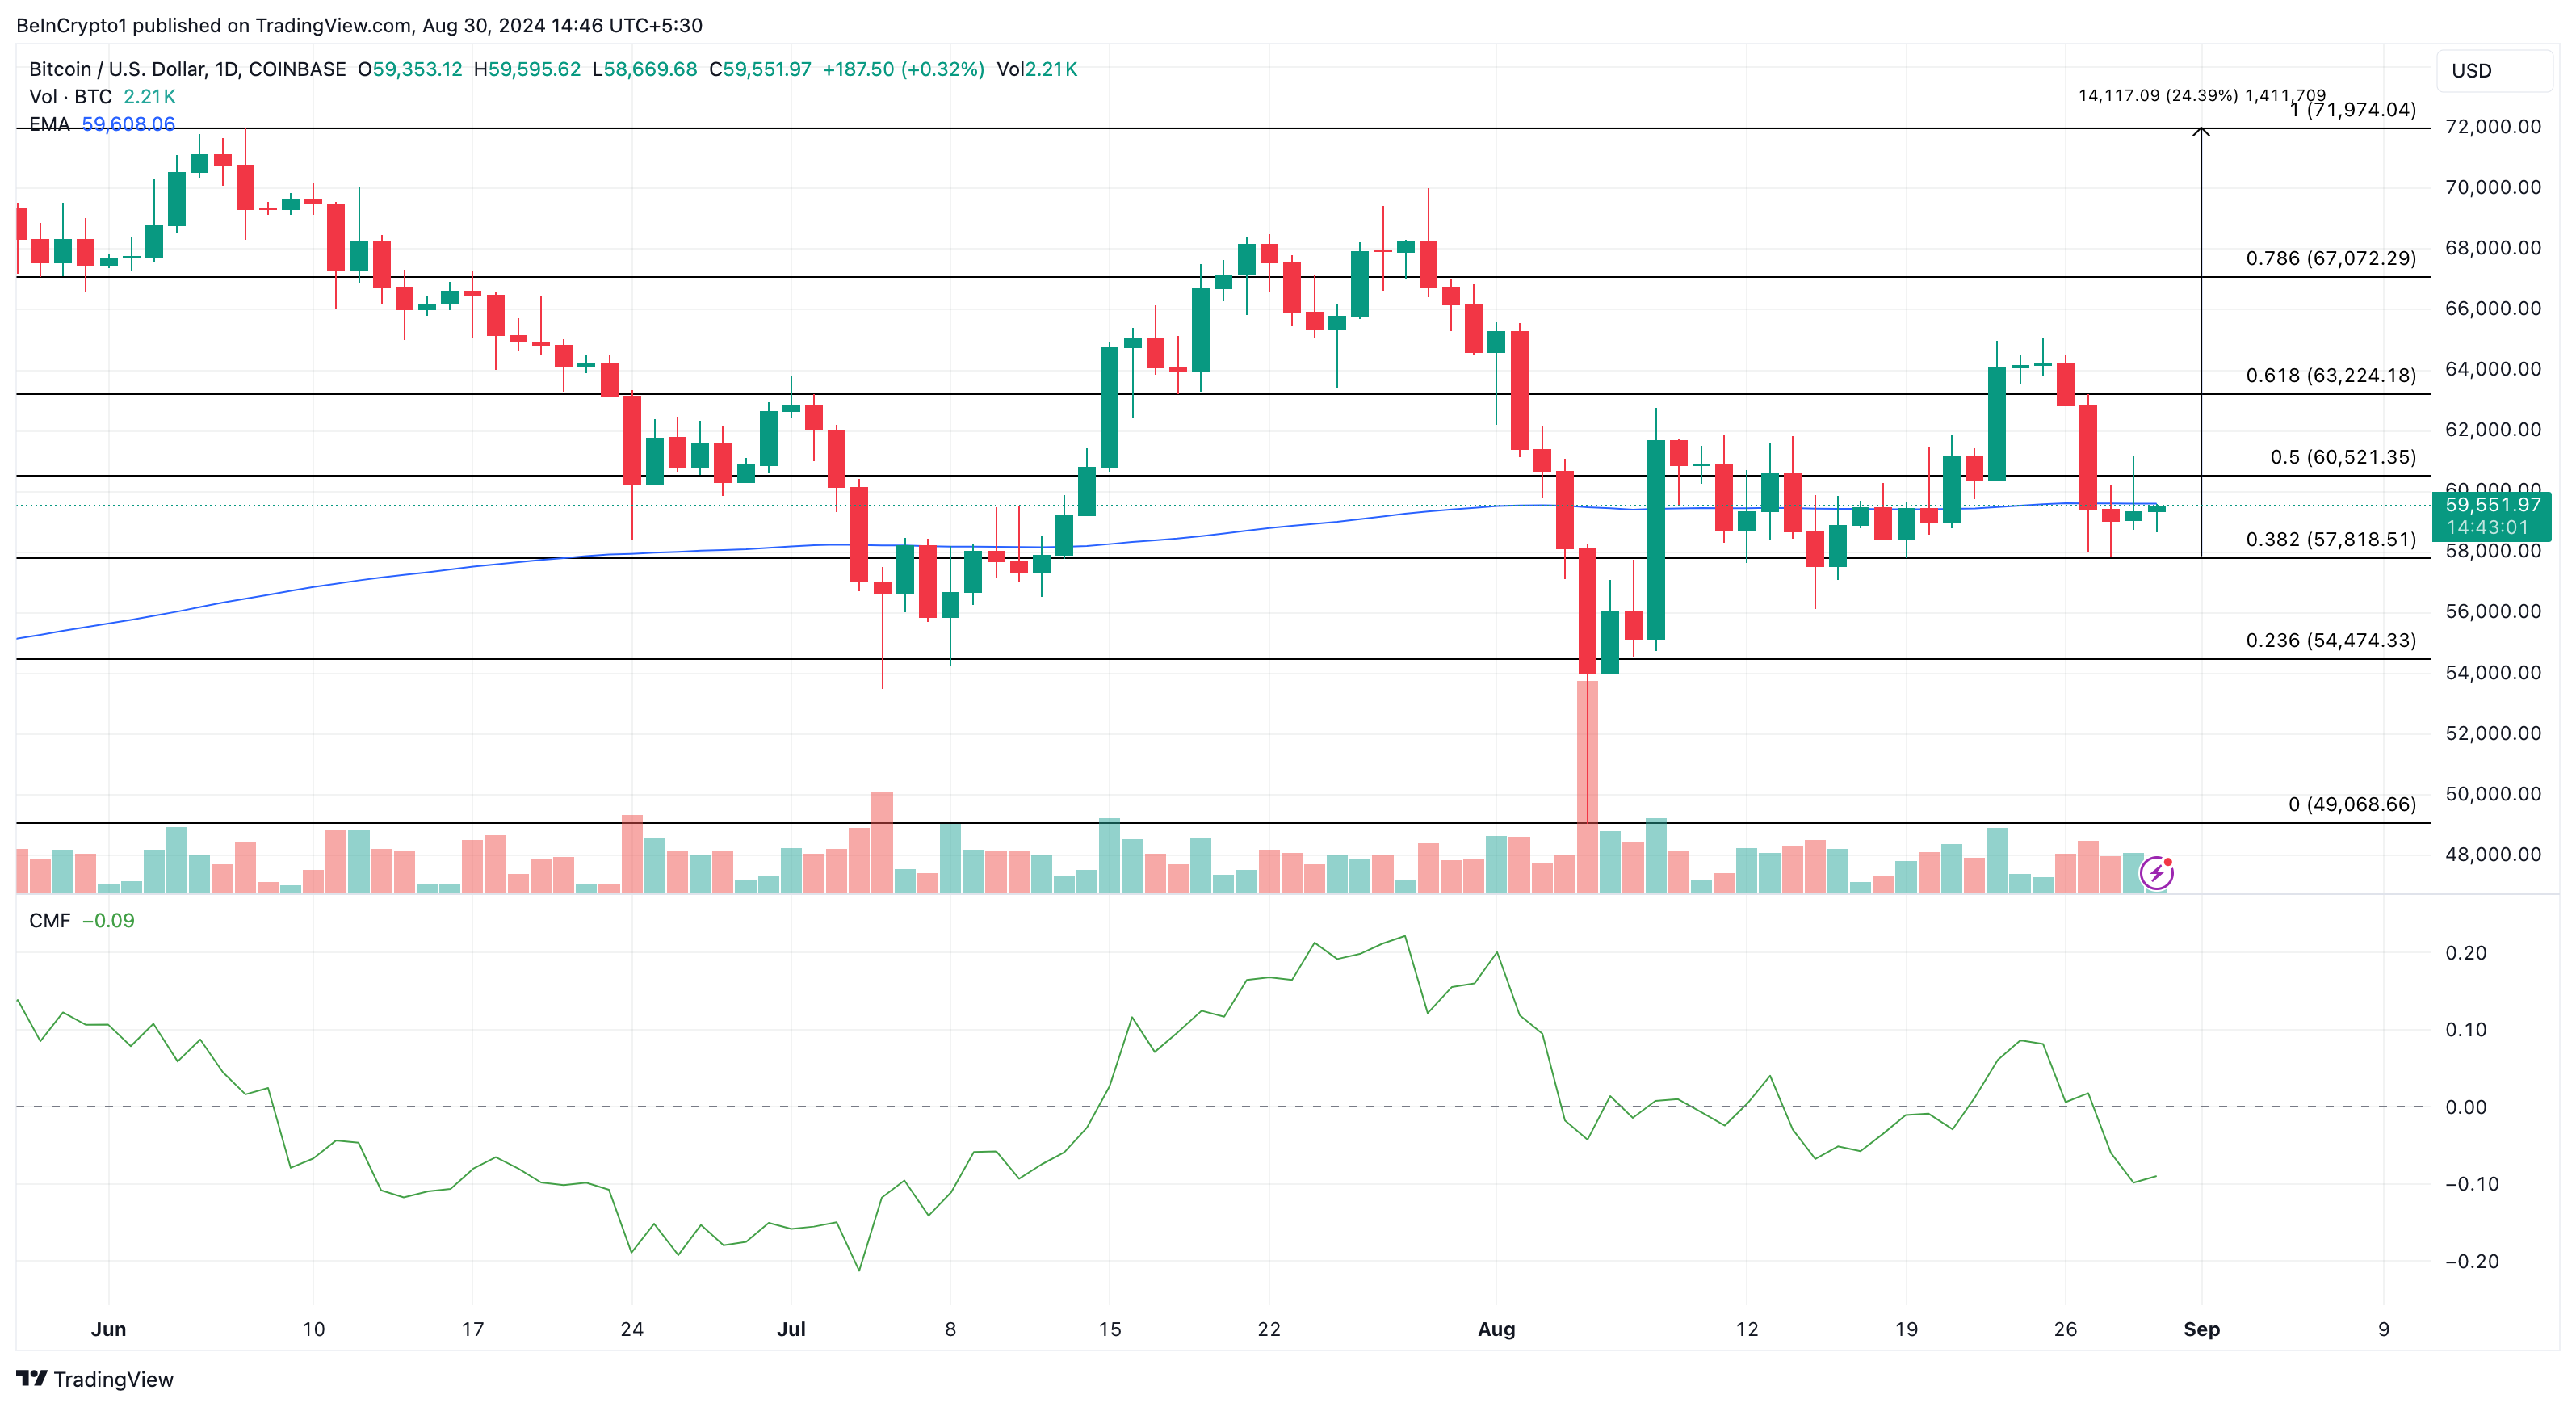
However, if past performance is any indication, BTC could rise by 24% in the early months of Q4, pushing the coin’s price to $71,974. On the other hand, if the broader market experiences a significant decline in capital inflow, this prediction could be invalidated, potentially causing Bitcoin’s price to fall to $49,068.
Disclaimer
In line with the Trust Project guidelines, this price analysis article is for informational purposes only and should not be considered financial or investment advice. BeInCrypto is committed to accurate, unbiased reporting, but market conditions are subject to change without notice. Always conduct your own research and consult with a professional before making any financial decisions. Please note that our Terms and Conditions, Privacy Policy, and Disclaimers have been updated.


Brian Quintenz, the incoming Chair of the US CFTC (Commodity Futures Trading Commission), has begun meeting with Capitol Hill lawmakers before his nomination hearing.
On Monday, Quintenz met with Senator Chuck Grassley (R-IA) to discuss key regulatory issues, including the CFTC’s role in overseeing crypto spot markets.
CFTC Targets Crypto Spot Market After Derivatives
Brian Quintenz met with Republican Senator from Iowa Chuck Grassley to discuss another element in the CFTC’s crypto market structure regulation agenda. This time, the focus is on crypto spot markets.
“It was wonderful to meet with you Chuck Grassley and discuss your leadership on whistleblower issues as well as the future of the agency,” Quintenz stated.
Grassley also commented on their discussion. He highlighted the CFTC Whistleblower Protection Program for spot crypto markets as part of the agenda. Notably, Grassley is a member of the Senate AG Committee, the legislative body overseeing the CFTC.
Eleanor Terrett, host of the Crypto America podcast, indicated that the Senate AG Committee will have a significant role in part of the CFTC’s crypto regulation agenda. Specifically, it would have an outsized say in whether the CFTC could gain expanded jurisdiction over crypto spot markets.
The meeting comes as the CFTC moves closer to expanding its role in crypto regulation. US President Donald Trump tapped Quintenz, a former executive at venture capital firm Andreessen Horowitz (a16z), to lead the agency.
His appointment is part of Trump’s broader plans to reshape crypto oversight. This could potentially give the CFTC greater authority over digital asset markets.
Meanwhile, regulatory developments surrounding crypto have accelerated in recent weeks. The CFTC eased regulatory hurdles for the crypto derivatives market only days ago. The move will enhance market efficiency and attract institutional investors.
Beyond derivatives and spot markets, the CFTC is also exploring other areas of crypto oversight. The agency recently announced plans to host a roundtable discussion on prediction market regulation. It aims to address the regulation of decentralized prediction platforms.
Stablecoins are also on the agency’s radar. The CFTC also revealed a forum to discuss stablecoin regulation and potential risks associated with their widespread adoption.
Additionally, the Federal Deposit Insurance Corporation (FDIC) and the CFTC revoked previous crypto-related guidelines, signaling a shift in regulatory strategy.
Crypto markets can also not rule out the possibility of further collaboration between key agencies in the broader industry. Reports indicate that the US SEC (Securities and Exchange Commission) and the CFTC have discussed reviving a joint advisory committee to coordinate on crypto regulation.
If revived, the committee could serve as a bridge between the agencies. This would address concerns over jurisdictional overlap and streamlining oversight efforts.
As Quintenz prepares for his nomination hearing, his meetings with lawmakers suggest that crypto regulation will be a top priority for the CFTC moving forward.
Disclaimer
In adherence to the Trust Project guidelines, BeInCrypto is committed to unbiased, transparent reporting. This news article aims to provide accurate, timely information. However, readers are advised to verify facts independently and consult with a professional before making any decisions based on this content. Please note that our Terms and Conditions, Privacy Policy, and Disclaimers have been updated.

Solana started a fresh decline below the $132 support zone. SOL price is now consolidating and might struggle to recover above the $126 resistance.
- SOL price started a recovery wave from the $122 support zone against the US Dollar.
- The price is now trading below $130 and the 100-hourly simple moving average.
- There is a key rising channel forming with support at $124 on the hourly chart of the SOL/USD pair (data source from Kraken).
- The pair could start a fresh increase if the bulls clear the $126 zone.
Solana Price Faces Resistance
Solana price started a fresh decline below the $135 and $132 levels, like Bitcoin and Ethereum. SOL even declined below the $125 support level before the bulls appeared.
A low was formed at $122.64 and the price recently started a consolidation phase. There was a minor increase above the $125 level. The price tested the 23.6% Fib retracement level of the downward move from the $140 swing high to the $122 low.
Solana is now trading below $126 and the 100-hourly simple moving average. There is also a key rising channel forming with support at $124 on the hourly chart of the SOL/USD pair.
On the upside, the price is facing resistance near the $126 level. The next major resistance is near the $128 level. The main resistance could be $132 or the 50% Fib retracement level of the downward move from the $140 swing high to the $122 low.

A successful close above the $132 resistance zone could set the pace for another steady increase. The next key resistance is $136. Any more gains might send the price toward the $142 level.
Another Decline in SOL?
If SOL fails to rise above the $128 resistance, it could start another decline. Initial support on the downside is near the $124 zone. The first major support is near the $122 level.
A break below the $122 level might send the price toward the $115 zone. If there is a close below the $115 support, the price could decline toward the $102 support in the near term.
Technical Indicators
Hourly MACD – The MACD for SOL/USD is losing pace in the bearish zone.
Hourly Hours RSI (Relative Strength Index) – The RSI for SOL/USD is above the 50 level.
Major Support Levels – $124 and $122.
Major Resistance Levels – $128 and $132.

Reason to trust
![]()
Strict editorial policy that focuses on accuracy, relevance, and impartiality
Created by industry experts and meticulously reviewed
The highest standards in reporting and publishing
Strict editorial policy that focuses on accuracy, relevance, and impartiality
Morbi pretium leo et nisl aliquam mollis. Quisque arcu lorem, ultricies quis pellentesque nec, ullamcorper eu odio.
Ethereum price started another decline and traded below the $1,850 level. ETH is now consolidating and facing key hurdles near the $1,850 level.
- Ethereum struggled to continue higher above the $1,980 resistance level.
- The price is trading below $1,860 and the 100-hourly Simple Moving Average.
- There was a break above a connecting bearish trend line with resistance at $1,810 on the hourly chart of ETH/USD (data feed via Kraken).
- The pair must clear the $1,850 and $1,880 resistance levels to start a decent increase.
Ethereum Price Attempts Recovery
Ethereum price failed to continue higher above $2,050 and started another decline, like Bitcoin. ETH declined below the $1,880 and $1,850 support levels.
It tested the $1,765 zone. A low was formed at $1,767 and the price recently started a short-term recovery wave. The price climbed above the $1,800 resistance. There was a move above the 23.6% Fib retracement level of the downward move from the $2,033 swing high to the $1,767 low.
There was also a break above a connecting bearish trend line with resistance at $1,810 on the hourly chart of ETH/USD. Ethereum price is now trading below $1,860 and the 100-hourly Simple Moving Average.
On the upside, the price seems to be facing hurdles near the $1,850 level. The next key resistance is near the $1,860 level. The first major resistance is near the $1,900 level and the 50% Fib retracement level of the downward move from the $2,033 swing high to the $1,767 low.

A clear move above the $1,900 resistance might send the price toward the $2,000 resistance. An upside break above the $2,000 resistance might call for more gains in the coming sessions. In the stated case, Ether could rise toward the $2,050 resistance zone or even $2,120 in the near term.
Another Decline In ETH?
If Ethereum fails to clear the $1,850 resistance, it could start another decline. Initial support on the downside is near the $1,800 level. The first major support sits near the $1,780 zone.
A clear move below the $1,780 support might push the price toward the $1,765 support. Any more losses might send the price toward the $1,710 support level in the near term. The next key support sits at $1,665.
Technical Indicators
Hourly MACD – The MACD for ETH/USD is losing momentum in the bearish zone.
Hourly RSI – The RSI for ETH/USD is now above the 50 zone.
Major Support Level – $1,800
Major Resistance Level – $1,850

A Make or Break Situation As Ripple Crypto Flirts Around $2

CFTC’s Crypto Market Overhaul Under New Chair Brian Quintenz

$2,300 Emerges As The Most Crucial Resistance

Solana (SOL) Holds Steady After Decline—Breakout or More Downside?

Ethereum Price Faces a Tough Test—Can It Clear the Hurdle?

Top 3 Made in USA Coins to Watch In April

2.52 Million Altcoins Are Ruining Crypto’s Future

Animoca Brands Valuation Tanks 75% In Two Years, Here’s Why

Crypto exchange BingX hacked for $43 million

Are The Big Players Losing Interest?

Hong Kong’s Securities Association Tips Authorities On Crypto Self-Regulation

Coinbase cbBTC Set to go Live on Solana
2.52 Million Altcoins Are Ruining Crypto’s Future
Animoca Brands Valuation Tanks 75% In Two Years, Here’s Why
Crypto exchange BingX hacked for $43 million
Are The Big Players Losing Interest?
Hong Kong’s Securities Association Tips Authorities On Crypto Self-Regulation
Coinbase cbBTC Set to go Live on Solana
-

 Market16 hours ago
Bitcoin Mining Faces Tariff Challenges as Hashrate Hits New ATH
-

 Market21 hours ago
Don’t Fall for These Common Crypto Scams
-
 Bitcoin14 hours ago
Strategy Adds 22,048 BTC for Nearly $2 Billion
-
 Market19 hours ago
Strategic Move for Trump Family in Crypto
-
 Market13 hours ago
Trump Family Gets Most WLFI Revenue, Causing Corruption Fears
-
 Altcoin18 hours ago
$33 Million Inflows Signal Market Bounce
-
 Market23 hours ago
Bitcoin Price Nears $80,000; Fuels Death Cross Potential
-

 Ethereum22 hours ago
Ethereum Is ‘Completely Dead’ As An Investment: Hedge Fund