
Market
Nearly 2 Trillion PEPE Purchased by Diamond Hands: Price Impact

A trader who previously made an 886% return from buying PEPE is purchasing the meme coin again. This trader had initially bought 170 billion tokens in October 2023.
When they sold their holdings in July, they gained $1.77 million. The question now is whether this recent accumulation could yield similar results.
Pepe Big Players Reinvest in the Meme Coin
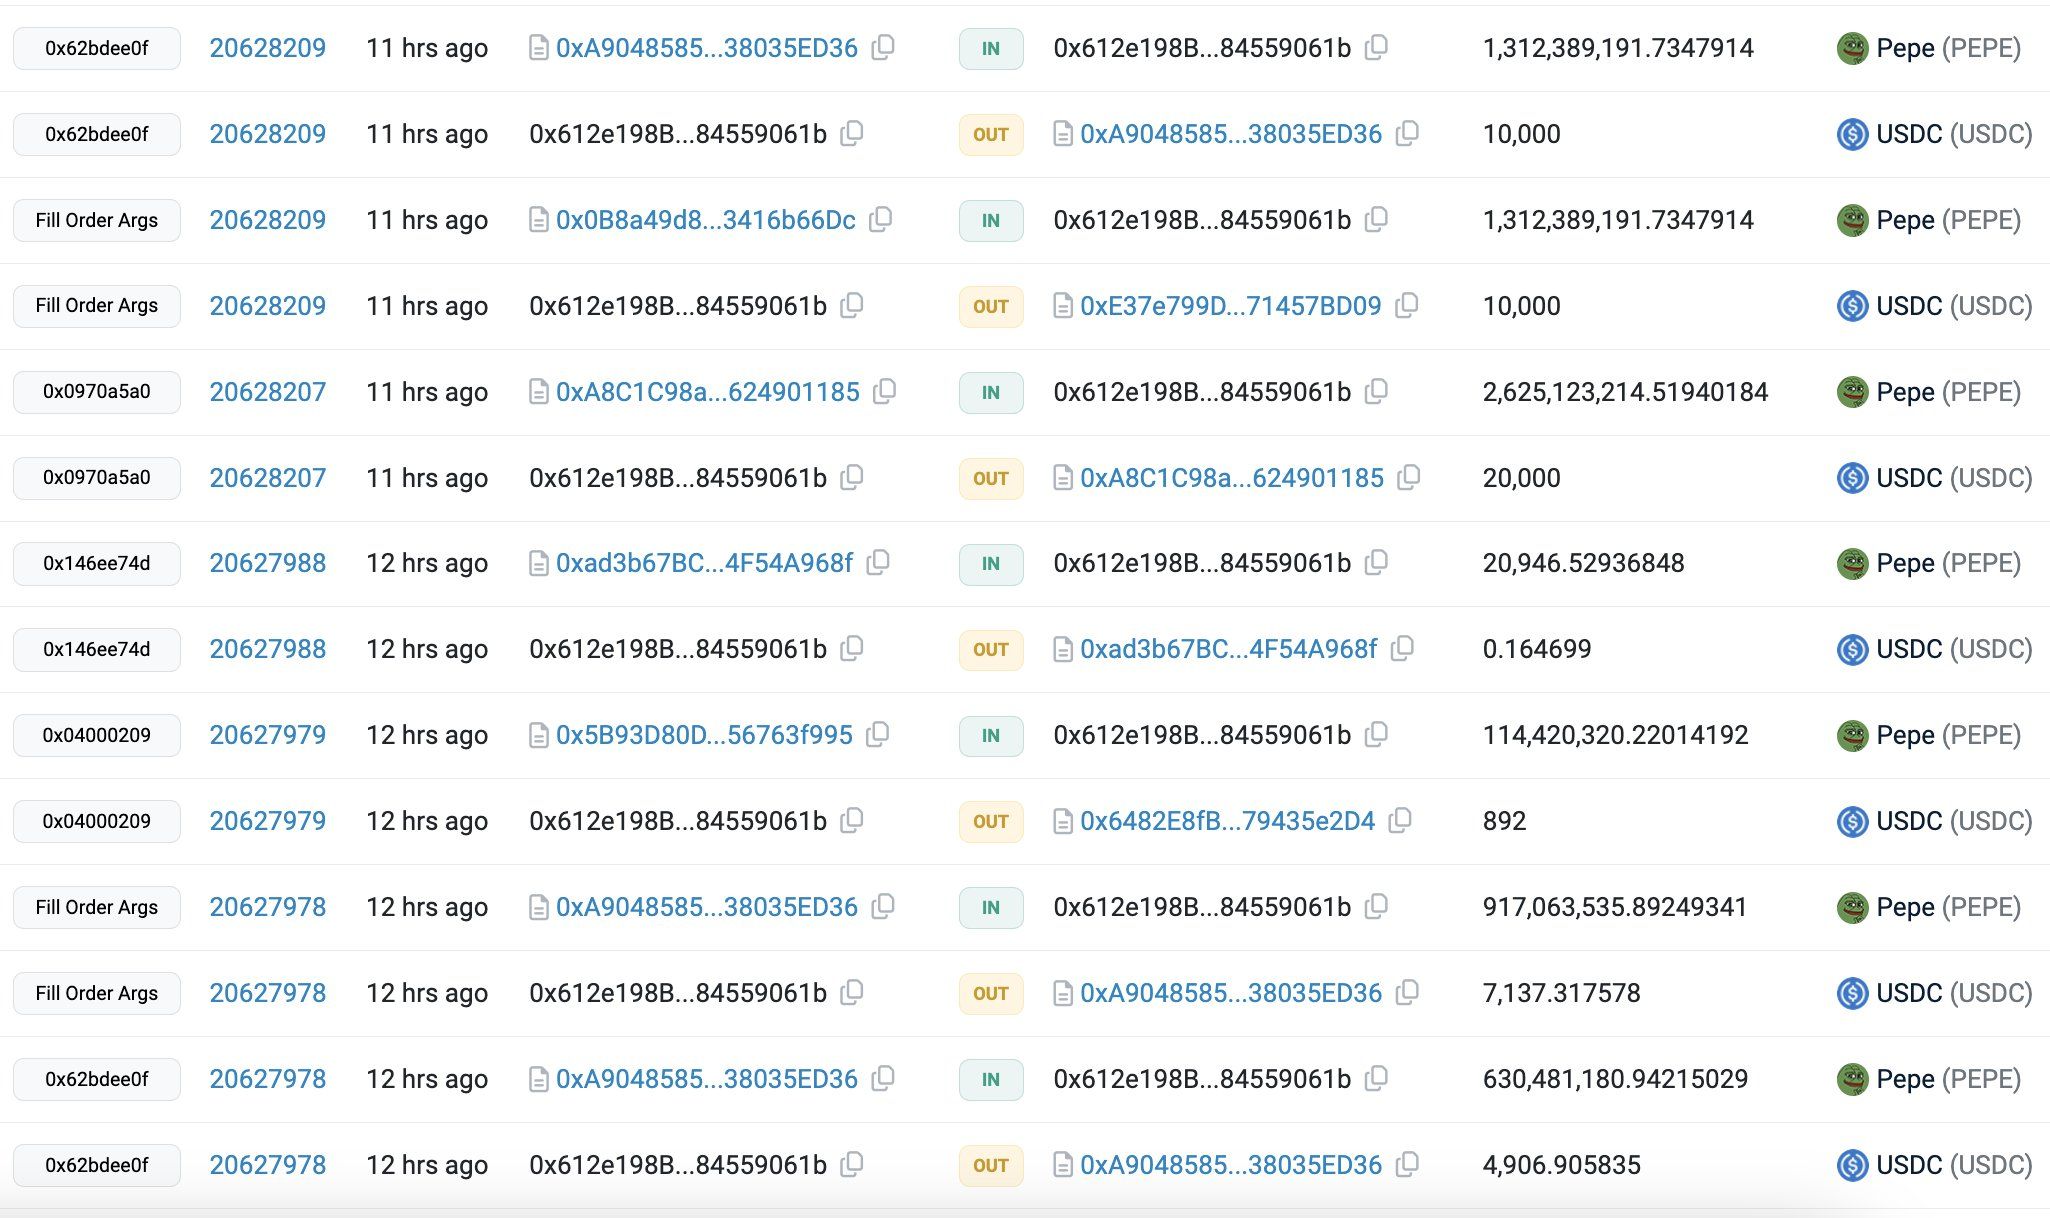
Earlier today, Etherscan data revealed that a market participant spent 1.34 million USDC to buy 173 billion PEPE tokens. Such large purchases often suggest a potential price increase may be on the horizon.
Historically, PEPE’s price tends to rise following large buys like this one. However, this isn’t the only major purchase the meme coin has seen in the past 24 hours.
According to Lookonchain, a wallet linked to the crypto asset investment management firm Ceffu bought 1.48 trillion PEPE tokens valued at $11.6 million. This brings the total accumulated tokens to nearly 2 trillion in just one day.
Read more: How To Buy PEPE and Everything You Need To Know
Furthermore, Pepe’s adjusted price Daily Active Addresses (DAA) metric appears to support the idea that a significant price increase could be approaching. The DAA measures how frequently users engage with a cryptocurrency.
An increase in DAA is generally seen as a bullish signal, indicating growing user participation, while a decrease suggests reduced engagement, which could be bearish. When analyzed alongside price movements, the DAA provides insights into whether it might be a good time to buy or sell.
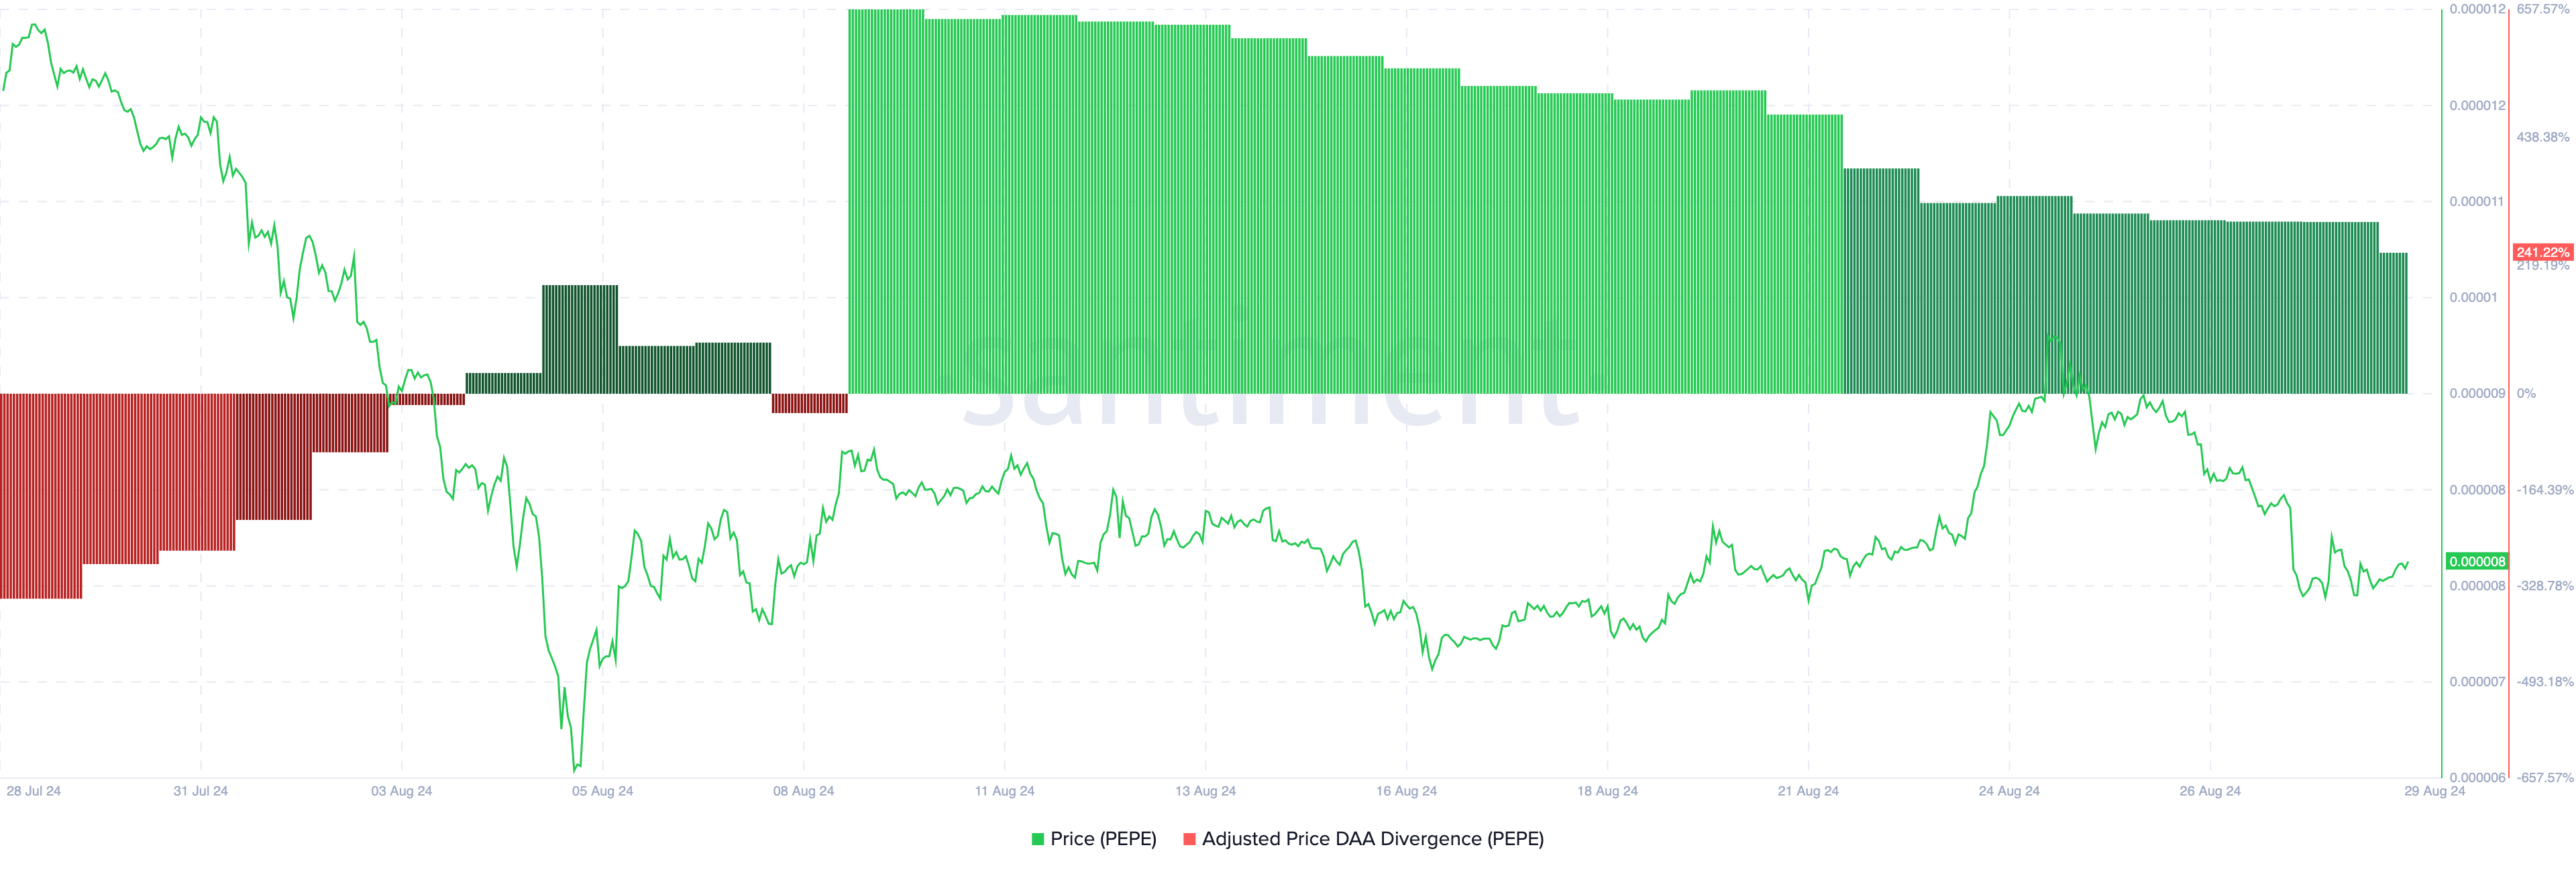
If the price of a cryptocurrency increases while user engagement falls, it typically signals that it might be time to sell. However, Pepe’s price has dropped by 32.94% over the last 30 days. The recent increase in its DAA suggests that the meme coin might have hit the bottom, and it is time to buy at discount prices.
PEPE Price Prediction: The Race Back to $0.000012 Begins
PEPE’s price currently stands at $0.0000078. However, according to the daily chart, the token could trade higher as a new month approaches. The image below shows the formation of a falling wedge.
The falling wedge is a bullish pattern that appears when a cryptocurrency’s price loses its hold on the uptrend. During the same period, buyers capitalize on the downtrend while the price begins to move up slowly.
To validate this prediction, PEPE bulls have to defend the support at $0.0000071. Besides that, there is an upper-level resistance at $0.0000095 that the meme coin must breach to continue increasing.
Read more: PEPE Price Prediction 2024/2025/2030
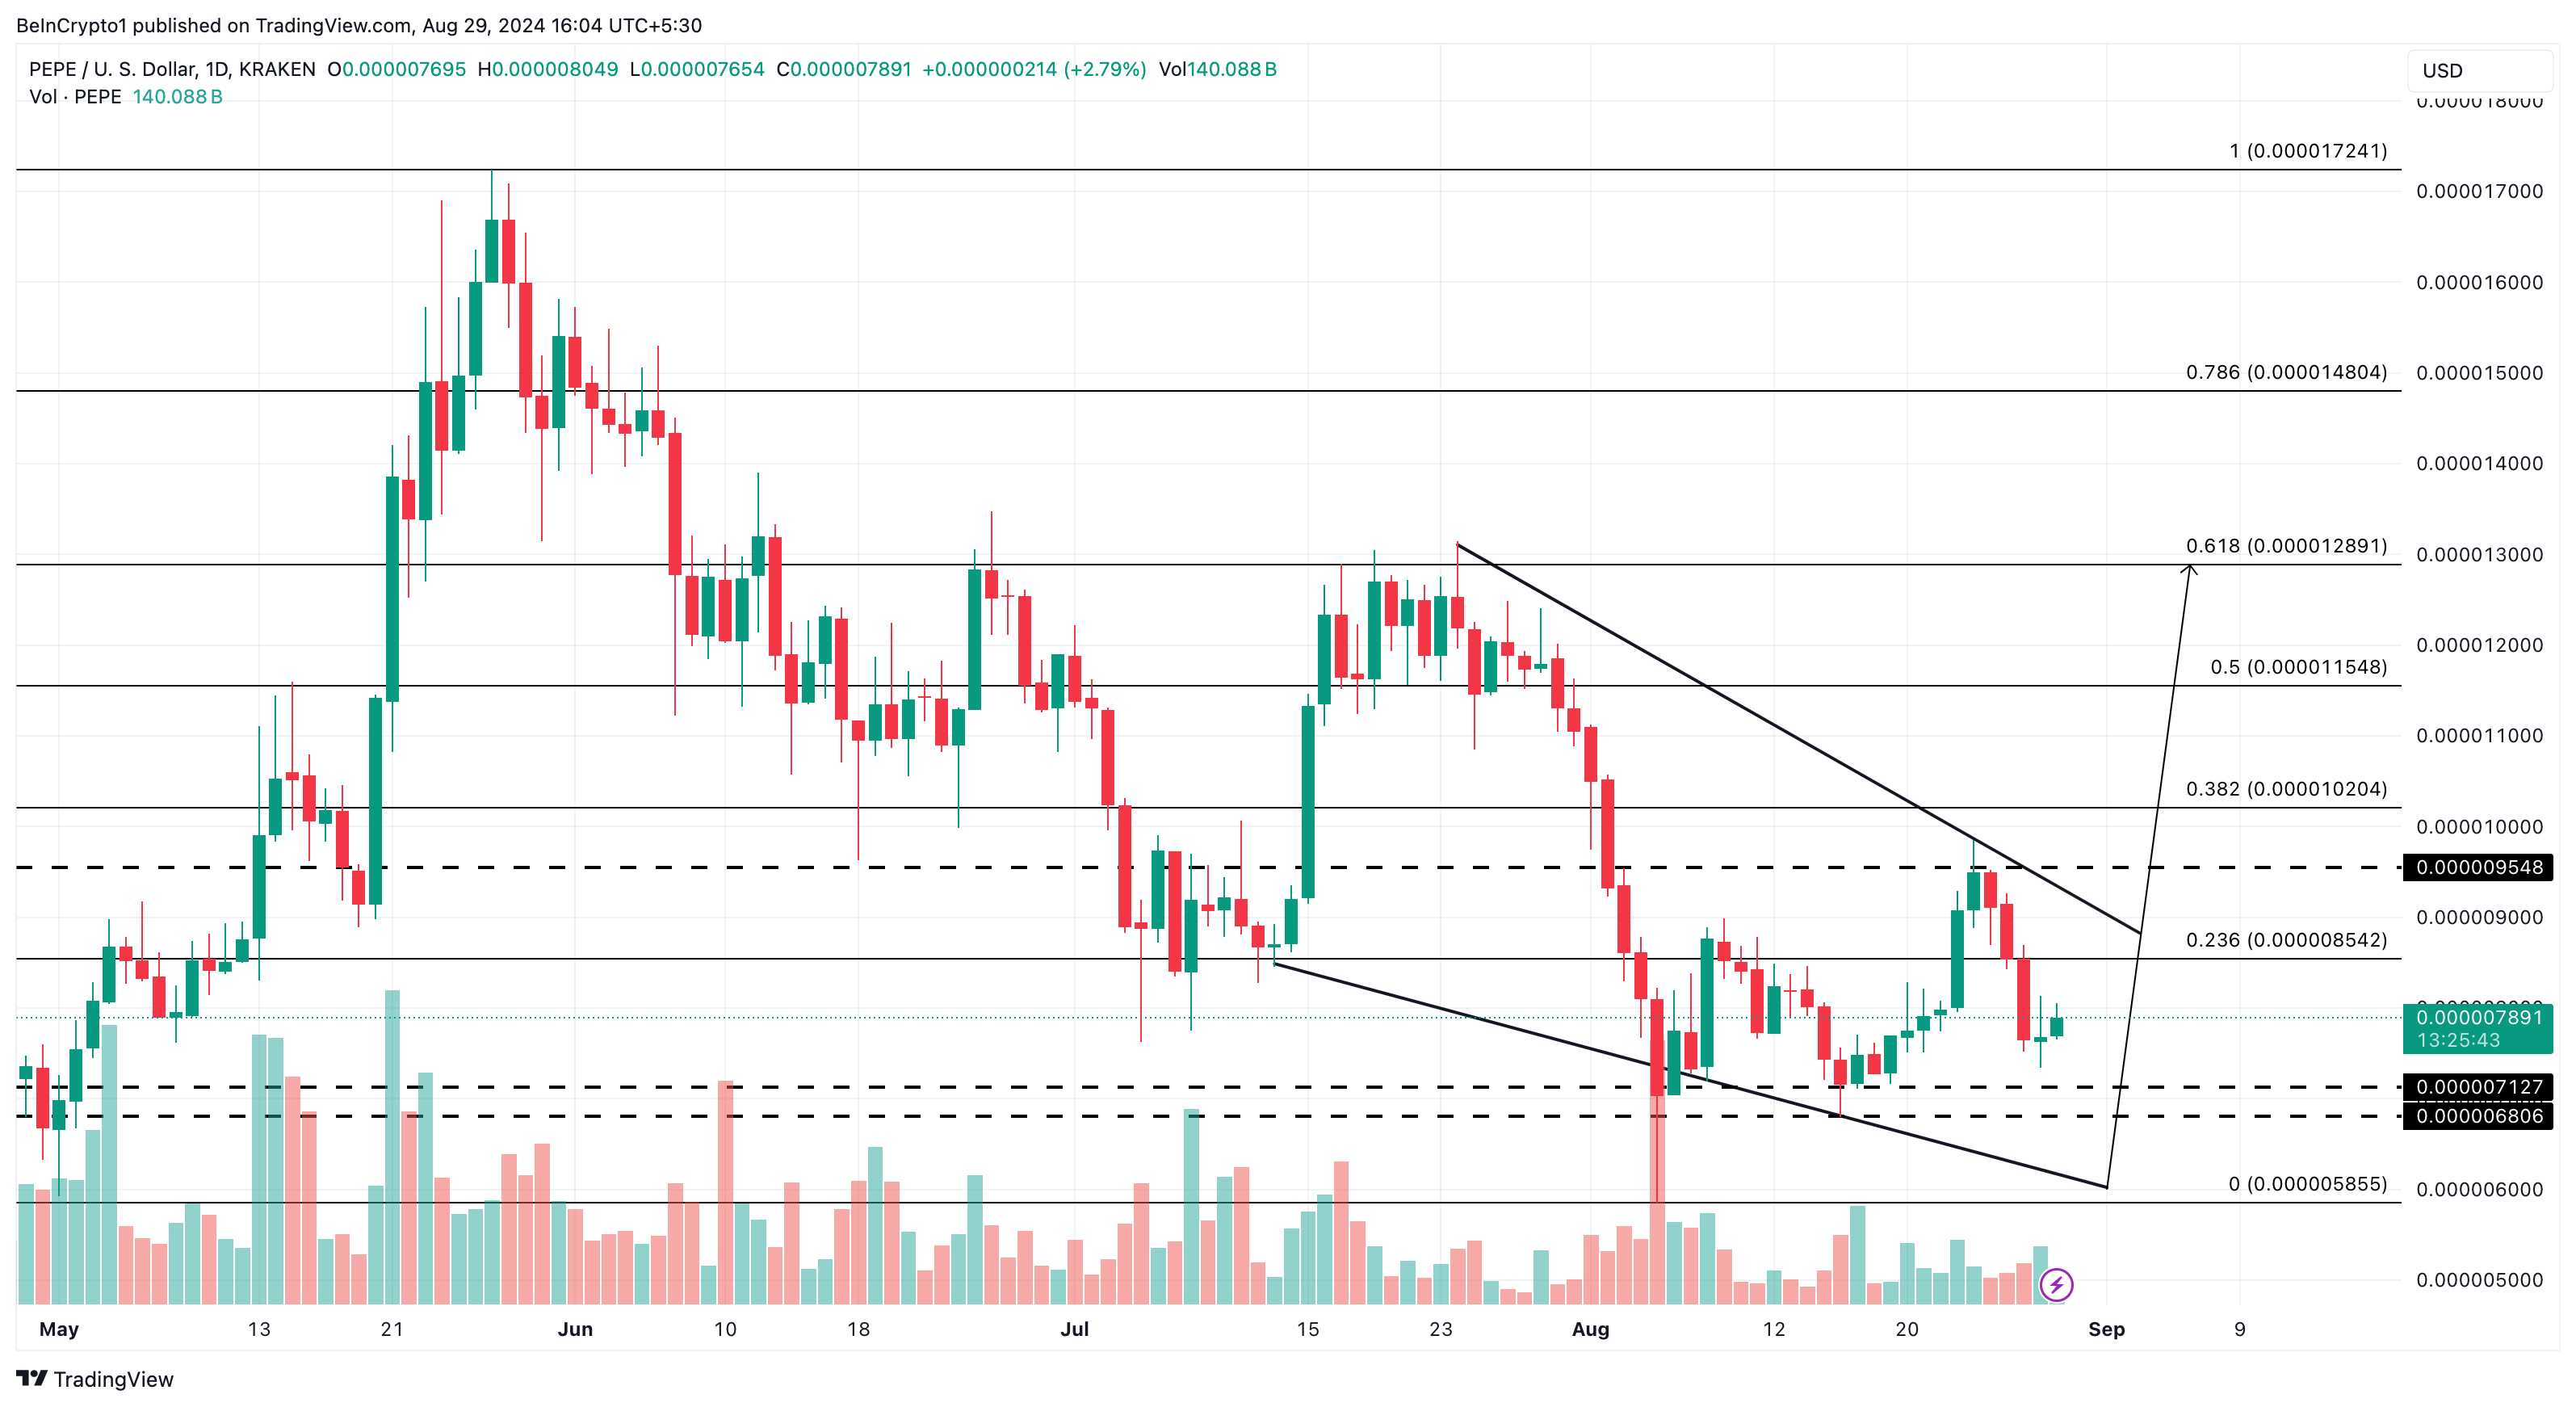
If successful, PEPE’s price could rally in an incredible way, potentially reaching $0.000012. However, the token’s inability to break above the resistance could invalidate this bull’s thesis. Should that happen, the meme coin might establish a new low of around $0.0000067.
Disclaimer
In line with the Trust Project guidelines, this price analysis article is for informational purposes only and should not be considered financial or investment advice. BeInCrypto is committed to accurate, unbiased reporting, but market conditions are subject to change without notice. Always conduct your own research and consult with a professional before making any financial decisions. Please note that our Terms and Conditions, Privacy Policy, and Disclaimers have been updated.


The highly anticipated Pectra upgrade will launch on the Ethereum (ETH) mainnet on May 7, 2025, after overcoming a series of technical challenges and delays in the testnet phase.
Ethereum developers announced the date during the All Core Developers Consensus (ACDC) meeting on April 3, 2025.
Pectra Upgrade Countdown Begins
The upgrade was initially slated for a tentative mainnet launch on April 30. However, Ethereum developers have postponed the launch by one week.
“We’ll go ahead and lock in May 7 for Pectra on mainnet,” Ethereum Foundation researcher Alex Stokes said.
In preparation for this, Stokes confirmed that client releases will be made available by April 21, ensuring that all users have the necessary updates and tools ahead of the mainnet launch. On April 23, a detailed blog post outlining the Pectra mainnet will be published.
The Pectra upgrade will introduce 11 Ethereum Improvement Proposals (EIPs) to enhance various aspects of the network. Notably, three EIPs are dedicated to improving the validator experience.
The first is EIP-7251. This will increase the staking limit for validators from 32 ETH to 2,048 ETH per validator. This change aims to enhance capital efficiency for large stakers and staking pools.
“This simplifies the staking experience, allowing users to manage multiple validators under one node instead of several,” an analyst remarked.
Moreover, EIP-7002 introduces execution-layer triggerable withdrawals, giving validators more control. Meanwhile, EIP-6110 reduces the deposit processing delay from about 9 hours to just 13 minutes.
The upgrade will also include EIP-7702, a major step toward account abstraction. It allows Externally Owned Accounts (EOAs) to gain smart contract functionality while maintaining simplicity. This enables features like transaction batching, gas sponsorship (where third parties pay fees), passkey-based authentication, spending controls, and asset recovery mechanisms.
Finally, the upgrade increases blob capacity through EIP-7691. In addition, EIP-7623 helps manage the increased bandwidth requirements. These updates aim to make Ethereum more scalable, efficient, and user-friendly.
It is worth noting that the road to the mainnet launch has not been without hurdles. Two previous tests on the Holesky and Sepolia test networks failed to finalize properly. However, Pectra achieved full finalization on the Hoodi testnet on March 26, marking a significant milestone toward the successful deployment of the upgrade.
Despite the technical progress, ETH continues to face market challenges.

Data from BeInCrypto shows that ETH dropped 4.8% over the past week, with weekly losses extending to 17.1%. At the time of writing, the altcoin was trading at $1,822, reflecting a small daily gain of 0.8%.
Disclaimer
In adherence to the Trust Project guidelines, BeInCrypto is committed to unbiased, transparent reporting. This news article aims to provide accurate, timely information. However, readers are advised to verify facts independently and consult with a professional before making any decisions based on this content. Please note that our Terms and Conditions, Privacy Policy, and Disclaimers have been updated.

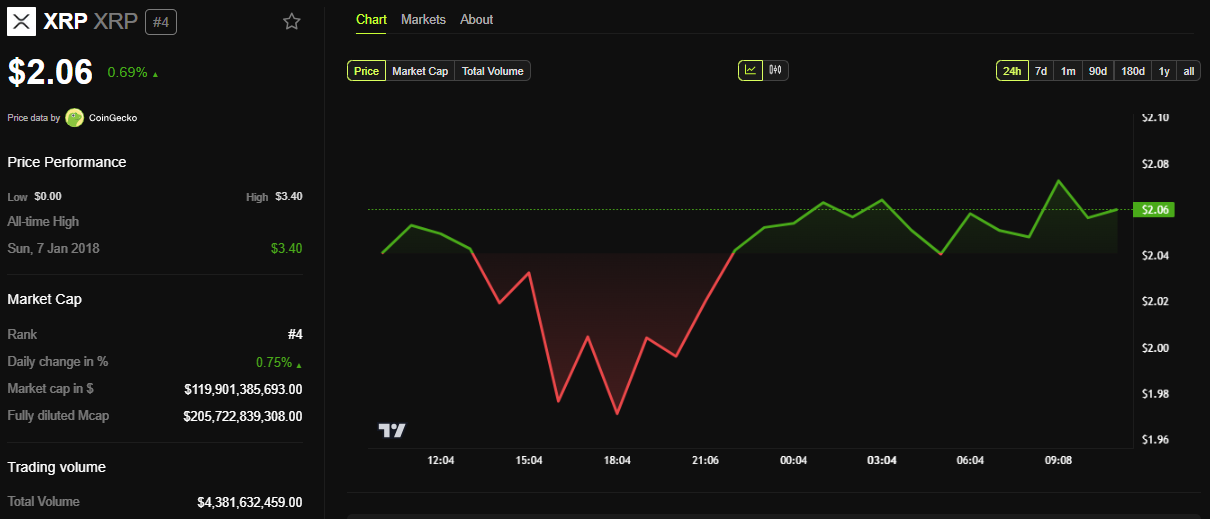
Coinbase filed with the US Commodity Futures Trading Commission (CFTC) to launch futures contracts for Ripple’s XRP token.
The move comes after a positive development for the crypto derivatives market in the US, reflecting shifting regulatory ties in the country.
Coinbase Files for XRP Futures Trading With CFTC
Coinbase Derivatives has submitted a filing to self-certify XRP futures. It will provide a regulated, capital-efficient means for market participants to gain exposure to XRP. The new contract could go live as soon as April 21.
“We’re excited to announce that Coinbase Derivatives has filed with the CFTC to self-certify XRP futures – bringing a regulated, capital-efficient way to gain exposure to one of the most liquid digital assets. We anticipate the contract going live on April 21, 2025,” read the announcement.
Meanwhile, the official filing indicates that the XRP futures contract will be a monthly cash-settled and margined contract trading under the symbol XRL.
Each contract represents 10,000 XRP and will be settled in US dollars. Trading will be available for the current month and two subsequent months. As a protective measure, trading will be temporarily halted if the spot XRP price moves more than 10% within an hour.
The Coinbase Exchange also confirmed that it has engaged with Futures Commission Merchants (FCMs) and other market participants. Both references reportedly expressed support for the launch.
However, Coinbase is not the first US-based exchange to introduce regulated XRP futures. In March, Chicago-based Bitnomial launched what it advertised as the country’s first CFTC-regulated XRP futures contract.
For Coinbase, however, the boldness comes after the CFTC eased key regulatory hurdles for crypto derivatives trading. As BeInCrypto reported, this signaled a more accommodating stance towards the sector.
“Pursuant to Commodity Futures Trading Commission (“CFTC” or “Commission”) Regulation 40.2(a), Coinbase Derivatives, LLC (the “Exchange” or “COIN”) hereby submits for self-certification its initial listing of the XRP Futures contract to be offered for trading on the Exchange…,” an excerpt in the filing indicated.
This suggests that the commodities regulator’s shift, revoking previous crypto-related guidelines, may boost institutional confidence. For XRP, this development bolsters confidence in the asset’s previously contentious status following Ripple’s recent regulatory breakthrough.
“Coinbase Derivatives’ filing with the CFTC to self-certify XRP futures aims to legitimize XRP trading by offering a regulated, capital-efficient product for investors,” one user remarked.
The futures contract might also help the odds of XRP ETF approval. Recently, the SEC delayed several applications to create one, and its status is in limbo.
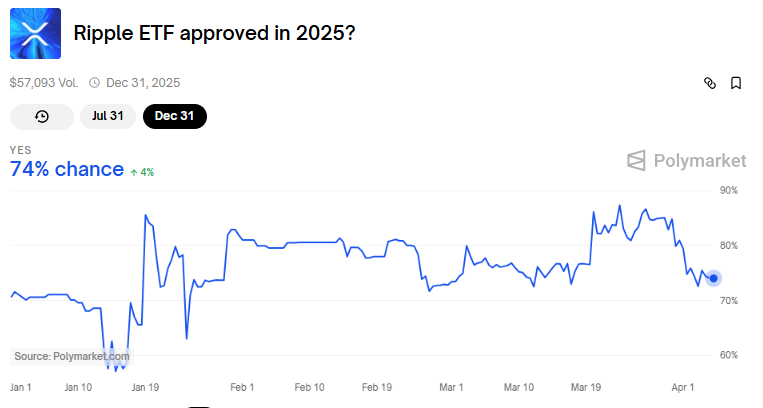
Data on Polymarket shows bettors see a 74% chance for XRP ETF approval in 2025 and a more modest 34% by July 31.
Regulatory and Legal Developments Favor Coinbase
Elsewhere, the timing of this filing aligns with recent favorable regulatory developments for Coinbase. Reports suggest Illinois intends to drop its lawsuit against the exchange over its staking services.
Up to 10 states filed a lawsuit against Coinbase in June 2023 alleging that its staking program constituted unregistered securities offerings.
This recent development makes Illinois the fourth state to withdraw legal action against Coinbase. Vermont, South Carolina, and Kentucky also dismissed their cases on March 13, 27, and 31, respectively.
However, the cases remain active in Alabama, California, Maryland, New Jersey, Washington and Wisconsin.
These legal retreats coincide with the US SEC’s (Securities and Exchange Commission) February decision to abandon its federal lawsuit against Coinbase. BeInCrypto reported that this development marked a broader shift in the regulatory approach under the current administration.
“Regulators are losing steam, and Coinbase is stacking quiet courtroom wins. Staking’s future in the US might just be back on track,” a user commented.
Illinois’ decision to drop its lawsuit comes as the state advances a Bitcoin strategic reserve bill. Specifically, Illinois State Representative John M. Cabello introduced House Bill 1844 (HB1844), highlighting Bitcoin’s potential as a decentralized, finite digital asset.
“A strategic bitcoin reserve aligns with Illinois’ commitment to fostering innovation in digital assets and providing Illinoisans with enhanced financial security,” the bill read.
Disclaimer
In adherence to the Trust Project guidelines, BeInCrypto is committed to unbiased, transparent reporting. This news article aims to provide accurate, timely information. However, readers are advised to verify facts independently and consult with a professional before making any decisions based on this content. Please note that our Terms and Conditions, Privacy Policy, and Disclaimers have been updated.
Dogecoin started a fresh decline from the $0.180 zone against the US Dollar. DOGE is consolidating and might struggle to recover above $0.1680.
- DOGE price started a fresh decline below the $0.1750 and $0.170 levels.
- The price is trading below the $0.1680 level and the 100-hourly simple moving average.
- There was a break below a key bullish trend line forming with support at $0.170 on the hourly chart of the DOGE/USD pair (data source from Kraken).
- The price could extend losses if it breaks the $0.1550 support zone.
Dogecoin Price Dips Again
Dogecoin price started a fresh decline after it failed to clear $0.180, like Bitcoin and Ethereum. DOGE dipped below the $0.1750 and $0.1720 support levels.
There was a break below a key bullish trend line forming with support at $0.170 on the hourly chart of the DOGE/USD pair. The bears were able to push the price below the $0.1620 support level. It even traded close to the $0.1550 support.
A low was formed at $0.1555 and the price is now consolidating losses. There was a minor move above the 23.6% Fib retracement level of the downward move from the $0.180 swing high to the $0.1555 low.
Dogecoin price is now trading below the $0.170 level and the 100-hourly simple moving average. Immediate resistance on the upside is near the $0.1650 level. The first major resistance for the bulls could be near the $0.1680 level. It is near the 50% Fib retracement level of the downward move from the $0.180 swing high to the $0.1555 low.

The next major resistance is near the $0.1740 level. A close above the $0.1740 resistance might send the price toward the $0.180 resistance. Any more gains might send the price toward the $0.1880 level. The next major stop for the bulls might be $0.1950.
Another Decline In DOGE?
If DOGE’s price fails to climb above the $0.170 level, it could start another decline. Initial support on the downside is near the $0.160 level. The next major support is near the $0.1550 level.
The main support sits at $0.150. If there is a downside break below the $0.150 support, the price could decline further. In the stated case, the price might decline toward the $0.1320 level or even $0.120 in the near term.
Technical Indicators
Hourly MACD – The MACD for DOGE/USD is now losing momentum in the bearish zone.
Hourly RSI (Relative Strength Index) – The RSI for DOGE/USD is now above the 50 level.
Major Support Levels – $0.1600 and $0.1550.
Major Resistance Levels – $0.1680 and $0.1740.
Pi Coin Price Crashes 15%, Is Coinbase Listing Only Hope?

What to Expect on May 7

Japanese Company Unveils Plans To Buy Crypto

XRP Futures and Illinois Lawsuit Relief

Why Are Retail Investors Turning to XRP Over Bitcoin?

Dogecoin (DOGE) Bleeds Further—Fresh Weekly Lows Test Investor Patience

2.52 Million Altcoins Are Ruining Crypto’s Future

Animoca Brands Valuation Tanks 75% In Two Years, Here’s Why

Crypto exchange BingX hacked for $43 million

Are The Big Players Losing Interest?

Hong Kong’s Securities Association Tips Authorities On Crypto Self-Regulation

Coinbase cbBTC Set to go Live on Solana
2.52 Million Altcoins Are Ruining Crypto’s Future
Animoca Brands Valuation Tanks 75% In Two Years, Here’s Why
Crypto exchange BingX hacked for $43 million
Are The Big Players Losing Interest?
Hong Kong’s Securities Association Tips Authorities On Crypto Self-Regulation
Coinbase cbBTC Set to go Live on Solana
-

 Market20 hours ago
Bitcoin’s Future After Trump Tariffs
-

 Market24 hours ago
IP Token Price Surges, but Weak Demand Hints at Reversal
-

 Ethereum23 hours ago
Ethereum Trading In ‘No Man’s Land’, Breakout A ‘Matter Of Time’?
-

 Bitcoin23 hours ago
BlackRock Approved by FCA to Operate as UK Crypto Asset Firm
-

 Market23 hours ago
HBAR Foundation Eyes TikTok, Price Rally To $0.20 Possible
-
 Altcoin23 hours ago
John Squire Says XRP Could Spark A Wave of Early Retirements
-
 Market22 hours ago
10 Altcoins at Risk of Binance Delisting
-

 Market21 hours ago
EDGE Goes Live, RSR Added to Roadmap