
Market
Binance Coin (BNB) Traders Watch From the Sidelines

Binance Coin (BNB) has experienced a gradual decrease in market volatility over the past few days, as its price begins to consolidate within a defined range.
This consolidation is evident on the one-day chart, where BNB’s 20-day exponential moving average (EMA) and 50-day simple moving average (SMA) have started to flatten out, indicating a period of reduced price movement.
Binance Coin Is Not At Risk Of Price Swings
The 20-day EMA is a short-term moving average that quickly responds to price changes, representing the average closing price of an asset over the past 20 days. In contrast, the 50-day SMA is a longer-term moving average that reflects an asset’s average closing price over the last 50 days.
Since August 26, BNB’s 20-day EMA and 50-day SMA have both flattened. When an asset’s moving averages flatten, it signals market indecision, where neither buyers nor sellers have enough strength. This typically indicates that the market is trending sideways.
This period is characterized by a low likelihood of significant price swings, as confirmed by BNB’s volatility indicators. For instance, the coin’s Average True Range (ATR), which measures the degree of an asset’s price volatility, has been trending downward over the past few days. As of the latest data, BNB’s ATR stands at 24.6.
Read More: How To Trade Crypto on Binance Futures: Everything You Need To Know
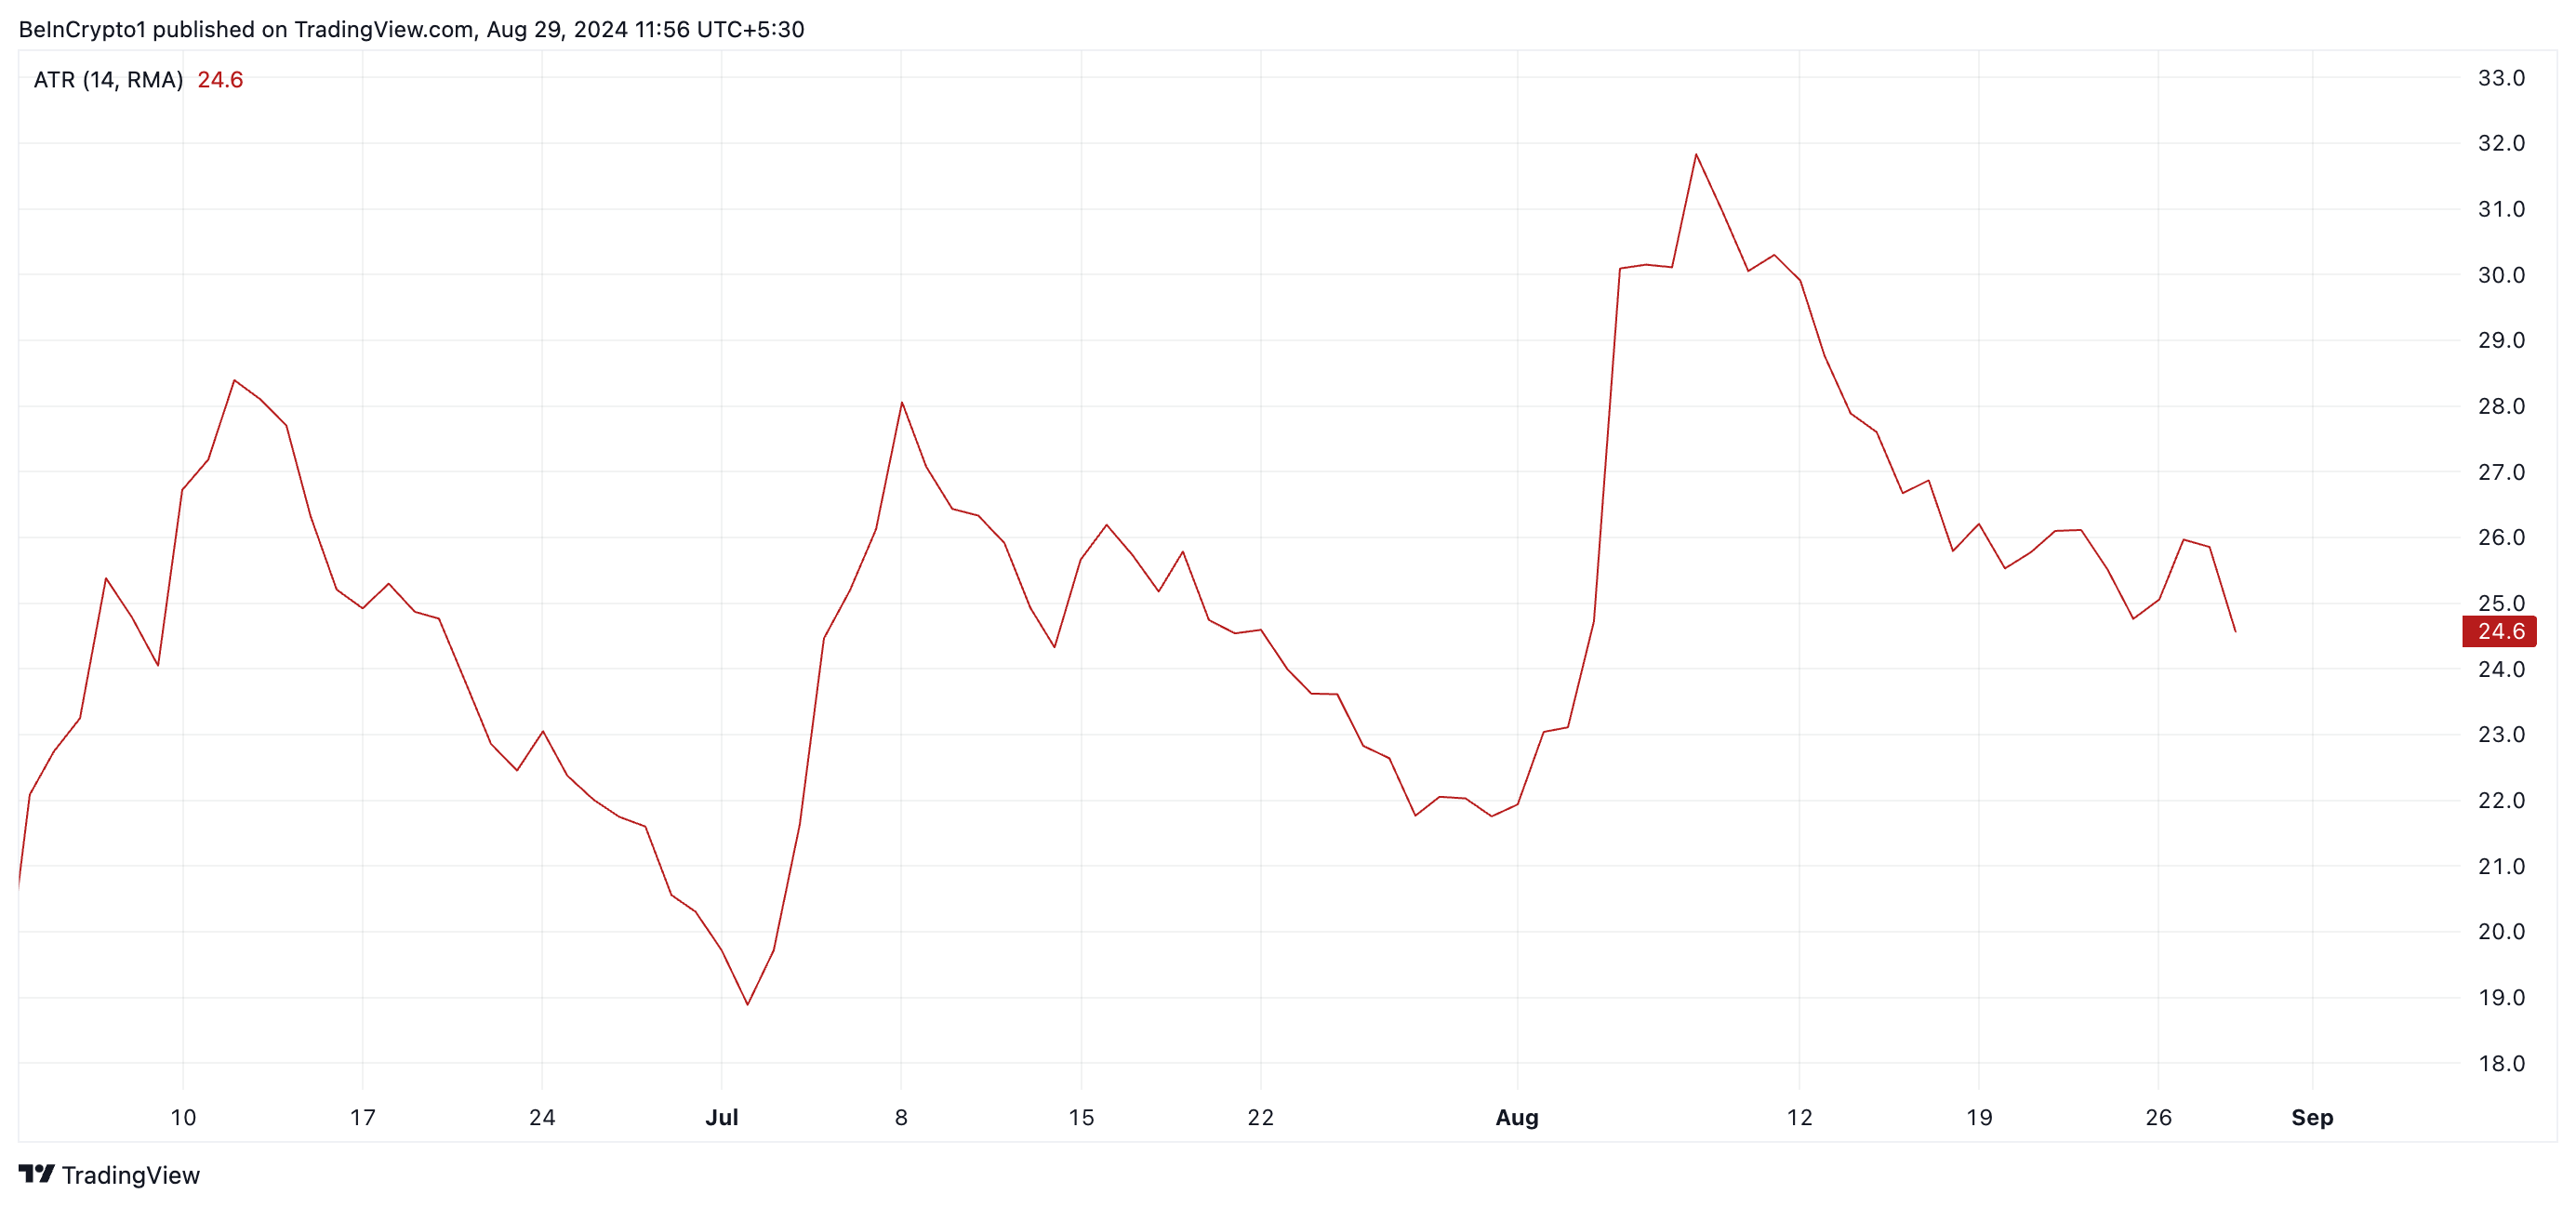
A declining ATR suggests that an asset’s price is experiencing less fluctuation, indicating that the market is entering a consolidation phase where prices tend to move within a narrower range.
Additionally, BNB’s downward-trending Bollinger Bandwidth supports this view. This indicator helps traders assess market volatility and identify potential breakout opportunities. As of the latest data, the Bollinger Bandwidth for BNB stands at 18.48.
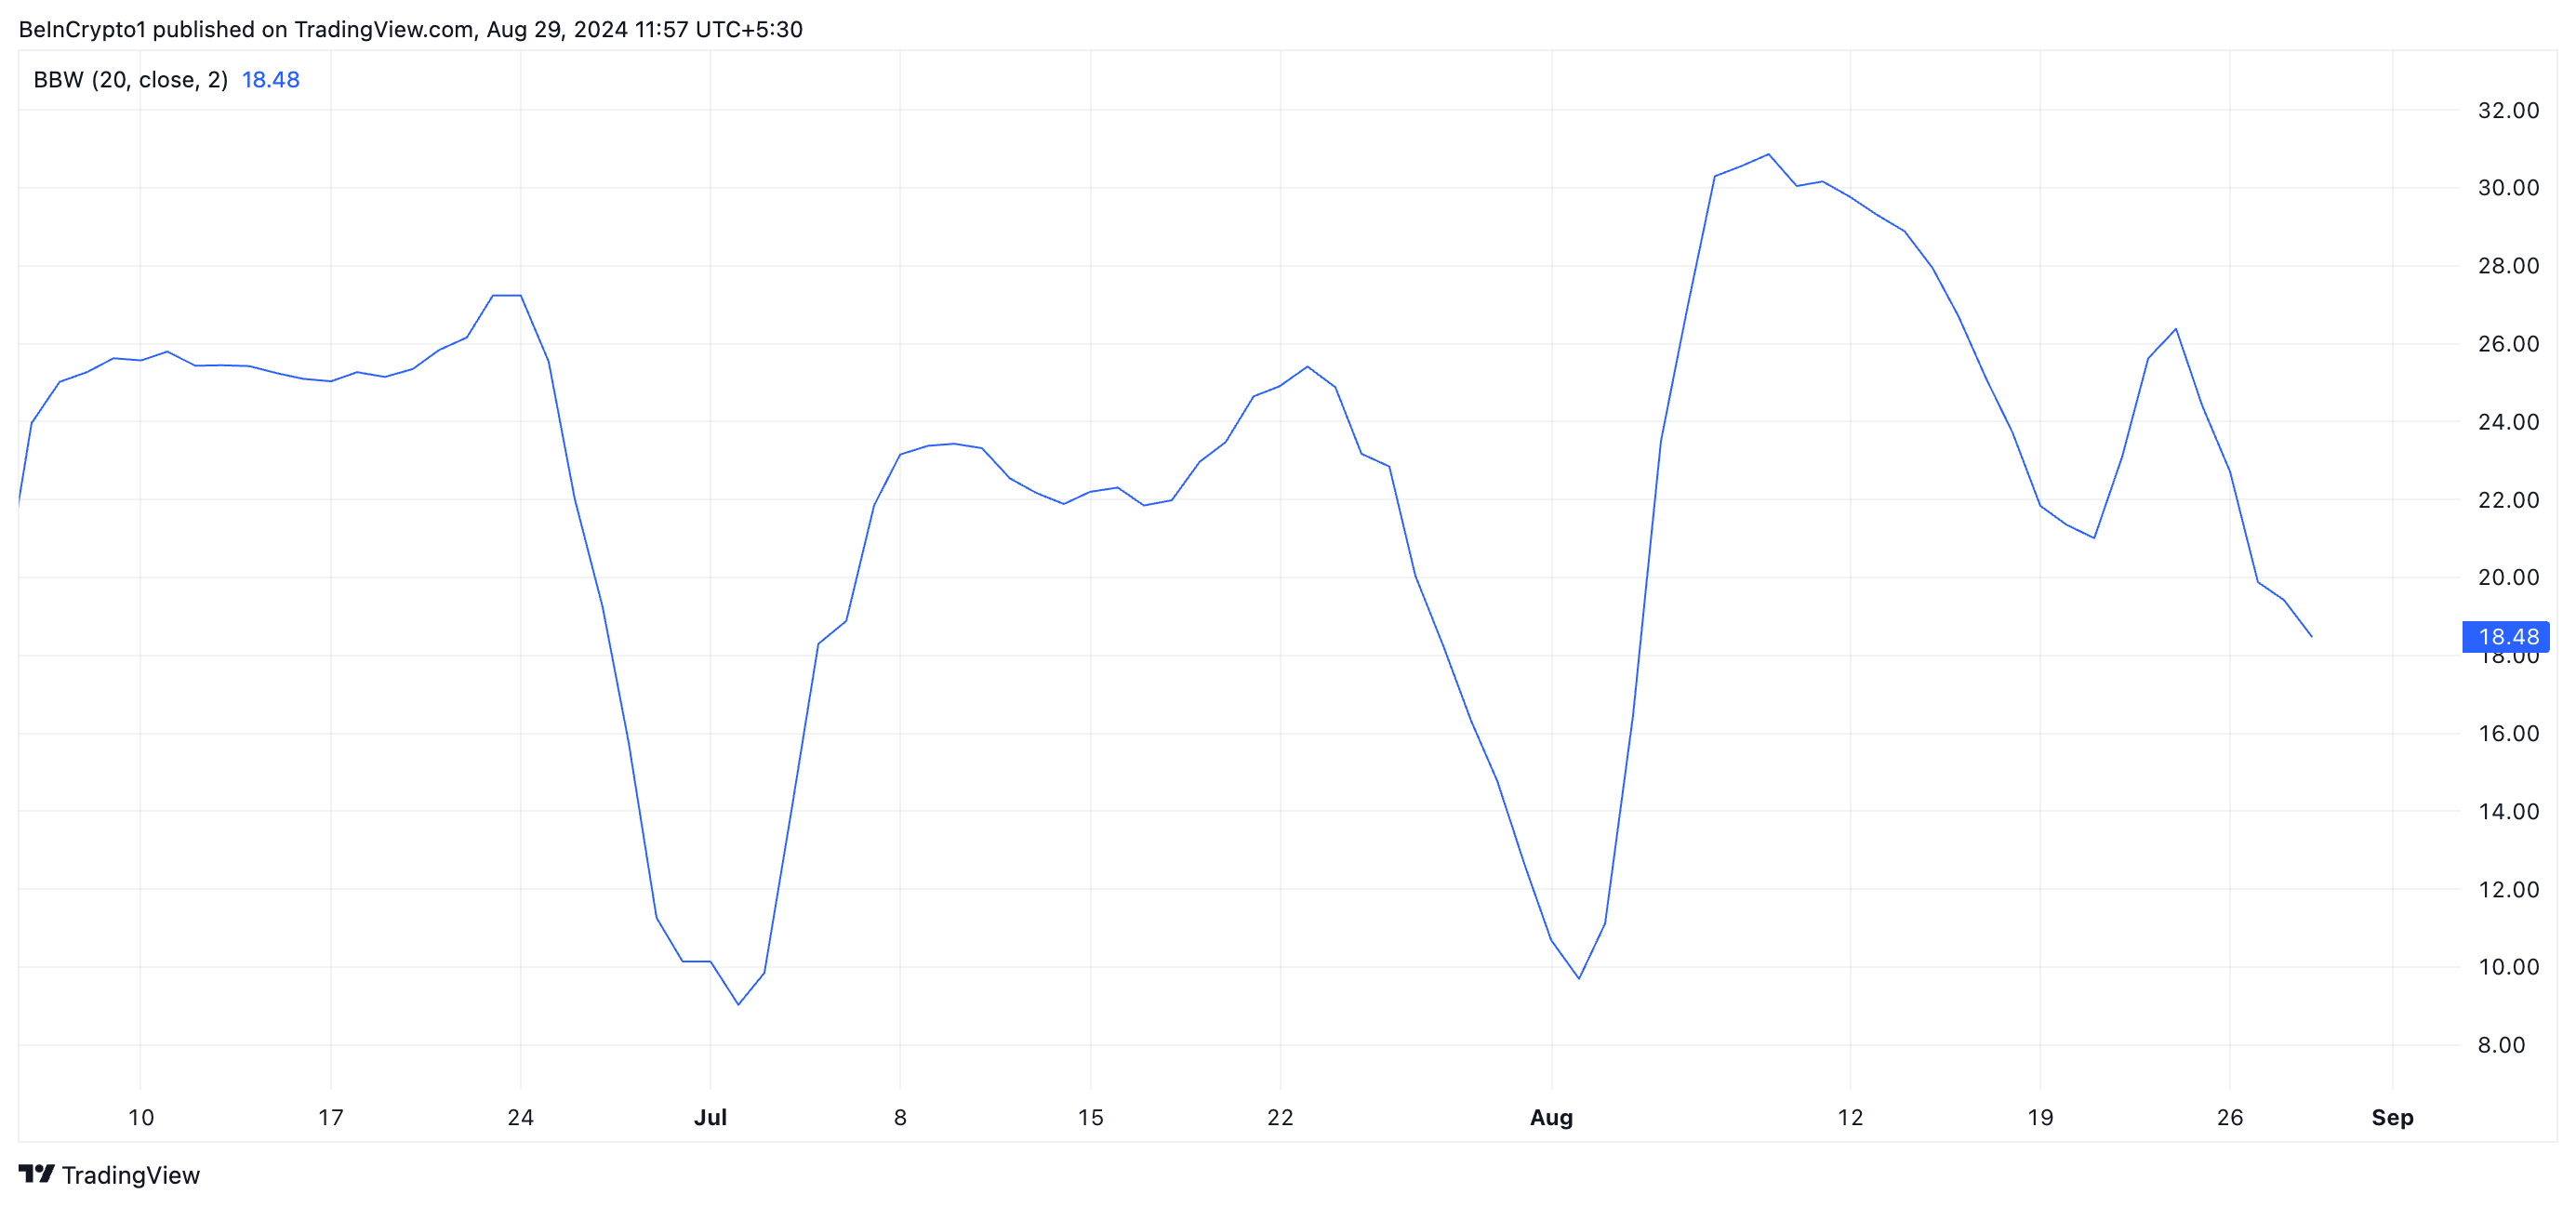
A declining bandwidth such as this indicates that BNB’s Bollinger bands are far apart, confirming low market volatility.
BNB Price Prediction: Bulls and Bears Face Off in Battle
When an asset trades sideways, it indicates a balance between buying and selling pressures, which keeps the price from moving strongly in either direction.
If BNB experiences a bullish resurgence and demand for the altcoin increases, it could break out of its narrow range and start an uptrend. If this scenario unfolds, BNB’s price may climb to $560.90, which is above its 20-day EMA and 50-day SMA.
Read more: Binance Coin (BNB) Price Prediction 2024/2025/2030
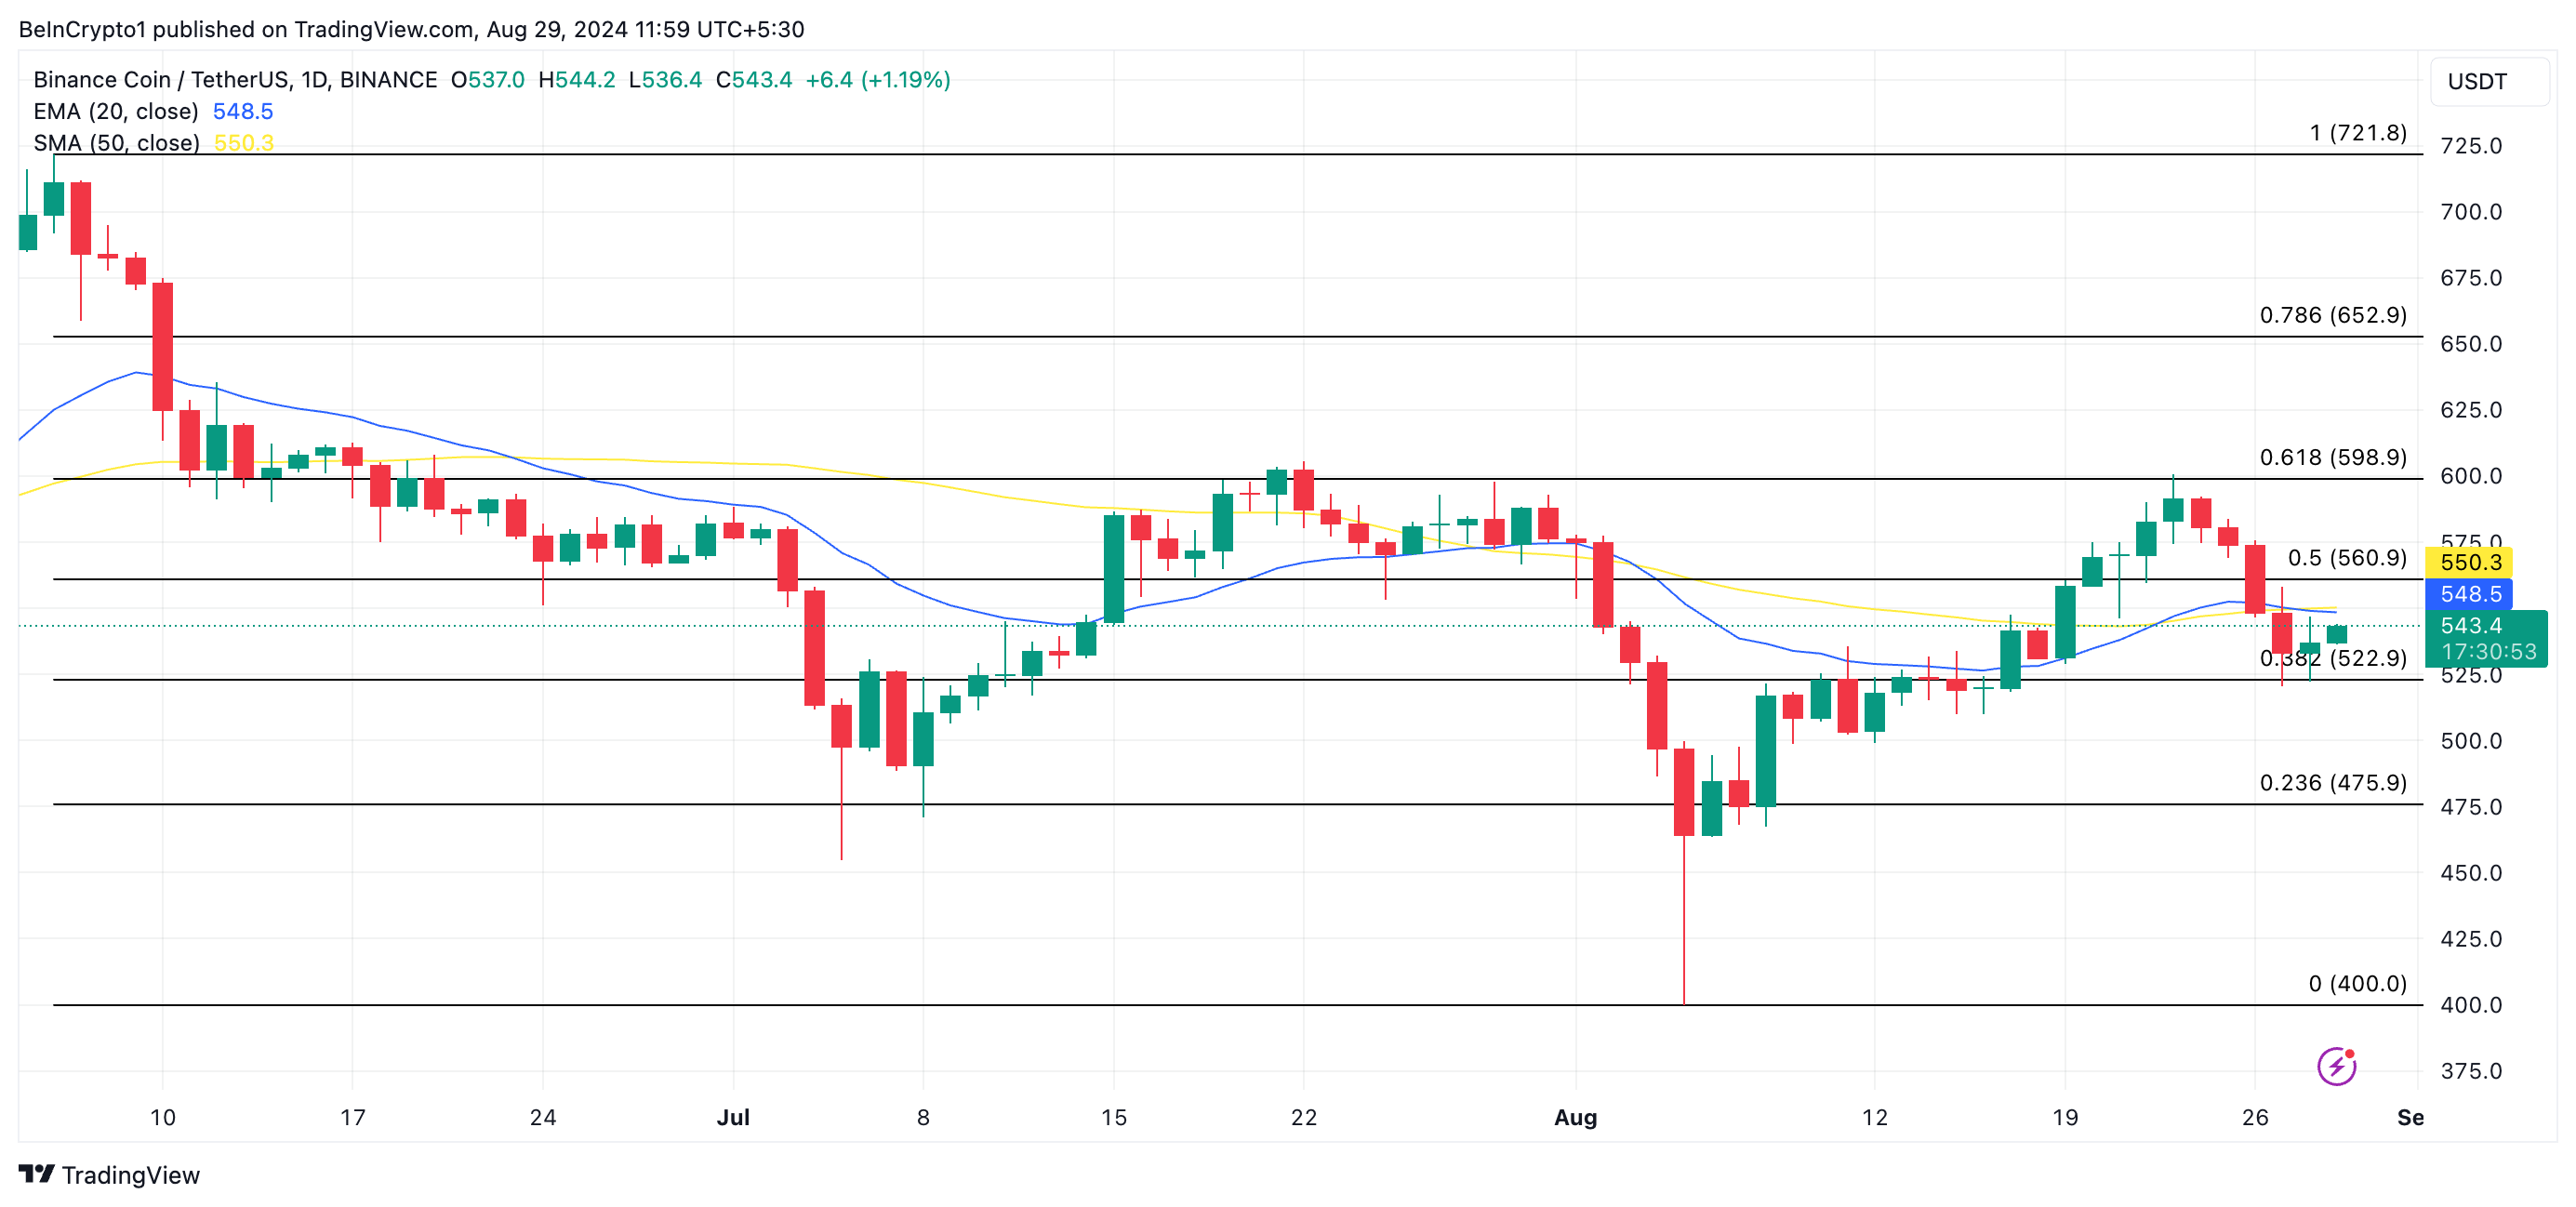
However, if the bearish sentiment against BNB intensifies and selling pressure increases, the price could drop to $522.90.
Disclaimer
In line with the Trust Project guidelines, this price analysis article is for informational purposes only and should not be considered financial or investment advice. BeInCrypto is committed to accurate, unbiased reporting, but market conditions are subject to change without notice. Always conduct your own research and consult with a professional before making any financial decisions. Please note that our Terms and Conditions, Privacy Policy, and Disclaimers have been updated.


Ethereum price started a fresh upward move above the $2,420 resistance. ETH traded close to $2,500 and is now consolidating gains.
- Ethereum started another increase from the $2,320 resistance.
- The price is trading above $2,400 and the 100-hourly Simple Moving Average.
- There is a connecting bullish trend line forming with support at $2,385 on the hourly chart of ETH/USD (data feed via Kraken).
- The pair must clear the $2,480 resistance to continue higher in the near term.
Ethereum Price Surges Over 8%
Ethereum price remained well-supported and extended its increase, beating Bitcoin. ETH was able to clear the $2,350 and $2,420 resistance levels.
There was a sharp move, and the price gained nearly 10%. It traded close to the $2,500 resistance zone. A high was formed at $2,493 and the price is now consolidating gains. There was a minor decline below the $2,460 level. The price tested the 23.6% Fib retracement level of the upward move from the $2,277 swing low to the $2,493 high.
Ethereum price is now trading above $2,440 and the 100-hourly Simple Moving Average. There is also a connecting bullish trend line forming with support at $2,385 on the hourly chart of ETH/USD. The trend line is close to the 50% Fib retracement level of the upward move from the $2,277 swing low to the $2,493 high.
On the upside, the price seems to be facing hurdles near the $2,480 level. The first major resistance is near the $2,500 level. The next key resistance is near $2,550.

An upside break above the $2,550 resistance might call for more gains. In the stated case, Ether could rise toward the $2,650 resistance zone in the near term. The next hurdle sits near the $2,750 level or $2,800.
Are Dips Limited In ETH?
If Ethereum fails to clear the $2,480 resistance, it could start a downside correction. Initial support on the downside is near $2,440. The first major support sits near the $2,385 zone and the trend line zone.
A clear move below the $2,385 support might push the price toward $2,320. Any more losses might send the price toward the $2,250 support level in the near term. The next key support sits at $2,200.
Technical Indicators
Hourly MACD – The MACD for ETH/USD is losing momentum in the bullish zone.
Hourly RSI – The RSI for ETH/USD is now above the 50 zone.
Major Support Level – $2,385
Major Resistance Level – $2,500


The crypto exchange BingX reportedly lost over $26 million in various digital assets early Thursday morning. This incident adds to a troubling week for crypto platforms as multiple hacks continue to expose vulnerabilities within the sector.
PeckShield, a blockchain security company, initially detected suspicious transactions at approximately 00:37 UTC. Initial reports suggested an outflow of around $13.6 million.
BingX Has Paused Withdrawals
Following this, several crypto security platforms conducted a more thorough examination and confirmed that BingX had been compromised. On-chain analysis firm Lookonchain detailed the stolen assets, which included over 360 different altcoins. The stolen funds were swiftly transferred to the wallet address ‘0xF7e8’ before being exchanged primarily for Ethereum (ETH) and BNB.
Read more: Crypto Project Security: A Guide to Early Threat Detection
The detailed breakdown of the stolen assets includes:
- 4.44 million USDT ($4.44 million),
- 1 million WUSD ($1 million),
- 608,660 USDC ($608,660),
- 9.38 BTCB ($590,000),
- along with numerous other tokens making up the substantial remainder.
In response to the breach, BingX’s Chief Product Officer, Vivien Lin, confirmed the hack and announced the suspension of all withdrawals to mitigate further risks.
“Our technical team detected abnormal network access, suspecting a hacker attack on BingX’s hot wallet. We immediately started our emergency plan, including the urgent transfer of assets and withdraw suspension. There has been minor asset loss, but the amount is small and still being calculated,” Lin wrote on X (Twitter).
Despite the significant amount lost, Lin assured users that BingX would cover the full amount of the stolen assets with its own capital reserves. Furthermore, she committed that BingX will resume withdrawals within 24 hours. This swift response aims to restore trust and stabilize operations after the incident.
Moreover, this week’s hack at BingX is part of a larger trend of increased attacks on crypto platforms. Just earlier this week, DeltaPrime, a decentralized finance (DeFi) protocol on the Arbitrum chain, reported a loss of $5.9 million due to suspicious transactions.
Additionally, last week, the Indonesian exchange Indodax also faced a severe security breach, resulting in a loss of over $20 million. In each instance, the intrusions were identified by blockchain security firms after funds had been illicitly transferred and converted across multiple networks.
Read more: A Guide to the Best AI Security Solutions in 2024
These recurring incidents have spurred calls for enhanced security measures across the cryptocurrency industry. Consequently, experts stress the importance of exchanges and protocols implementing strong security frameworks to protect against the sophisticated tactics employed by hackers today.
Disclaimer
In adherence to the Trust Project guidelines, BeInCrypto is committed to unbiased, transparent reporting. This news article aims to provide accurate, timely information. However, readers are advised to verify facts independently and consult with a professional before making any decisions based on this content. Please note that our Terms and Conditions, Privacy Policy, and Disclaimers have been updated.

Bitcoin price gained pace above the $61,500 resistance. BTC even cleared the $63,300 level and is now consolidating gains above $62,500.
- Bitcoin is gaining pace above the $62,200 resistance zone.
- The price is trading above $62,500 and the 100 hourly Simple moving average.
- There is a major bullish trend line forming with support at $61,500 on the hourly chart of the BTC/USD pair (data feed from Kraken).
- The pair could extend gains if it stays above the $61,500 support zone.
Bitcoin Price Extend Gains Above $63,000
Bitcoin price extended its increase above the $60,500 level. BTC was able to clear the $61,200 and $61,500 resistance levels to move into a positive zone.
The bulls pumped the price above $62,500 and $63,000 levels. A high was formed at $63,840 and the price is now consolidating gains. There was a move below the $63,500 level. The price dipped and tested the 23.6% Fib retracement level of the upward move from the $59,165 swing low to the $63,840 high.
Bitcoin is now trading above $62,500 and the 100 hourly Simple moving average. There is also a major bullish trend line forming with support at $61,500 on the hourly chart of the BTC/USD pair.

On the upside, the price could face resistance near the $63,500 level. The first key resistance is near the $63,800 level. A clear move above the $68,400 resistance might send the price higher. The next key resistance could be $64,500. A close above the $64,500 resistance might spark more upsides. In the stated case, the price could rise and test the $65,000 resistance.
Are Dips Limited In BTC?
If Bitcoin fails to rise above the $63,500 resistance zone, it could start a downside correction. Immediate support on the downside is near the $62,700 level.
The first major support is $61,500 and the trend line. The next support is now near the $61,000 zone or the 61.8% Fib retracement level of the upward move from the $59,165 swing low to the $63,840 high. Any more losses might send the price toward the $60,500 support in the near term.
Technical indicators:
Hourly MACD – The MACD is now losing pace in the bullish zone.
Hourly RSI (Relative Strength Index) – The RSI for BTC/USD is now above the 50 level.
Major Support Levels – $62,700, followed by $61,500.
Major Resistance Levels – $63,500, and $63,800.

Ethereum Price Reaches $2,500 Again: Will The Uptrend Hold?

$26 Million Stolen in BingX Hack Amid Ongoing Crypto Attacks

Bitcoin Price Pushes Higher As The Bulls Set Sights on $65K

Crypto Analyst Predicts Dogecoin Will Outperform Bitcoin In 2025, Here’s Why

Is Cardano Price Set to Break $0.47?
$1.6 Billion in Bitcoin and Ethereum Options Expire After Fed Cut
TON Foundation’s Plan to Onboard 500 Million Users
Are Solana, Cardano, Polygon Commodities As US SEC Ends Ethereum Investigation?

CFTC Appoints Dr. Ted Kaouk as First Chief AI Officer

New And Upcoming NFT Projects

2.52 Million Altcoins Are Ruining Crypto’s Future

BLUR Is Down 30%, And Whales Are To Blame–Here’s Why
TON Foundation’s Plan to Onboard 500 Million Users
Are Solana, Cardano, Polygon Commodities As US SEC Ends Ethereum Investigation?
CFTC Appoints Dr. Ted Kaouk as First Chief AI Officer
New And Upcoming NFT Projects
2.52 Million Altcoins Are Ruining Crypto’s Future
BLUR Is Down 30%, And Whales Are To Blame–Here’s Why
-
 Market3 months ago
TON Foundation’s Plan to Onboard 500 Million Users
-
Altcoin3 months ago
Are Solana, Cardano, Polygon Commodities As US SEC Ends Ethereum Investigation?
-
 Regulation5 months ago
CFTC Appoints Dr. Ted Kaouk as First Chief AI Officer
-
 NFT3 months ago
New And Upcoming NFT Projects
-
 Altcoin3 months ago
2.52 Million Altcoins Are Ruining Crypto’s Future
-
 NFT3 months ago
BLUR Is Down 30%, And Whales Are To Blame–Here’s Why
-

 Blockchain5 months ago
Hong Kong’s Securities Association Tips Authorities On Crypto Self-Regulation
-

 Market3 months ago
Ethena (ENA) Whale Faces $13M Loss With 30% Token Drop