Market
Bitcoin Price Faces Challenge at $65K: Can It Break Through?

Bitcoin price gained pace and tested the $65,000 resistance. BTC must clear $65,000 to continue higher in the near term.
- Bitcoin started a steady increase above the $63,000 zone.
- The price is trading above $63,500 and the 100 hourly Simple moving average.
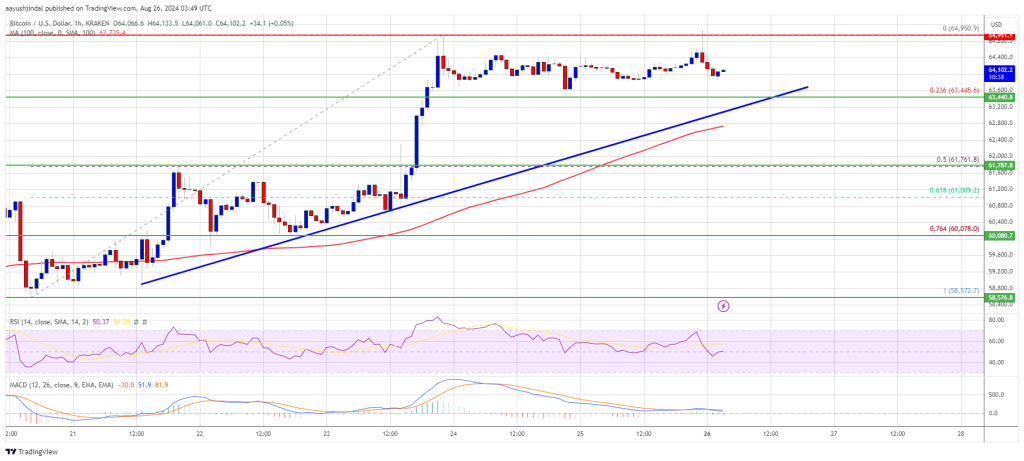
- There is a key bullish trend line forming with support at $63,450 on the hourly chart of the BTC/USD pair (data feed from Kraken).
- The pair might attempt a fresh increase if it clears the $65,000 resistance zone.
Bitcoin Price Eyes More Gains
Bitcoin price remained stable above the $60,000 pivot level. BTC formed a base and started a steady increase above the $62,000 resistance zone. The price climbed above the $63,200 and $63,500 resistance levels.
Finally, the bears appeared near the $65,000 resistance zone. A high was formed at $64,950 and the price is now consolidating gains. There was a minor decline below the $64,500 level. The price tested the 23.6% Fib retracement level of the upward move from the $58,572 swing low to the $64,950 high.
Bitcoin is now trading above $63,200 and the 100 hourly Simple moving average. There is also a key bullish trend line forming with support at $63,450 on the hourly chart of the BTC/USD pair.
On the upside, the price could face resistance near the $64,500 level. The first key resistance is near the $65,000 level. A clear move above the $65,000 resistance might send the price further higher in the coming sessions. The next key resistance could be $65,500.

A close above the $65,500 resistance might spark more upsides. In the stated case, the price could rise and test the $67,200 resistance.
Another Decline In BTC?
If Bitcoin fails to rise above the $65,000 resistance zone, it could start a downside correction. Immediate support on the downside is near the $63,800 level.
The first major support is $63,500. The next support is now near the $62,800 zone. Any more losses might send the price toward the $61,750 support zone or the 50% Fib retracement level of the upward move from the $58,572 swing low to the $64,950 high in the near term.
Technical indicators:
Hourly MACD – The MACD is now losing pace in the bullish zone.
Hourly RSI (Relative Strength Index) – The RSI for BTC/USD is now above the 50 level.
Major Support Levels – $63,800, followed by $63,500.
Major Resistance Levels – $64,500, and $65,000.
Market
Bitcoin Price Pauses Under $100K: Bulls Eye the Milestone

Bitcoin price is consolidating below the $100,000 resistance. BTC bulls might soon attempt to breach the stated milestone and push the price further higher.
- Bitcoin started a fresh increase above the $96,500 zone.
- The price is trading below $98,000 and the 100 hourly Simple moving average.
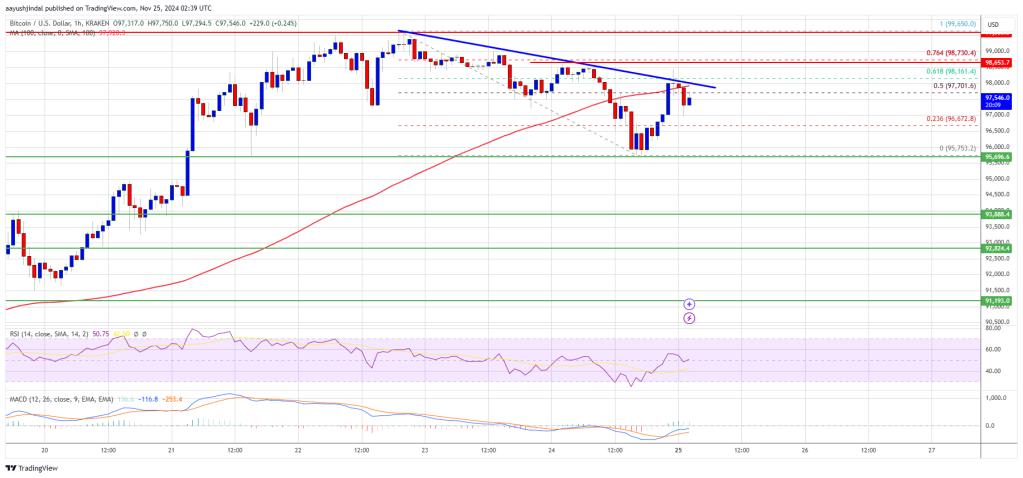
- There is a connecting bearish trend line forming with resistance at $98,000 on the hourly chart of the BTC/USD pair (data feed from Kraken).
- The pair could continue to rise if it clears the $98,000 resistance zone.
Bitcoin Price Eyes More Upsides
Bitcoin price remained supported above the $92,500 level. BTC formed a base and started a fresh increase above the $96,000 level. It cleared the $97,500 level and traded to a new high at $99,650 before there was a pullback.
There was a move below the $98,000 level. A low was formed at $95,973 and the price is now rising. There was a move above the $96,800 resistance level. The price cleared the 50% Fib retracement level of the downward move from the $99,650 swing high to the $95,973 low.
Bitcoin price is now trading below $98,000 and the 100 hourly Simple moving average. On the upside, the price could face resistance near the $98,000 level. There is also a connecting bearish trend line forming with resistance at $98,000 on the hourly chart of the BTC/USD pair. The trend line is close to the 61.8% Fib retracement level of the downward move from the $99,650 swing high to the $95,973 low.
The first key resistance is near the $99,000 level. A clear move above the $99,000 resistance might send the price higher. The next key resistance could be $100,000.

A close above the $100,000 resistance might initiate more gains. In the stated case, the price could rise and test the $102,500 resistance level. Any more gains might send the price toward the $105,000 level.
Downside Correction In BTC?
If Bitcoin fails to rise above the $98,000 resistance zone, it could start a downside correction. Immediate support on the downside is near the $96,800 level.
The first major support is near the $95,750 level. The next support is now near the $95,000 zone. Any more losses might send the price toward the $92,000 support in the near term.
Technical indicators:
Hourly MACD – The MACD is now gaining pace in the bullish zone.
Hourly RSI (Relative Strength Index) – The RSI for BTC/USD is now above the 50 level.
Major Support Levels – $96,800, followed by $95,000.
Major Resistance Levels – $98,000, and $100,000.
Market
Harmful Livestreams Prompt Ban Calls

Since its launch earlier this year, the meme coin platform Pump.fun has become a notable name in the crypto industry. This platform allows users, regardless of their technical know-how, to create and launch meme coins swiftly.
However, the live-streaming feature has led to serious controversies and calls for a ban due to inappropriate content and financial malfeasance.
Originally, Pump.fun’s livestream was intended to let developers promote their meme coins. Regrettably, some users have misused it to broadcast extreme and harmful activities. A notable incident involved a developer promoting self-harm if his cryptocurrency reached a $25 million market cap.
Additionally, some users threaten to harm pets or even humans if their coins do not achieve certain market capitalization goals.
The situation reached a critical point when Beau, a safety project manager at Pudgy Penguins, reported an alarming livestream. In it, an individual threatened to hang themselves if their coin did not reach a specific market cap.
“Shut down the livestream feature. This is out of control,” Beau stated.
The platform has also been a hotbed for financial scams, prominently featuring “rug pulls.” A recent case involved a school-aged individual who created a meme coin named QUANT, quickly amassing $30,000 and then exiting the project, leaving investors with worthless digital tokens. This led to the kid’s doxxing, with his personal information and that of his family maliciously shared online.
In response to these incidents, some community members have called for the complete shutdown of the platform. Conversely, others suggest that simply disabling the livestream function might suffice.
Eddie, a legal intern, strongly criticized the platform’s governance. He believes that turning off the livestreams or moderating them is crucial.
“There is an art to shock value on stream. Simply sharing nudity or other shocking and even horrific content is not innately interesting. People seek stories and novel concepts that engage them. The content shared on pump livestreams at the moment are not only uninteresting, but conceptually lazy,” Eddie said.
Yet Alon, a Pump.fun executive, claims that the platform’s content has been moderated since day one.
“We have a large team of moderators working around the clock and an internal team of engineers that’s working on helping us deal with increased scale of coins, streams, and comments. I admit that our moderation isn’t perfect, so if you’re aware of a coin where moderation isn’t enforced, please report it in our support channels immediately,” Alon said.
The ongoing debate reflects the platform’s dilemma. While it offers users significant creative freedom, it also poses serious risks without stringent moderation.
Now, the community and stakeholders await decisive action. The call for stronger moderation is loud and clear, aiming to protect both the platform’s integrity and its users from further harm.
Despite these controversies, Pump.fun has continued to perform well financially. Data from DefiLlama shows that the platform has amassed over $215 million in revenue since March 2024.

Furthermore, the platform has facilitated the deployment of more than 3.8 million meme coins.
Disclaimer
In adherence to the Trust Project guidelines, BeInCrypto is committed to unbiased, transparent reporting. This news article aims to provide accurate, timely information. However, readers are advised to verify facts independently and consult with a professional before making any decisions based on this content. Please note that our Terms and Conditions, Privacy Policy, and Disclaimers have been updated.
Market
XRP Price Builds a Base: Can Bulls Ignite a New Rally?

XRP price surged further above the $1.45 and $1.50 resistance levels. The price is now consolidating gains near $1.40 and might aim for more upsides.
- XRP price started a fresh surge above the $1.40 resistance level.
- The price is now trading above $1.350 and the 100-hourly Simple Moving Average.
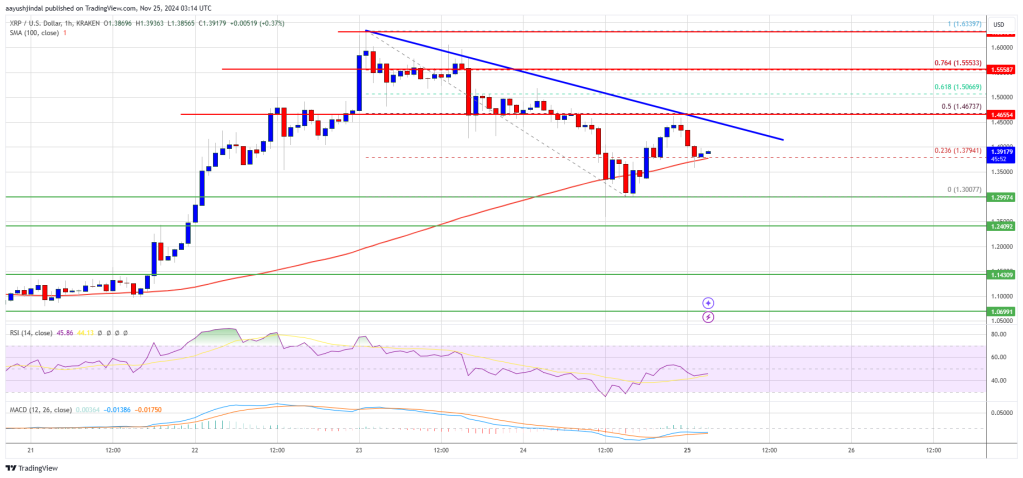
- There is a new connecting bearish trend line forming with resistance at $1.450 on the hourly chart of the XRP/USD pair (data source from Kraken).
- The pair is showing positive signs and might extend its rally above the $1.450 resistance.
XRP Price Holds Gains
XRP price formed a base above $1.250 and started a fresh increase. There was a move above the $1.350 and $1.40 resistance levels. It even pumped above the $1.50 level, beating Ethereum and Bitcoin in the past two days.
A high was formed at $1.6339 before there was a pullback. The price dipped below the $1.50 support level. A low was formed at $1.3007 and the price is now rising. There was a move above the 23.6% Fib retracement level of the downward move from the $1.6339 swing high to the $1.3007 low.
The price is now trading above $1.40 and the 100-hourly Simple Moving Average. On the upside, the price might face resistance near the $1.420 level. The first major resistance is near the $1.450 level.
There is also a new connecting bearish trend line forming with resistance at $1.450 on the hourly chart of the XRP/USD pair. It is close to the 50% Fib retracement level of the downward move from the $1.6339 swing high to the $1.3007 low.
The next key resistance could be $1.500. A clear move above the $1.50 resistance might send the price toward the $1.5550 resistance. Any more gains might send the price toward the $1.620 resistance or even $1.650 in the near term. The next major hurdle for the bulls might be $1.750 or $1.80.
Are Dips Limited?
If XRP fails to clear the $1.450 resistance zone, it could start a downside correction. Initial support on the downside is near the $1.3450 level. The next major support is near the $1.320 level.
If there is a downside break and a close below the $1.320 level, the price might continue to decline toward the $1.300 support. The next major support sits near the $1.240 zone.
Technical Indicators
Hourly MACD – The MACD for XRP/USD is now gaining pace in the bullish zone.
Hourly RSI (Relative Strength Index) – The RSI for XRP/USD is now above the 50 level.
Major Support Levels – $1.4200 and $1.4000.
Major Resistance Levels – $1.4500 and $1.5000.
-

 Bitcoin21 hours ago
Bitcoin Price Is Decoupling From Gold Again — What’s Happening?
-

 Market23 hours ago
Why a New Solana All-Time High May Be Near
-

 Bitcoin17 hours ago
Senator’s Bold Proposal To Replenish US Reserves
-

 Market15 hours ago
Can the SAND Token Price Rally Be Sustained?
-

 Bitcoin14 hours ago
Bitcoin Whales Remain Determined, $3.96 Billion Worth Of BTC Gobbled Up In 96 Hours
-

 Market14 hours ago
Cantor Fitzgerald Deepens Tether Ties With 5% Stake Acquisition
-

 Market20 hours ago
Winklevoss Urges Scrutiny of FTX and SBF Political Donations
-

 Bitcoin20 hours ago
Bitcoin Correction Looms As Analyst Predicts Fall To $85,600


