
Market
Can Ethereum (ETH) Long-Term Optimism Overcome Doubt?

Ethereum (ETH) price attempted to surpass $2,700 this week but fell short of the target. Despite the pullback, the cryptocurrency notes a 3.50% increase in the last seven days.
But as the price wobbles around the same region, long- and short-term holders appear to have different views on ETH.
Ethereum Faces Mixed Outlook
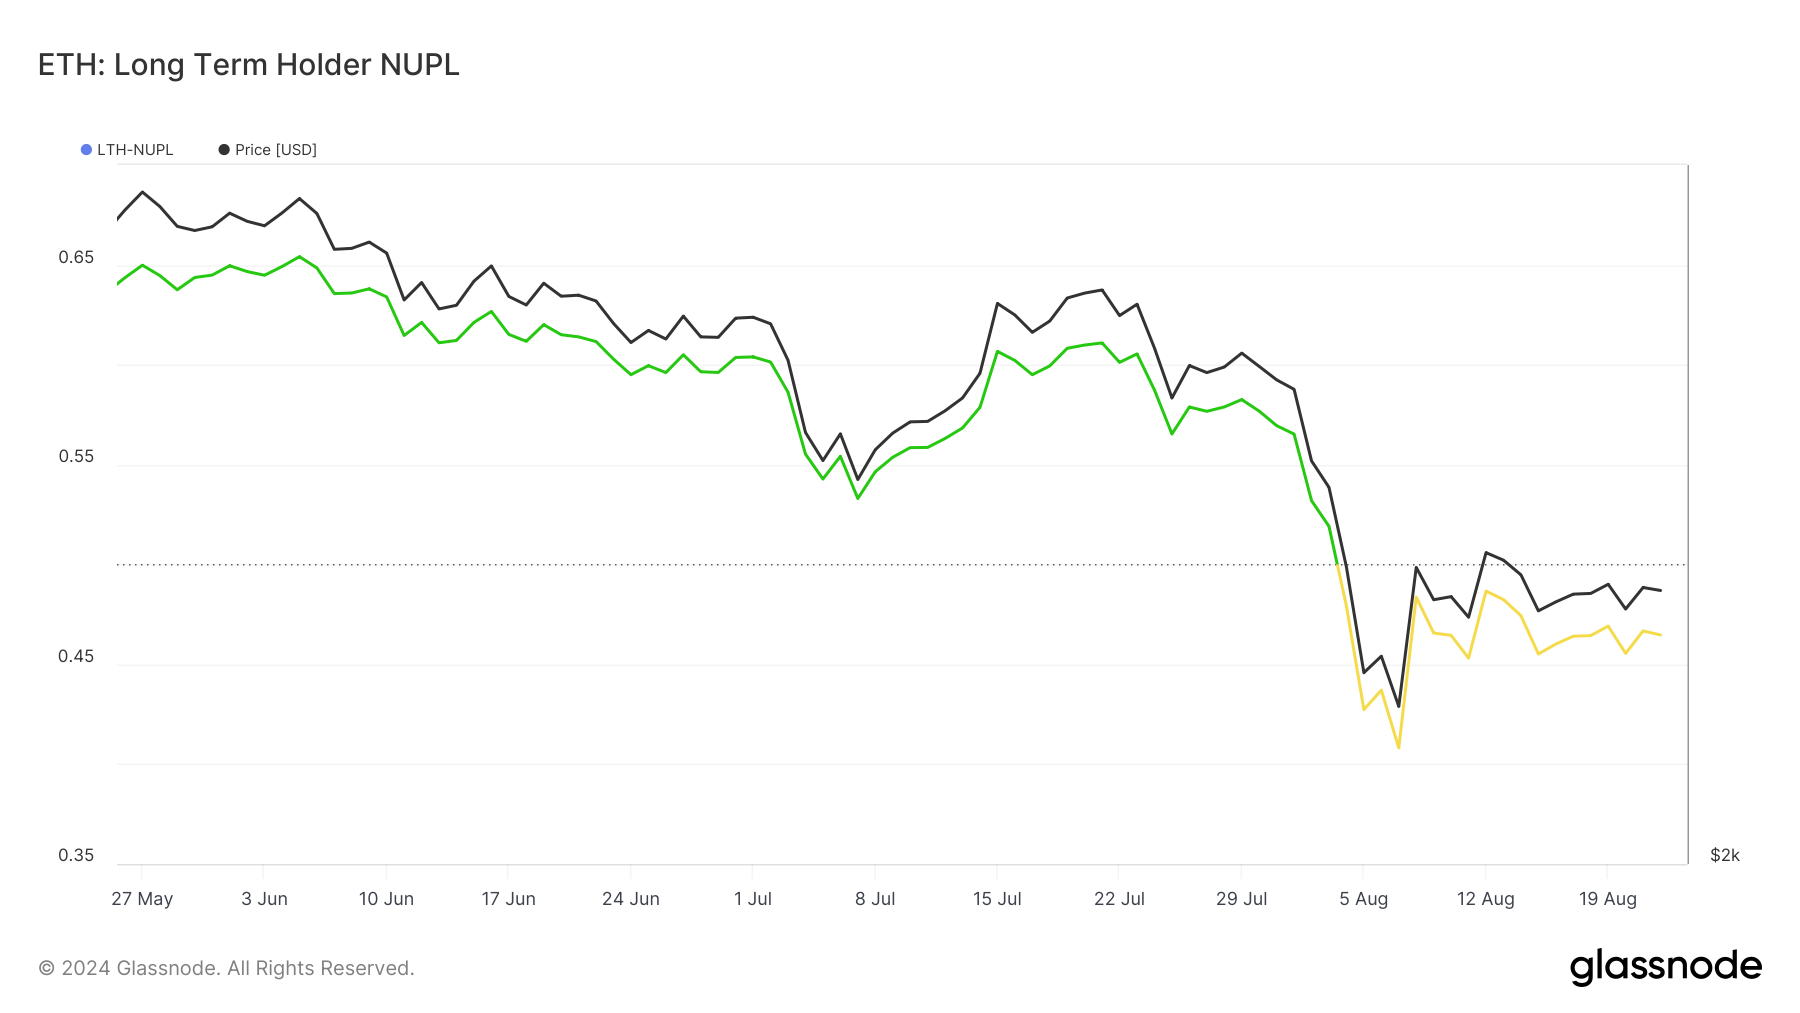
One way to gauge investor sentiment regarding a cryptocurrency is by analyzing the Net Unrealized Profit/Loss (NUPL) metric. This indicator measures the level of unrealized gains or losses held by market participants, offering insights into the broader sentiment and psychology of holders.
The NUPL is divided into various segments representing stages like belief, greed, optimism, hope, and capitulation—each reflecting how investors feel about the asset at different times.
According to Glassnode data, the Long-Term Holder (LTH) NUPL for Ethereum is currently in the optimistic zone. This suggests that long-term holders still have confidence in ETH, viewing the recent price decline as a temporary phase.
Read more: How to Invest in Ethereum ETFs?
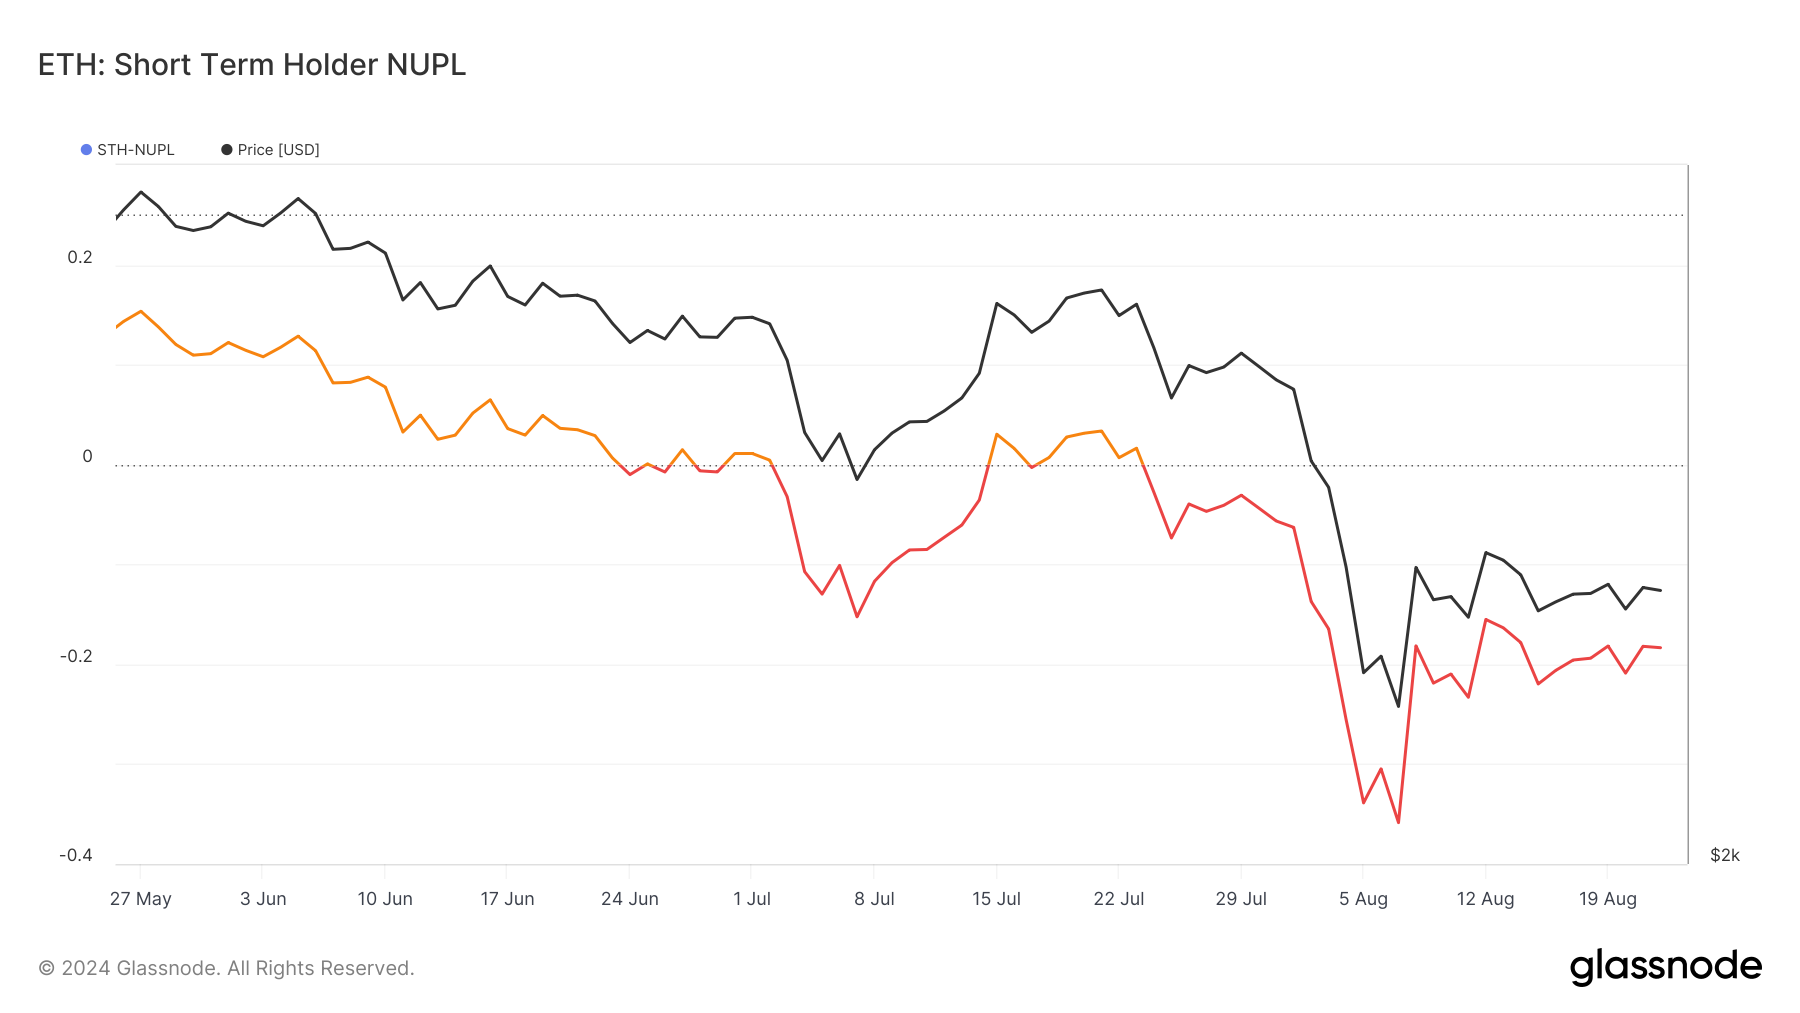
However, the situation is different for Short-Term Holders (STH). Data from on-chain analytics shows that the STH-NUPL currently resides in the capitulation zone. This indicates that short-term holders are less optimistic and do not expect ETH’s price to recover soon.
This bearish sentiment is likely linked to ETH’s recent price performance. At press time, ETH is trading at $2,661, reflecting a 21,9% decline over the last 30 days.
The drop implies that most recent buyers are holding ETH at a loss, which could reinforce their pessimistic outlook. If the price remains stagnant or declines further, it may be difficult for these holders to shift to a more positive sentiment.
Regarding ETH’s price outlook, analyst Michaël van de Poppe, founder of MN Capital, suggests that for Ethereum to have a shot at surpassing $3,100, it first needs to break through the $2,700 resistance level.
“Ethereum looks excellent, but it needs to continue climbing upwards. Crucial level to break: $2,700.There is nothing between $2,700 and $3,100, likely triggering a big upward run on altcoins,” van de Poppe shared on August 22.
ETH Price Prediction: Will It Test $3,000?
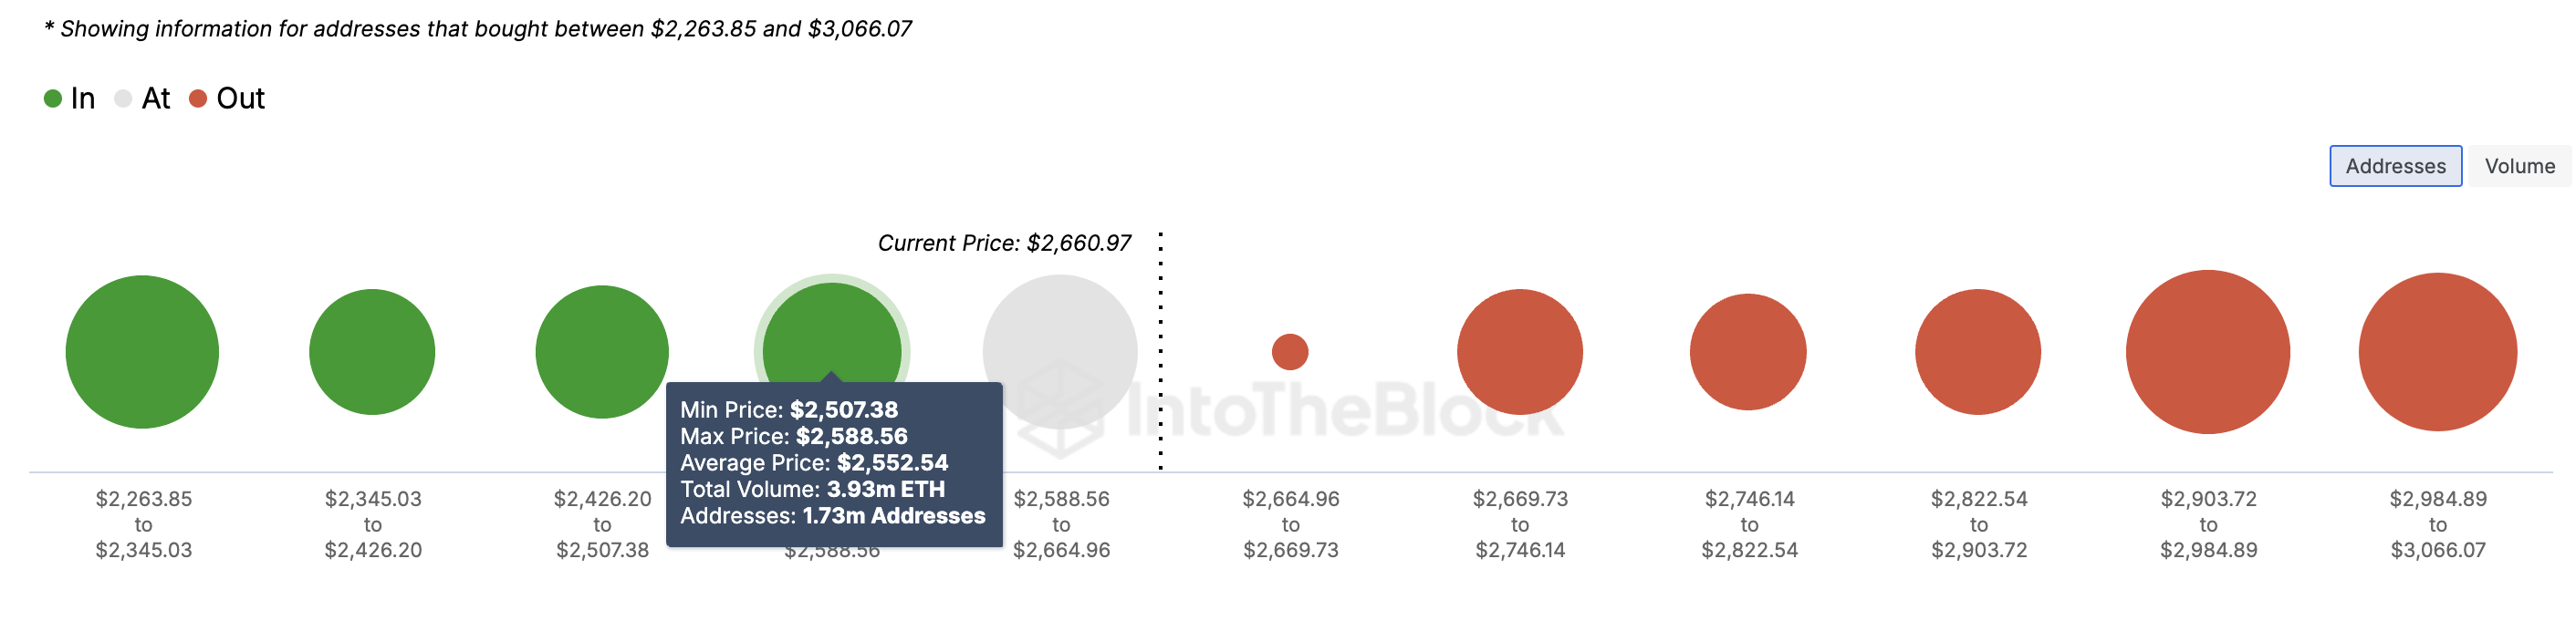
Concerning the short-term outlook, the In/Out of Money Around Price (IOMAP) revealed that ETH could build up on its recent increase. The IOMAP shows the number of addresses that purchased a cryptocurrency at a lower value than the current price, those who bought at the current price, and others who bought higher.
With this data, one can spot support and resistance and get insights into the next level the price can reach. The higher the number of addresses at a price range, the stronger the support or resistance at that level.
According to IntoTheBlock, 1.73 million addresses purchased 3.93 million ETH at an average price of $2,552. This number of addresses is more than those in the loss that accumulated between $2,699 and $2,867.
Read more: Ethereum (ETH) Price Prediction 2024/2025/2030
Therefore, Ethereum’s price is likely to surpass $2,900 in the short term. If this occurs, the path to reaching $3,100 could become easier. However, failing to break the overhead resistance might cause the price to retrace. If that happens, ETH’s price could drop to $2,426.
Disclaimer
In line with the Trust Project guidelines, this price analysis article is for informational purposes only and should not be considered financial or investment advice. BeInCrypto is committed to accurate, unbiased reporting, but market conditions are subject to change without notice. Always conduct your own research and consult with a professional before making any financial decisions. Please note that our Terms and Conditions, Privacy Policy, and Disclaimers have been updated.


Since early 2025, exchanges such as Cboe BZX and NYSE Arca have submitted proposals to the US SEC to incorporate staking services into existing spot ETFs. If approved, these funds could accelerate crypto adoption by giving traditional investors streamlined access to ETH.
Brian Fabian Crain, CEO and Co-founder of Chorus One, told BeInCrypto he remains “cautiously optimistic” about the proposals gaining approval before the end of President Trump’s first term. Still, he emphasized that the SEC will likely focus on ensuring strict investor protections before moving forward.
The Push for Staked Ethereum ETFs in the US
In mid-February, both Cboe BZX Exchange and NYSE Arca took steps towards Ethereum staking ETFs. Cboe BZX filed to amend the 21Shares ETF, while NYSE Arca followed two days later with a similar proposal for Grayscale’s ETF offerings.
Staking is a fundamental component of Proof-of-Stake (PoS) blockchains. Instead of relying on energy-intensive mining, such as in Proof-of-Work blockchains like Bitcoin, PoS networks select participants.
These participants act as validators and are in charge of verifying and adding new transactions, or blocks, to the blockchain based on the amount of cryptocurrency they have “staked” or locked up.
If approved, these Ethereum ETFs would allow traditional investors to gain exposure to the cryptocurrency while also earning passive income by contributing to the security of the Ethereum network through staking.
This move would also represent another significant step forward for institutional crypto adoption.
“The approval of an Ethereum staking ETF would mark a watershed for institutional adoption. Indeed, a staking-enabled ETF provides a regulated, easy-to-access exposure to ETH that includes its native yield, all within the familiar ETF framework. This means asset managers and pensions could gain passive ETH exposure without handling private keys or navigating crypto exchanges, significantly lowering operational barriers,” Crain told BeInCrypto.
It would also enhance Ethereum’s market position relative to other crypto assets.
Can Staking Yield Revitalize Ethereum’s Market Position?
Throughout much of 2024 and early 2025, Ethereum’s price appreciation lagged significantly behind Bitcoin. The ETH/BTC ratio hit a record low in early April 2025, indicating that Bitcoin was outperforming Ethereum.
Fluctuations in the broader crypto market further complicated Ethereum’s market position. Earlier this month, the network reached its lowest price in two years, eroding investor confidence.

With increasing support from exchanges and asset managers for an Ethereum-staking ETF, a development of this scale can potentially reposition Ethereum.
“One key differentiator of Ethereum is its ability to generate yield through staking — something Bitcoin doesn’t offer. Enabling that feature within an ETF makes Ethereum-based products more attractive and competitive. Ethereum’s ~3% annual staking yield is a major draw for investors and a clear distinction from Bitcoin. It means that even if ETH’s price growth trails Bitcoin’s, staked ETH can still deliver higher total returns thanks to the yield. By packaging this yield into an ETF, Ethereum becomes a more compelling investment option for institutions focused on income,” Crain explained.
Allowing staking within an ETF structure would spur greater ETH demand and investor appetite and enhance Ethereum’s security by expanding the validator pool and decentralizing staking across a wider range of holders.
Increased total staked ETH would further strengthen the network against attacks.
With other jurisdictions already legally permitting staking services, the United States might see their early adoption as a reason to act quickly and maintain a competitive edge.
How Hong Kong’s Staking Approval Impacts the US SEC
This week, Hong Kong’s Securities and Futures Commission (SFC) announced new guidance allowing licensed crypto exchanges and funds in the city to offer staking services. Platforms must meet strict conditions before providing these services.
“The SFC’s framework emphasizes investor protection while embracing innovation. For example, Hong Kong requires that platforms retain full control of client assets (no outsourcing) and disclose all staking risks transparently,” Crain explained.
Hong Kong set itself apart from other jurisdictions like Singapore, which banned retail staking in 2023, and the previous SEC’s administration on Gary Gensler, which took a historically restrictive approach.
Crain believes this new development will primarily exert competitive pressure on the SEC to follow accordingly.
“As a major international financial hub, Hong Kong’s adoption of regulated staking sends a message: it is possible to allow staking in a compliant manner. US regulators often watch regimes like Hong Kong as bellwethers for emerging best practices. The SEC will take note that Hong Kong is not only allowing staking but even paving the way for staking services in ETFs (the SFC’s rules mention authorized virtual asset funds can offer staking under certain caps and conditions),” he said.
Incorporating staking into Hong Kong-listed crypto ETFs would put US funds and exchanges at a competitive disadvantage if the SEC maintains its prohibition.
When reviewing the 21Shares and Grayscale applications, the SEC may need to consider that global investors could turn to international markets to access these staking ETF products if the US doesn’t eventually allow them.
While the competitive aspect is a factor, the SEC will also need to address various complexities inherent in Ethereum staking, which may be obstacles to final approval.
The “Investment Contract” Conundrum
Among the most important factors the SEC will consider is whether staking programs constitute investment contracts.
The previous administration’s SEC targeted centralized exchanges like Kraken and Coinbase for operating staking services considered unregistered profit schemes and violating US securities laws.
In centralized exchanges, users must effectively transfer custody of their cryptocurrency to a third-party entity that manages staking and the distribution of rewards. However, this model is distinct from the process inherent in Ethereum, a decentralized blockchain.
“Unlike exchange staking programs, an ETF staking its own assets isn’t ‘selling’ a staking service to others, it’s directly participating in network consensus. This nuance, emphasized in recent filings and comment letters, is contributing to the SEC’s willingness to reconsider its stance. Essentially, the argument is that staking is a core technical feature of Ethereum, not an ancillary investment product,” Crain told BeInCrypto.
While an ETF staking its assets presents a different model, the SEC will look closely for security violations. Addressing this concern requires demonstrating that protocol rewards originate inherently from the decentralized network, not the sponsor’s business efforts.
This issue, though largely conceptual, is critical; SEC approval hinges on satisfying securities law requirements regarding staking.
Meanwhile, slashing risks are another issue of concern.
Slashing Risks: A Unique Challenge for Ethereum Staking ETFs?
A key difference from traditional commodity funds is that a staking ETF must actively participate in network consensus, exposing it to the potential for slashing.
Slashing is a penalty where a portion of the staked ETH can be destroyed if a validator acts improperly or makes mistakes. For investors, the ETF’s principal could suffer partial losses due to operational errors, a risk not present in non-staking ETFs.
“The SEC will assess how significant this risk is and whether it’s been mitigated. Filings note that the Sponsor will not cover slashing losses on behalf of the trust, meaning investors bear that risk. This forces the SEC to consider if average investors can tolerate the possibility of losing funds not due to market movement but due to a technical protocol penalty. This risk must be transparently disclosed and managed in any approved product,” Crain explained.
Typically, custodians have insurance for asset loss due to theft or cyberattacks. However, slashing is a protocol-enforced penalty, not traditional “theft,” and many custody insurance policies might not cover it. Therefore, the SEC will likely inquire about the safeguards should a slashing event occur.
This novel aspect of Ethereum staking creates certain ambiguities in accounting treatment.
“The SEC will scrutinize how the custodian reports on staked holdings. The ETF’s [net asset value accounting needs to capture both the base ETH and the accumulated rewards. Custodians will likely provide reporting on how much ETH is staked versus liquid, and any rewards received. The SEC will require independent audits or attestations confirming that the custodian indeed holds the ETH it claims (both original and any newly awarded ETH) and that controls around staking are effective,” Crain explained.
Liquidity risks associated with Ethereum staking are another factor to consider.
Further SEC Considerations
A key detail the SEC will examine is that staked ETH lacks instant liquidity.
Even after the Shanghai upgrade enabled withdrawals in 2023, the Ethereum protocol still incorporates delays and queues that prevent staked ETH from being instantly liquid upon initiating the unstaking process.
“The SEC will examine how the fund handles redemption requests if a large portion of assets are locked in staking. For example, exiting a validator position can take from days to weeks if there’s a backlog (due to the network’s exit queue and “churn limit” on how many validators can unlock per epoch),” Chain told BeInCrypto.
During heavy outflows, the fund might not immediately access all its ETH to meet redemptions. The SEC sees this as a structural complexity that could harm investors if not planned for.
“In a worst-case scenario, if the ETF had to wait days or weeks to fully exit staking positions, an investor redeeming could either wait longer for their proceeds or get paid in-kind with staked ETH (which they then must figure out how to redeem themselves). This isn’t a typical concern in ETFs and is a potential downside for investors expecting high liquidity,” Crain added.
Finally, there are also security risks that must be addressed responsibly.
The “Point-and-Click” Model
Securing custody for Ethereum in an ETF is already crucial, and adding staking will increase the SEC’s scrutiny.
“The SEC will examine how the ETF’s custodian secures the ETH private keys, especially since those keys (or derivative keys) will be used to stake. Normally, custodians use cold storage for crypto assets, but staking requires keys to be online in a validator. The challenge is to minimize exposure while still participating in staking,” Crain said.
Recognizing the vulnerability of keys during validator activation, the SEC will most likely require custodians to use cutting-edge security modules to prevent hacking. Any prior incidents of security breaches involving a custodian would raise serious concerns.
Aiming to lessen these risks, some exchanges have proposed that the ETH for staking remain within the custodian’s control at all times. This model is largely referred to as a “point-and-click” mechanism.
“NYSE Arca’s proposal to allow the Grayscale Ethereum Trust (and a smaller ‘Mini’ trust) to stake its Ether via a ‘point-and-click’ mechanism is a test case that will significantly inform the SEC’s evaluation of staking in an ETF context. The point-and-click staking model is essentially a way to stake without altering the fundamental custody or introducing extra complexities for investors. In practice, this means the trust’s custodian would simply enable staking on the held ETH through an interface. The coins don’t leave the custody wallet, and the process is as straightforward as clicking a button,” Crain explained.
The proposal directly tackles the SEC’s security worries by emphasizing that the ETH never leaves the custodian, thereby minimizing the theft risk. Furthermore, it clarifies that the yield is generated automatically by the network, not through the entrepreneurial endeavors of a third party.
When Will the SEC Approve Staking in Ethereum ETFs?
Despite the complexities and technical details of staking in Ethereum ETFs, the prevailing political climate in the US could lead to a more favorable environment for their eventual approval.
“On balance, it now seems more likely than not that the SEC will approve a staking feature for Ethereum ETFs in the relatively near future. A more receptive SEC leadership post-2025, strong political backing for staking in ETPs, and well-crafted proposals addressing earlier concerns — such as the point-and-click model — all tilt the odds toward approval. A year or two ago, the SEC was firmly opposed. Now, the conversation has shifted to ‘how to do this safely,’ which marks a significant change,” Crain told BeInCrypto.
That said, Crain cautioned that the SEC will not approve an ETF of this kind until it’s fully satisfied with the investor protections in place. Even so, the overall outlook remains positive.
“Considering all the factors discussed, the outlook for an Ethereum staking ETF approval appears cautiously optimistic. The likelihood of eventual approval is growing, though the timing remains a subject of debate,” Crain concluded.
In the best-case scenario, an Ethereum staking ETF could gain approval by the end of 2025.
Disclaimer
Following the Trust Project guidelines, this feature article presents opinions and perspectives from industry experts or individuals. BeInCrypto is dedicated to transparent reporting, but the views expressed in this article do not necessarily reflect those of BeInCrypto or its staff. Readers should verify information independently and consult with a professional before making decisions based on this content. Please note that our Terms and Conditions, Privacy Policy, and Disclaimers have been updated.


The SEC and Binance filed a joint motion to pause their lawsuit for 60 days. They requested a prior pause 60 days ago and have “been in productive discussions” since then.
Both parties have asked for more time to finalize an agreement and consider all the relevant policy implications. In the main, however, it’s a substantially similar agreement to the one between the SEC and Ripple yesterday.
Binance and SEC Discussing a Settlement
The SEC has been dropping a lot of its most prominent enforcement actions lately, such as its lawsuit against Ripple. Still, despite this progress, a few outstanding cases remain.
The SEC has been ending lawsuits against prominent exchanges like Coinbase and Kraken, and now it’s preparing to drop one against Binance:
“Pursuant to the Court’s February 13, 2025 Minute Order, Plaintiff Securities and Exchange Commission and Defendants Binance Holdings Limited… and Changpeng Zhao submit this joint status report and jointly move to continue to stay this case for a period of 60 additional days,” a motion filed today read.
Binance is the world’s largest crypto exchange, and it has been engaged in this fight since 2023. The SEC sued Binance in June of that year, alleging that it committed a few serious crimes.
In addition to violating securities laws, the Commission also claims that Binance deliberately lied to regulators. This caused serious problems for its business, prompting a lengthy battle.
The SEC, however, is under new management now. Paul Atkins is the Commission’s new Chair, and he’s prioritized friendly crypto regulation.
Before his confirmation, the SEC, under Acting Chair Mark Uyeda, filed a joint request with Binance to pause the lawsuit 60 days ago, and they’re asking for another extension.
Today’s filing is slightly shorter than the previous one, but it suggests that real progress has been made. It claims that Binance and the SEC “have been in productive discussions” concerning the Crypto Task Force and broader policy implications of a settlement. However, they still need more time to fully consider a resolution.
This agreement is similar to the one filed yesterday. Specifically, the Commission also requested a 60-day pause in a cross-appeal from Ripple, attempting to tie up loose ends without wasting the court’s resources.
There are a few subtle differences, but Binance’s filing with the SEC attempts to meet the same basic goals.
Disclaimer
In adherence to the Trust Project guidelines, BeInCrypto is committed to unbiased, transparent reporting. This news article aims to provide accurate, timely information. However, readers are advised to verify facts independently and consult with a professional before making any decisions based on this content. Please note that our Terms and Conditions, Privacy Policy, and Disclaimers have been updated.

Crypto whales are making bold moves following Donald Trump’s 90-day tariff pause, with Ethereum (ETH), Mantra (OM), and Onyxcoin (XCN) drawing significant accumulation.
ETH whales pushed holdings to their highest level since September 2023, while OM holders are quietly increasing exposure amid the growing real-world asset narrative. XCN, meanwhile, saw a sharp spike in whale activity alongside a 50% price surge in just 24 hours.
Ethereum (ETH)
The broader crypto market rallied after Donald Trump announced a 90-day pause on tariffs—excluding China—boosting investor sentiment across risk assets.
Ethereum followed suit, with on-chain data showing a rise in crypto whales activity; the number of addresses holding between 1,000 and 10,000 ETH climbed from 5,376 to 5,417 between April 9 and 10, reaching its highest level since September 2023.
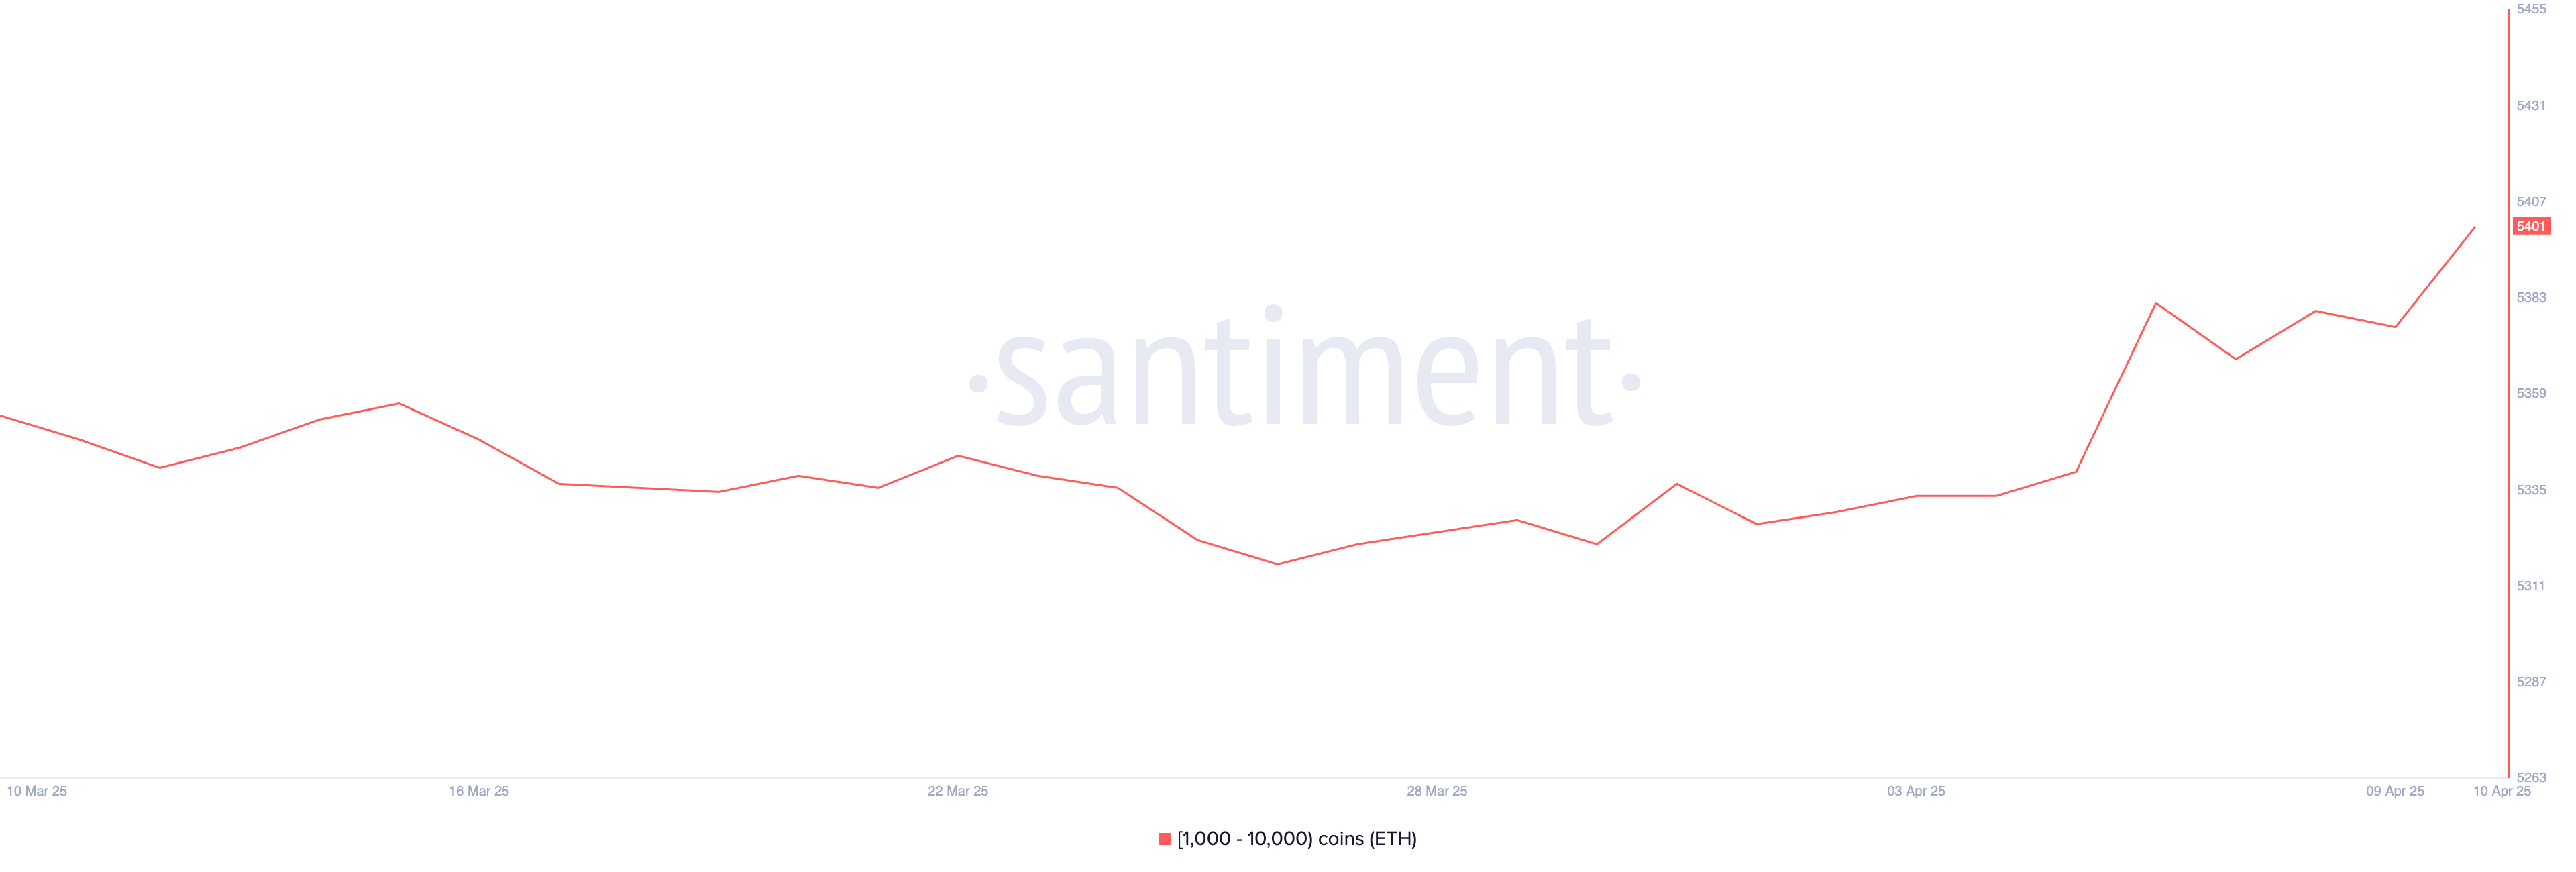
If Ethereum can maintain this renewed momentum, it may test key resistance levels at $1,749 and potentially rally further toward $1,954 and $2,104. However, macroeconomic uncertainty still looms.
A sentiment reversal could see Ethereum price retesting the $1,412 support zone. If that level fails, a deeper decline toward $1,200—or even $1,000—is possible.
Some analysts have gone as far as comparing Ethereum’s decline to Nokia’s historical collapse, warning of long-term structural weakness.
Mantra (OM)
Real-world assets (RWAs) on the blockchain have hit a new all-time high, surpassing $20 billion in total value, reinforcing their growing importance as a crypto narrative and sector.
Binance Research also highlighted that RWA tokens have shown more resilience than Bitcoin during tariff-related volatility, further boosting confidence in the sector.
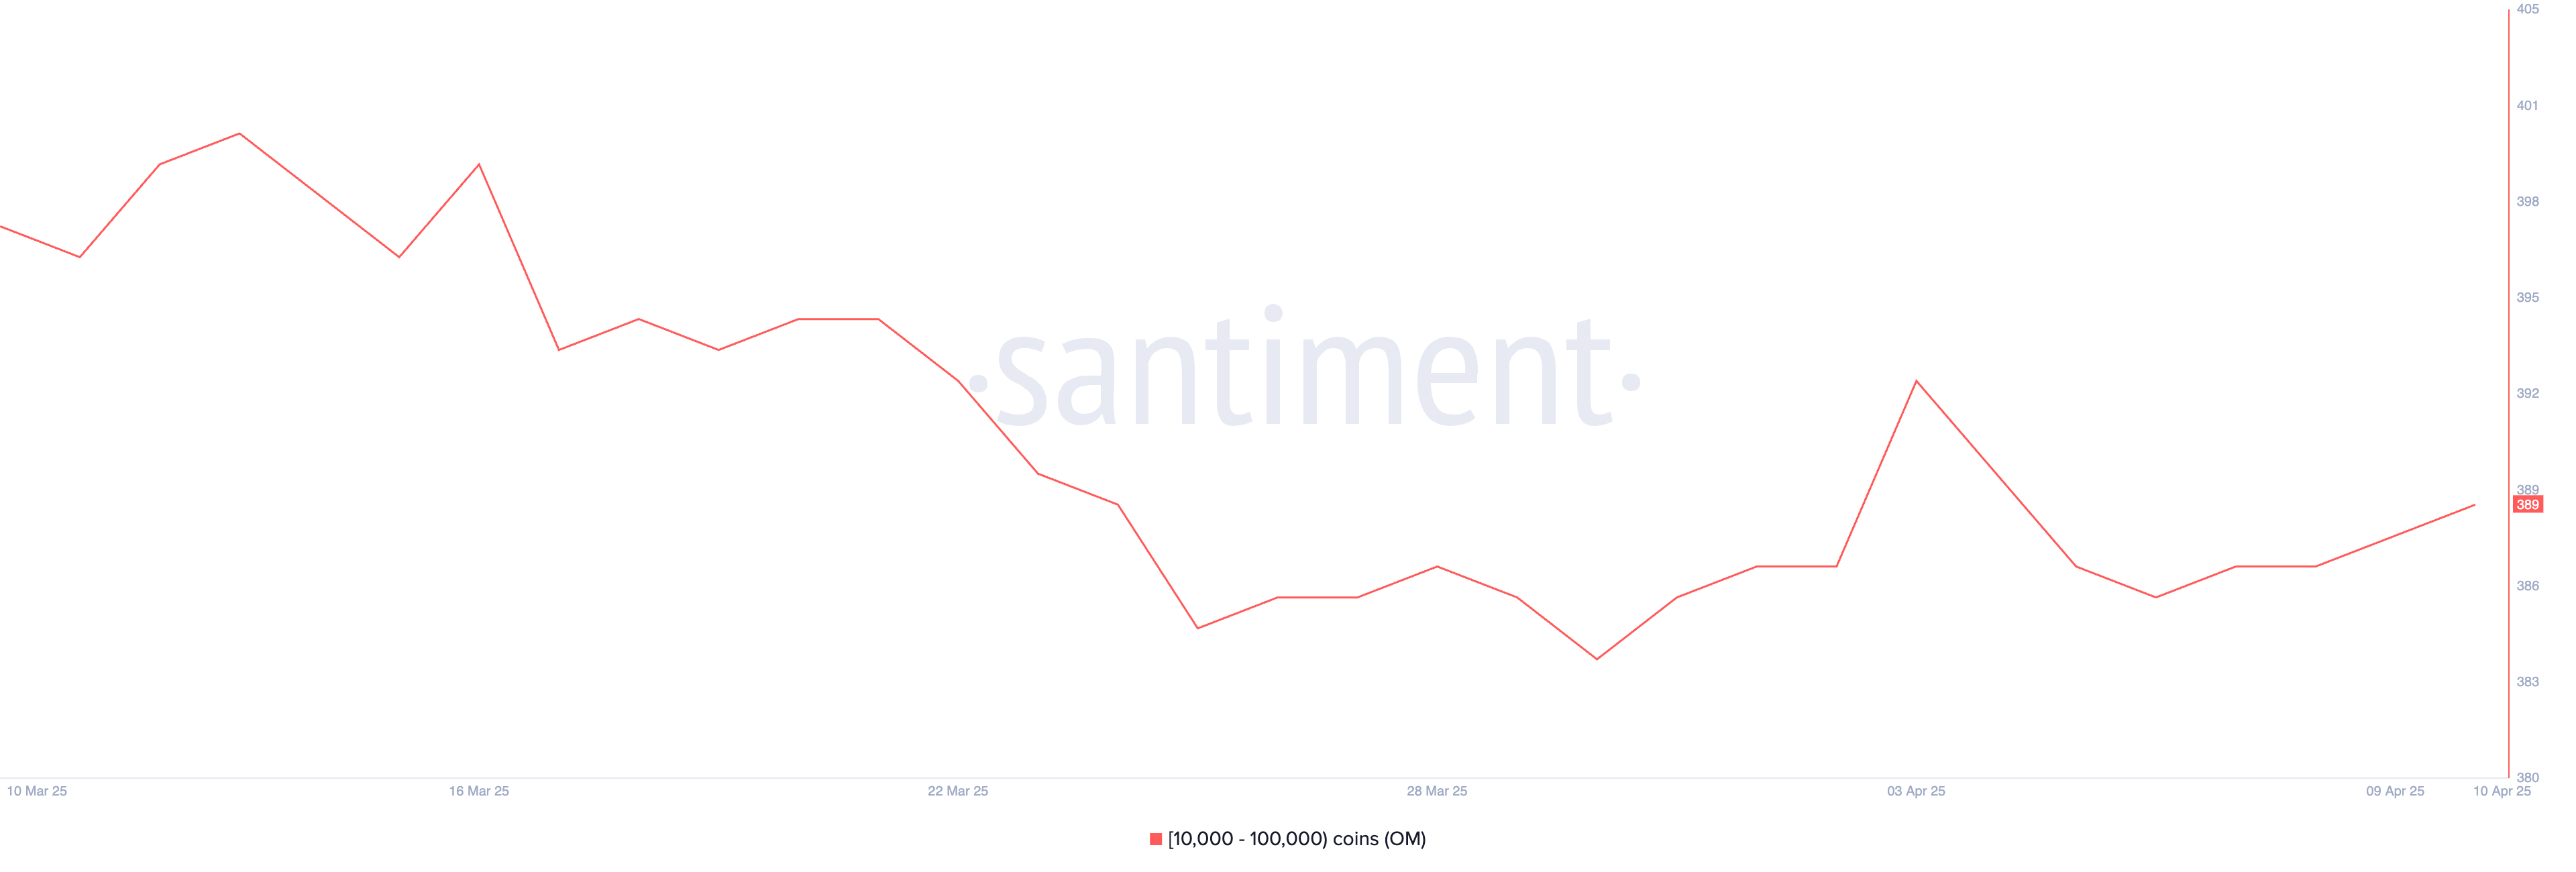
With the RWA narrative gaining traction, OM could see significant upside. Between April 6 and April 10, the number of OM whale addresses holding between 10,000 and 100,000 tokens rose from 386 to 389, signaling quiet accumulation.
If OM breaks past the resistance levels at $6.51 and $6.85, it could climb above $7. However, if the momentum fades, a correction could push the token down to $6.11, with further downside risk toward $5.68.
Onyxcoin (XCN)
Onyxcoin (XCN) has surged over 50% in the past 24 hours, breaking above the $0.02 mark as whale accumulation intensifies.
Between April 7 and April 10, the number of addresses holding between 1 million and 10 million XCN rose from 503 to 532, signaling renewed interest from large holders.
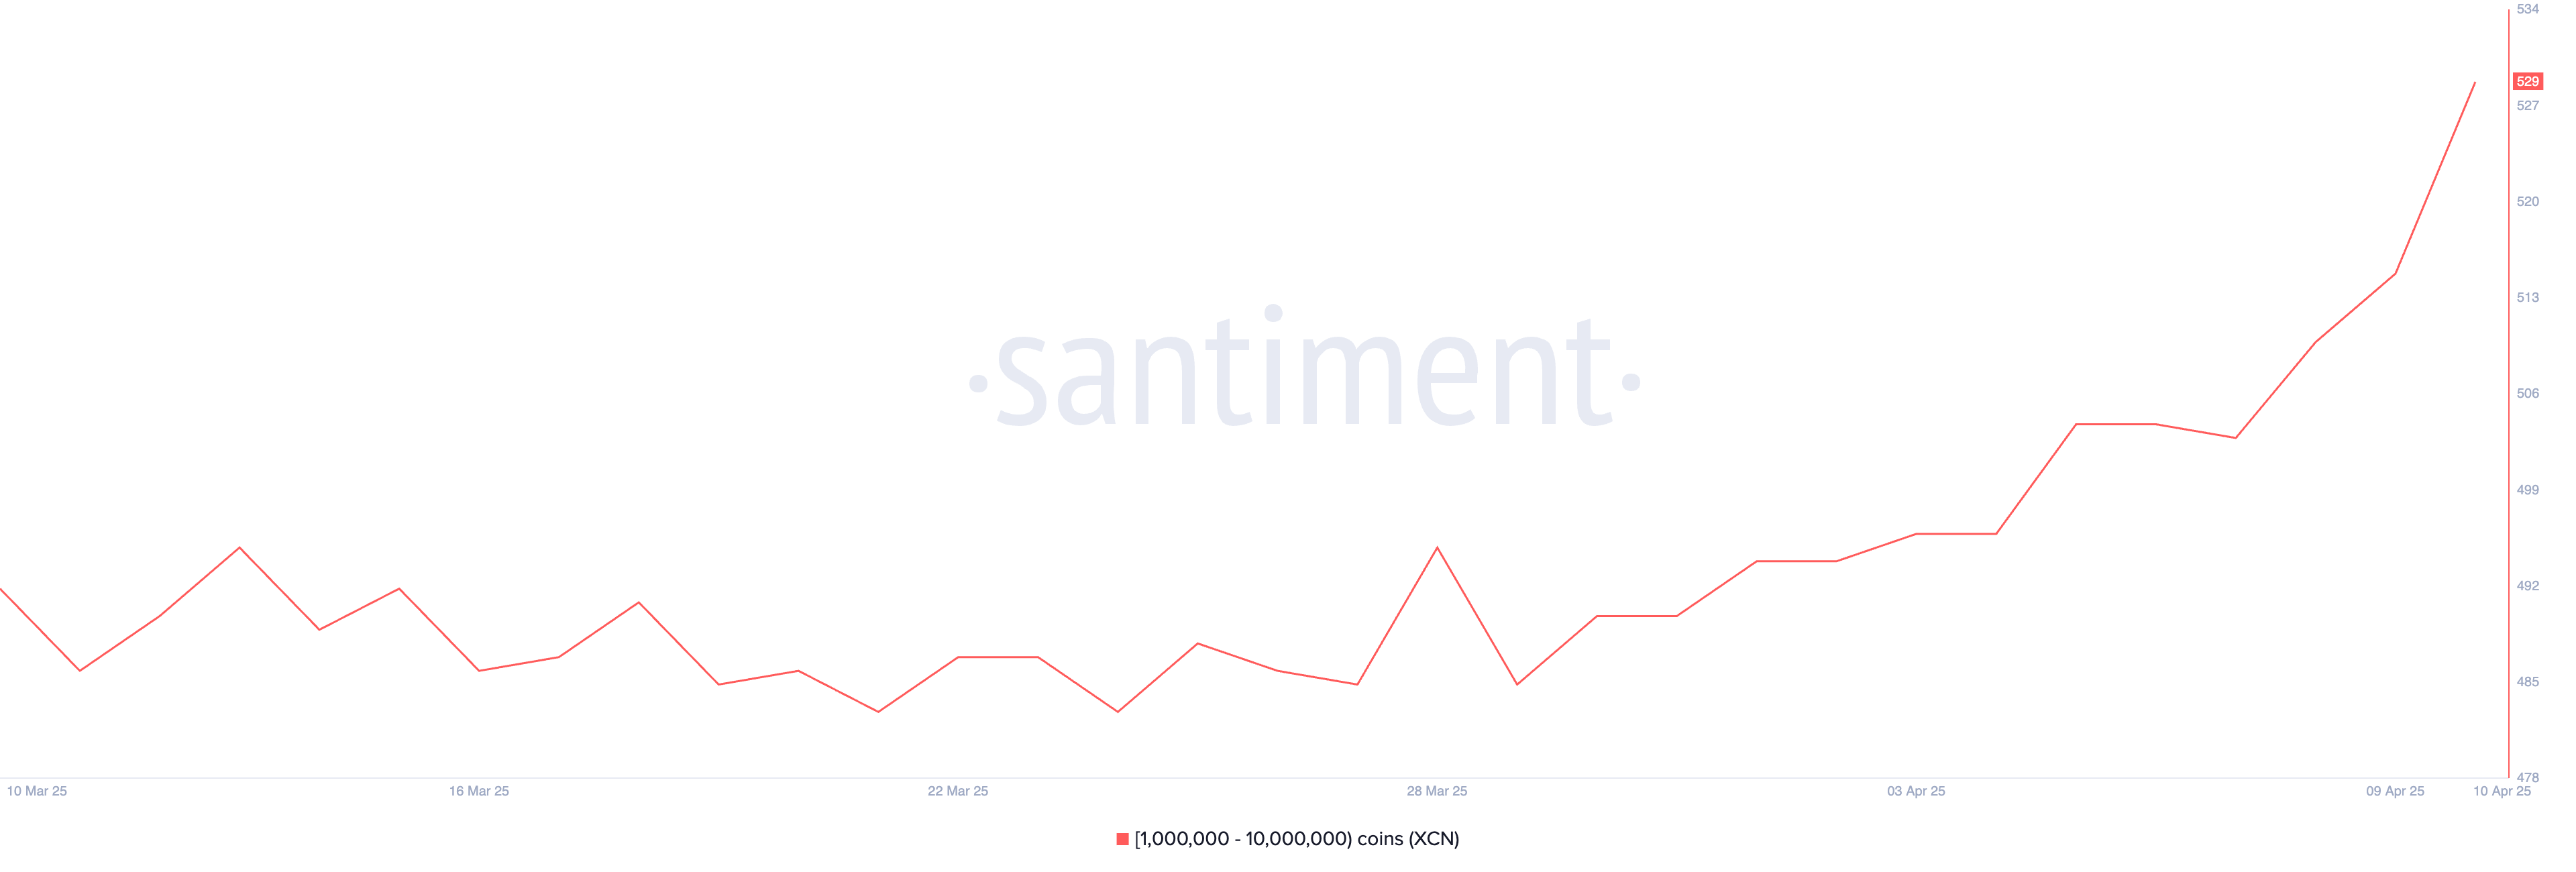
If this strong bullish momentum continues, XCN could rally toward resistance levels at $0.026, $0.033, and even $0.040. However, given the rapid price increase in a short timeframe, a correction may follow.
In that case, XCN could retest support at $0.020, with potential downside extending to $0.014 if selling pressure accelerates.
Disclaimer
In line with the Trust Project guidelines, this price analysis article is for informational purposes only and should not be considered financial or investment advice. BeInCrypto is committed to accurate, unbiased reporting, but market conditions are subject to change without notice. Always conduct your own research and consult with a professional before making any financial decisions. Please note that our Terms and Conditions, Privacy Policy, and Disclaimers have been updated.
Will the SEC Approve Ethereum ETF Staking?
US SEC and Binance Agree To Pause Legal Proceedings for 60 More Days

Binance and the SEC File for Pause in Lawsuit

Crypto Whales Are Buying These Altcoins Post Tariffs Pause

XRP Price Flashes Symmetrical Triangle From 2017, A Repeat Could Send It as Flying To $30

Analyst Reveals XRP Price Can Hit $45 If It Follows This 2017 Pattern

2.52 Million Altcoins Are Ruining Crypto’s Future

Animoca Brands Valuation Tanks 75% In Two Years, Here’s Why

Crypto exchange BingX hacked for $43 million

Are The Big Players Losing Interest?

Hong Kong’s Securities Association Tips Authorities On Crypto Self-Regulation

Coinbase cbBTC Set to go Live on Solana
2.52 Million Altcoins Are Ruining Crypto’s Future
Animoca Brands Valuation Tanks 75% In Two Years, Here’s Why
Crypto exchange BingX hacked for $43 million
Are The Big Players Losing Interest?
Hong Kong’s Securities Association Tips Authorities On Crypto Self-Regulation
Coinbase cbBTC Set to go Live on Solana
-
 Altcoin21 hours ago
XRP Price Risks 40% Drop to $1.20 If It Doesn’t Regain This Level
-

 Market20 hours ago
President Trump Signs First-Ever Crypto Bill into Law
-

 Market19 hours ago
XRP Price Ready to Run? Bulls Eyes Fresh Gains Amid Bullish Setup
-

 Market21 hours ago
Ethereum Price Cools Off—Can Bulls Stay in Control or Is Momentum Fading?
-
 Altcoin19 hours ago
BNB Chain Completes Lorentz Testnet Hardforks; Here’s The Timeline For Mainnet
-

 Market14 hours ago
HBAR Buyers Fuel Surge with Golden Cross, Suggesting Upside
-
 Bitcoin18 hours ago
Over $2.5 Billion in Bitcoin and Ethereum Options Expire Today
-

 Market13 hours ago
China Raises Tariffs on US to 125%, Crypto Markets Steady