
Market
Are Investors Losing Interest in Ethereum Spot ETFs?

Ethereum (ETH) spot exchange-traded funds (ETFs) became tradeable on July 23. However, despite initial enthusiasm, these investment funds have struggled to maintain investor interest.
In recent weeks, ETH ETFs have faced substantial net outflows, with only one week of inflows recorded since their launch.
Ethereum ETFs Record Steady Outflows
According to data from SosoValue, ETH spot ETFs recorded a net outflow of $341.35 million in their first week of trading, marking the largest outflow to date. The second week saw a reduced outflow of $169.35 million, indicating that while investor interest continued to decline, the pace of withdrawals slowed slightly.
Within the two weeks, the total net assets plummeted from $9.24 billion to $8.33 billion. This decline was due to funds withdrawal from these ETFs as ETH value plugged. Between July 23 and August 8, the price of the leading altcoin dropped by 7%.
Although ETH’s value declined further in the third week, the ETFs recorded their first and only inflows, totaling $104.76 million. Interestingly, despite this positive inflow, the total net assets in these funds dropped by another 13%.
By the end of that week, the combined net value of all assets held by US Ethereum spot ETFs stood at $7.28 billion. This remains the only week of net inflows these funds have seen since their launch.
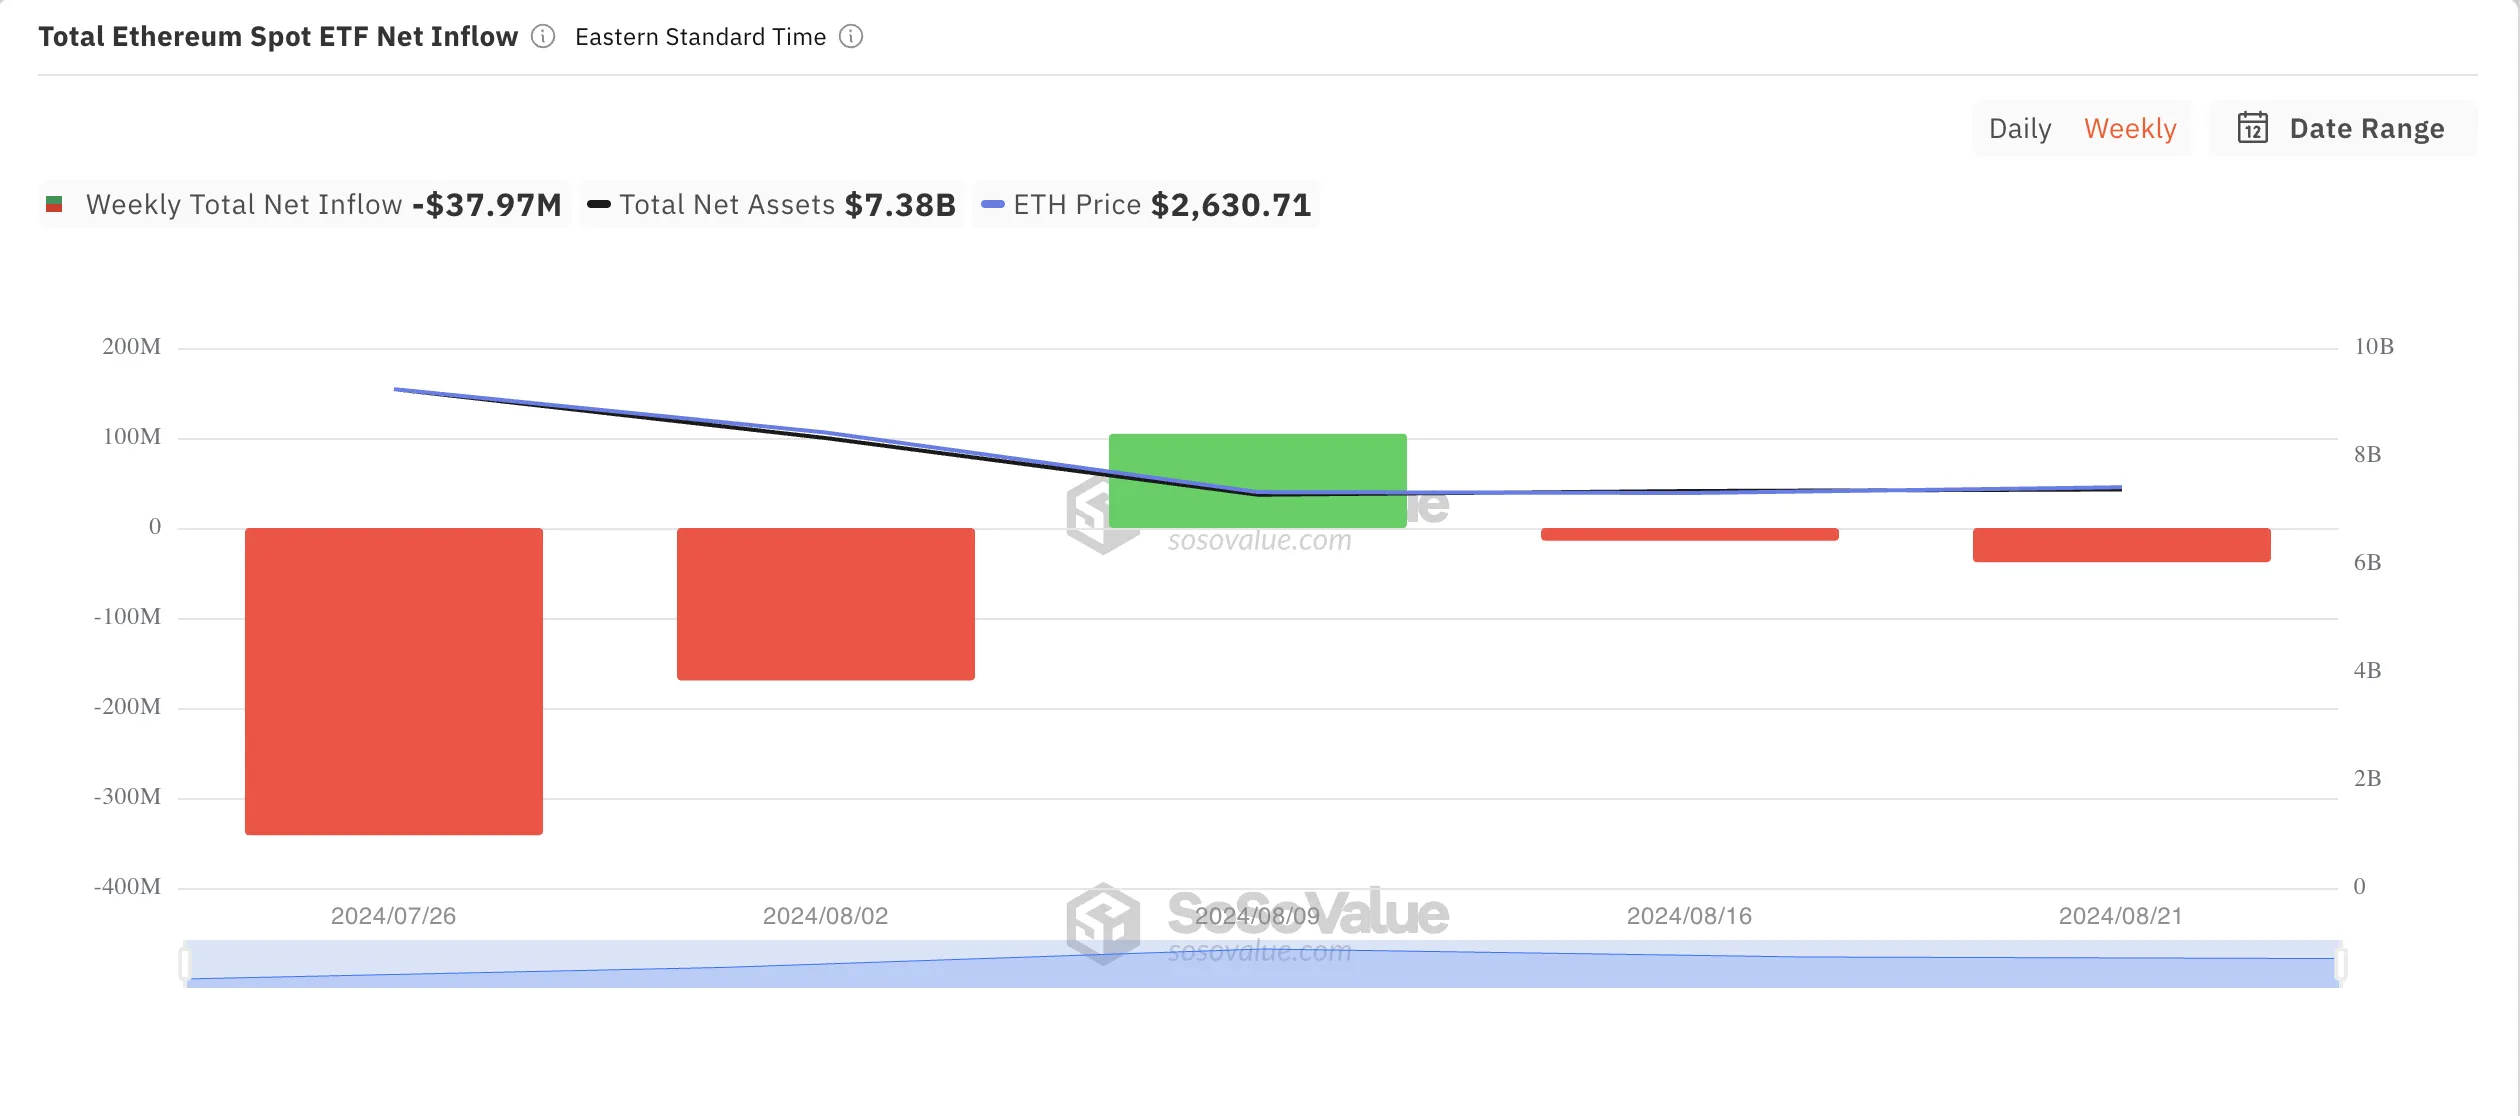
Outflows have amounted to $38 million so far this week, with total net assets at $7.38 billion. This represents 2.3% of ETH’s market capitalization.
On Wednesday, BlackRock’s iShares Ethereum Trust (ETHA) surpassed $1 billion in cumulative net inflows, making it the only fund to reach that milestone. According to SoSoValue data, this surpasses the combined inflows of the next three highest ETFs.
Read more: How to Invest in Ethereum ETFs?
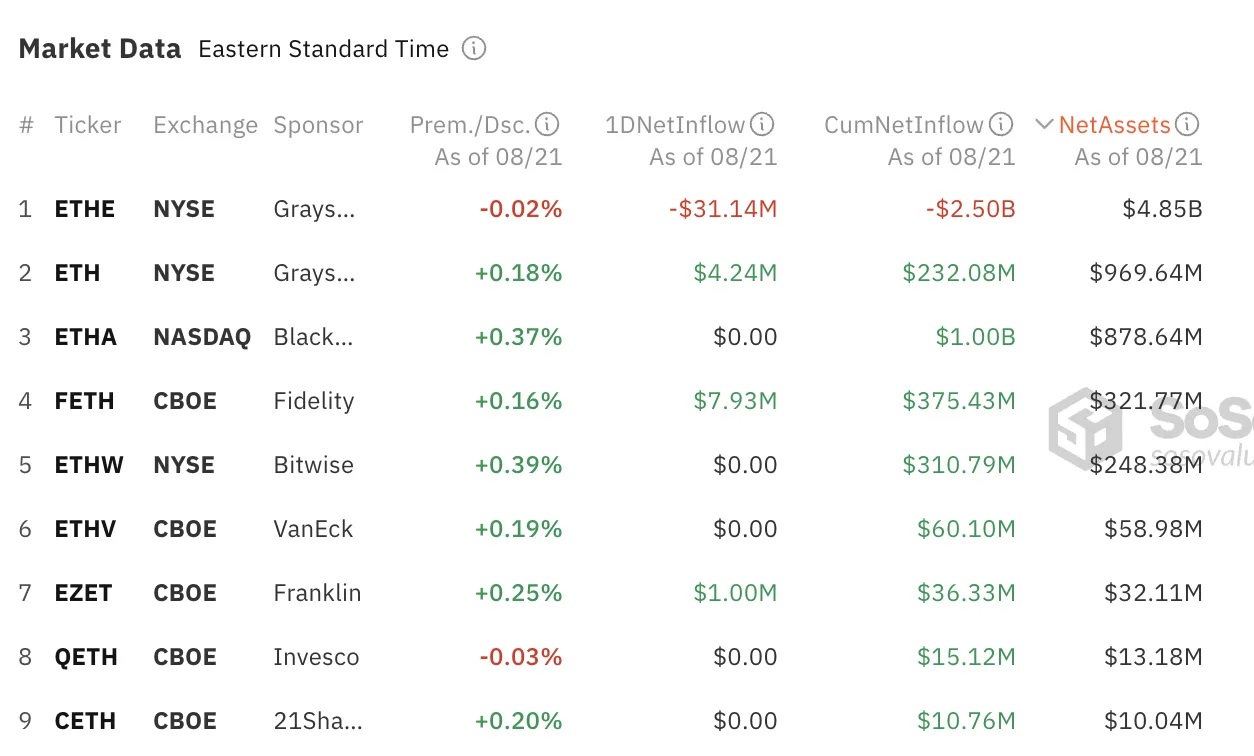
However, ETHA’s net assets rank third, behind Grayscale’s mini Ether trust (ETH) and Ethereum trust (ETHE), which have total assets of $4.85 billion and $969.64 million, respectively. ETHA holds total assets of $878.64 million.
ETH Price Prediction: Coin Flashes Buy Signal
At press time, ETH is trading at $2,627, reflecting a 1% price increase over the past 24 hours, while its trading volume has surged by 9%.
ETH’s struggle to stabilize above the $3,000 mark presents a potential buying opportunity, indicated by its negative market value to realized value (MVRV) ratio. According to Santiment, the token’s 30-day and 90-day MVRV ratios stand at -5.71% and -17.34%, respectively, suggesting the asset may be undervalued.
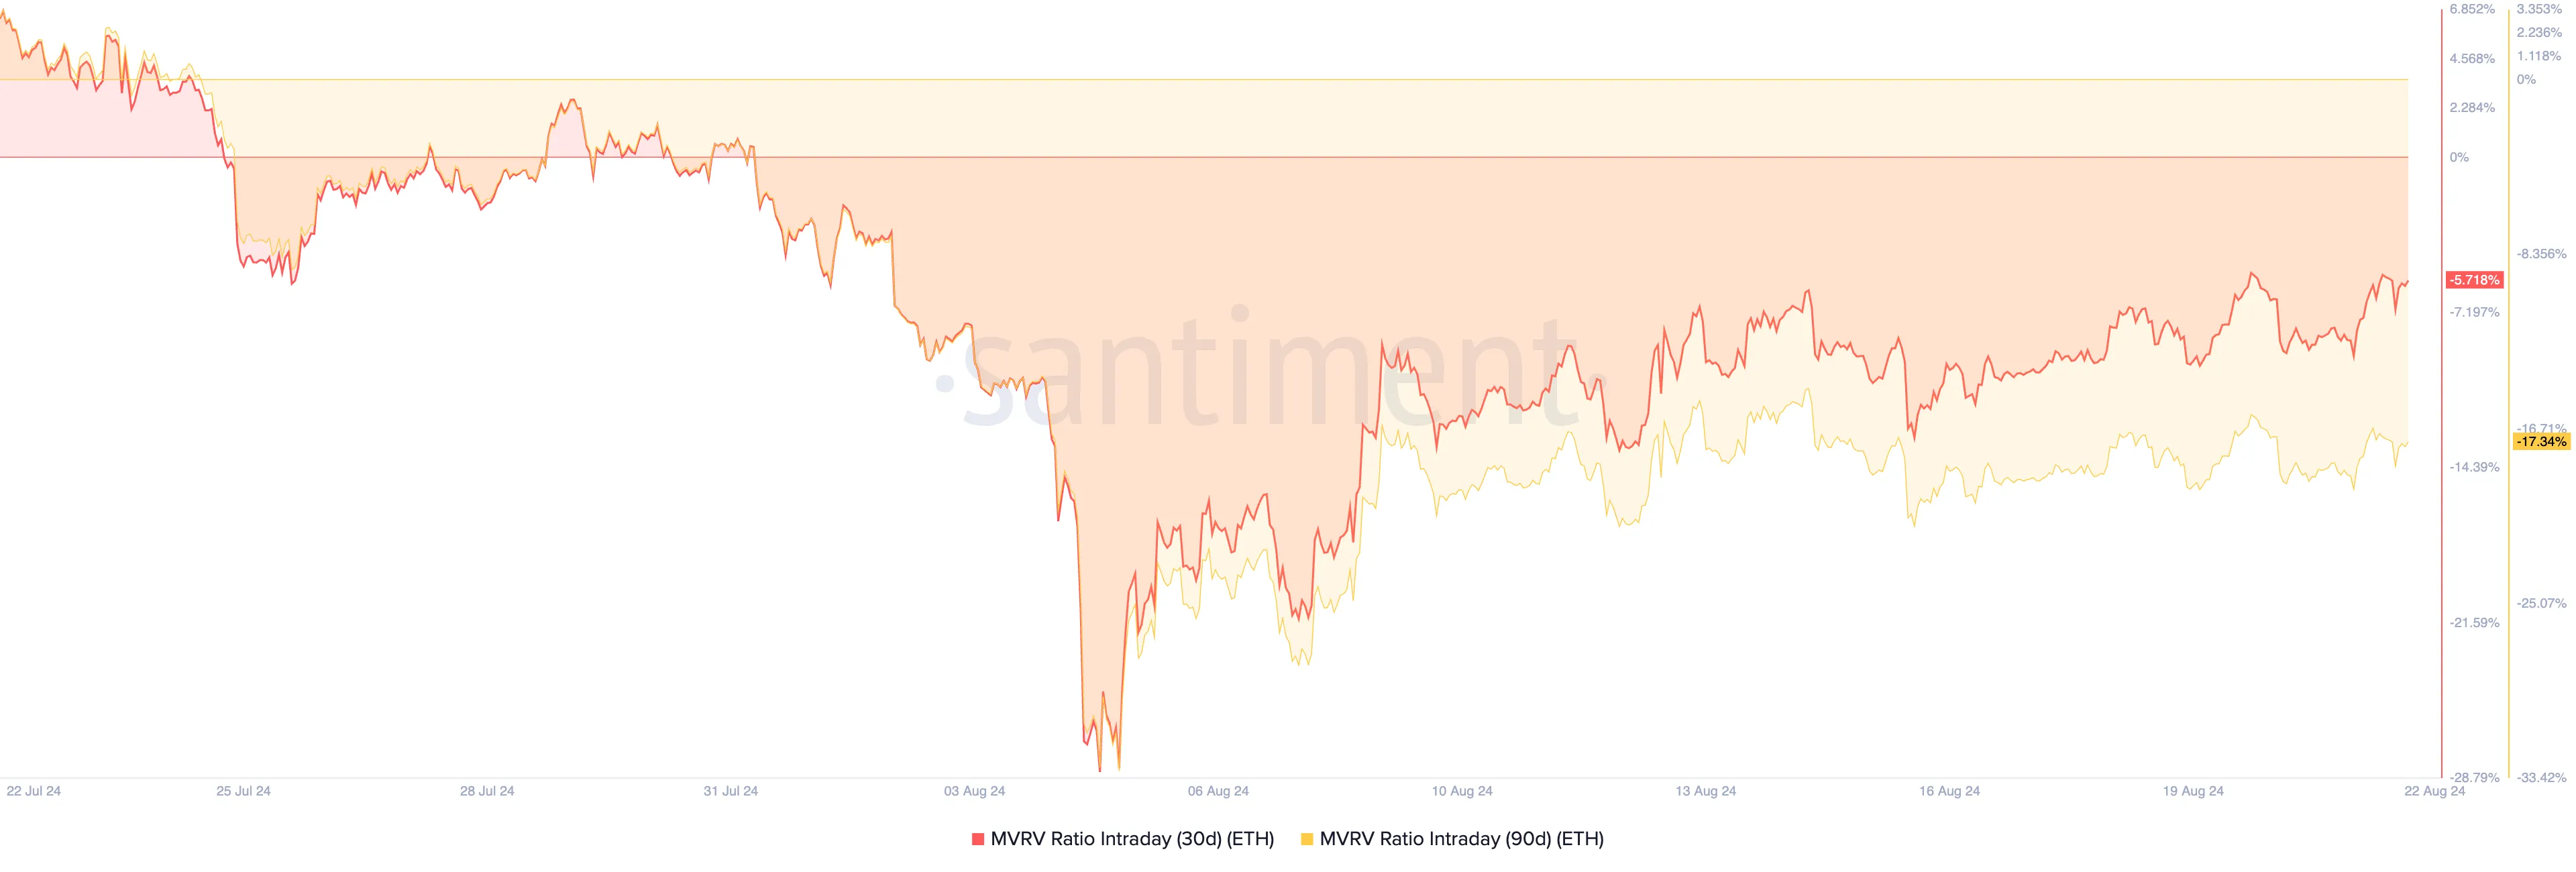
The MVRV ratio measures whether an asset is overvalued, undervalued, or fairly valued. When the ratio is below one, it indicates the asset’s market value is less than its realized value, suggesting it may be undervalued. This creates a buying opportunity for traders looking to capitalize on the “dip.”
If ETH begins an uptrend, buyers who enter at the current market value could realize gains as the price climbs toward $2,868.
Read more: Ethereum (ETH) Price Prediction 2024/2025/2030
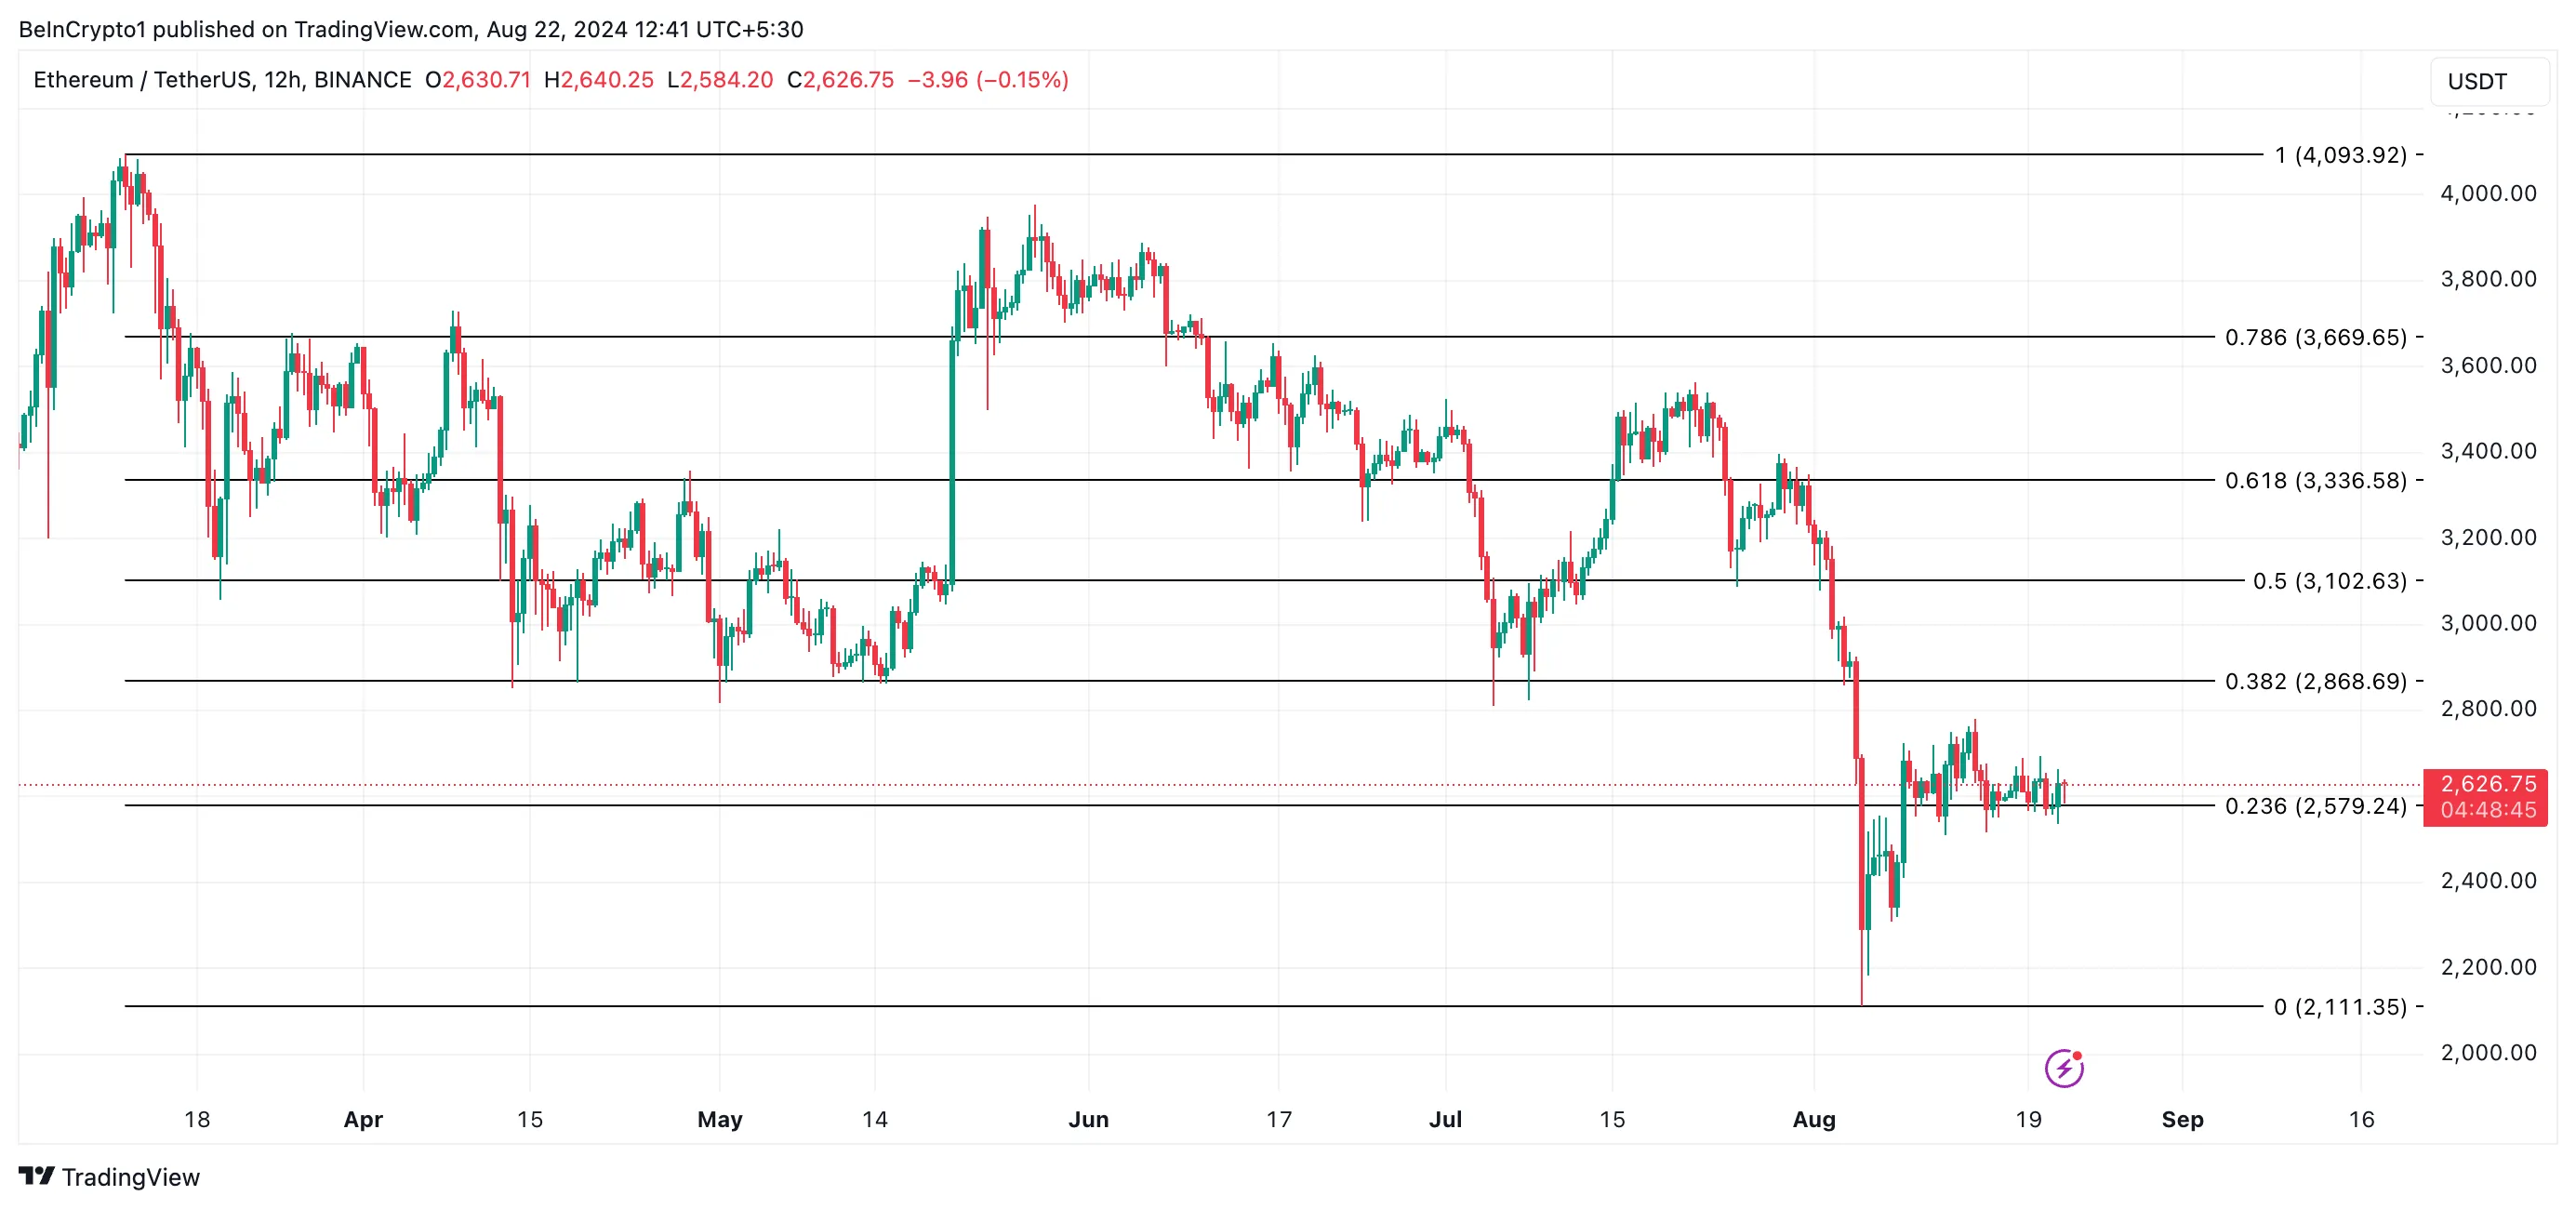
However, they risk being put “under the money” if a downtrend occurs and the price drops to $2,579. An investor is “under the money” when the asset’s market value falls below the acquisition price, leading to potential losses.
Disclaimer
In line with the Trust Project guidelines, this price analysis article is for informational purposes only and should not be considered financial or investment advice. BeInCrypto is committed to accurate, unbiased reporting, but market conditions are subject to change without notice. Always conduct your own research and consult with a professional before making any financial decisions. Please note that our Terms and Conditions, Privacy Policy, and Disclaimers have been updated.


Larry Fink, CEO of BlackRock, claimed in a recent letter that Bitcoin and crypto could damage the dollar’s international standing. If investors treat Bitcoin as an inflation hedge to the dollar, it could precipitate serious trouble.
However, he was also adamant that the industry offers a lot of advantages, particularly through tokenization.
Larry Fink Sees Opportunity in Crypto
BlackRock is the leading Bitcoin ETF issuer in the US, and its CEO Larry Fink has long been bullish on Bitcoin. However, as Fink described in his most recent Annual Chairman’s Letter to investors, crypto’s best interest doesn’t always align with TradFi or the dollar.
“The US has benefited from the dollar serving as the world’s reserve currency for decades. But that’s not guaranteed to last forever. By 2030, mandatory government spending and debt service will consume all federal revenue, creating a permanent deficit. If the US doesn’t get its debt under control… America risks losing that position to digital assets like Bitcoin,” he said.
To be clear, Fink insisted that he supports crypto and listed some practical problems that he believes it can solve. He expressed a particular interest in asset tokenization, claiming that a digital-native infrastructure would improve and democratize the TradFi ecosystem.
Despite these advantages, Fink recognizes the danger that crypto can present to the US economy if not properly managed. He addressed the longstanding practice of using crypto to hedge against inflation, a wise practice for many assets.
However, if a wide swath of investors think Bitcoin is more stable than the dollar, it would threaten USD’s status as the world reserve currency. A scenario like that would be very dangerous to all of TradFi, and Fink has a particular interest in protecting BlackRock. Such an event would doubtlessly impact crypto as well.
“Decentralized finance is an extraordinary innovation. It makes markets faster, cheaper, and more transparent. Yet that same innovation could undermine America’s economic advantage if investors begin seeing Bitcoin as a safer bet than the dollar,” Fink added.
He didn’t offer too many specific solutions to this growing problem, but Fink isn’t the only person concerned with the issue. President Trump recently suggested that stablecoins could promote dollar dominance worldwide. Even if the dollar is seen as unstable, its adoption within a rapidly growing global industry like stablecoins could help reinforce its strength and relevance.
Of course, there are also drawbacks to Trump’s plan. Larry Fink acknowledged a possible threat from crypto, but continues to espouse its utility. Its benefits are too good to ignore.
Disclaimer
In adherence to the Trust Project guidelines, BeInCrypto is committed to unbiased, transparent reporting. This news article aims to provide accurate, timely information. However, readers are advised to verify facts independently and consult with a professional before making any decisions based on this content. Please note that our Terms and Conditions, Privacy Policy, and Disclaimers have been updated.
XRP has experienced a significant downturn in recent price action, with its value dropping nearly 15% over the past seven days as bears maintain control of the market. The coin’s technical indicators are showing mixed signals, with the RSI rebounding from oversold territory while Ichimoku Cloud patterns continue to paint a predominantly bearish picture.
Despite yesterday’s test of the critical $2.06 support level resulting in a temporary bounce, the momentum remains negative, with short-term EMAs positioned below long-term averages. The move from extreme oversold conditions suggests XRP might be entering a consolidation phase before its next significant price movement.
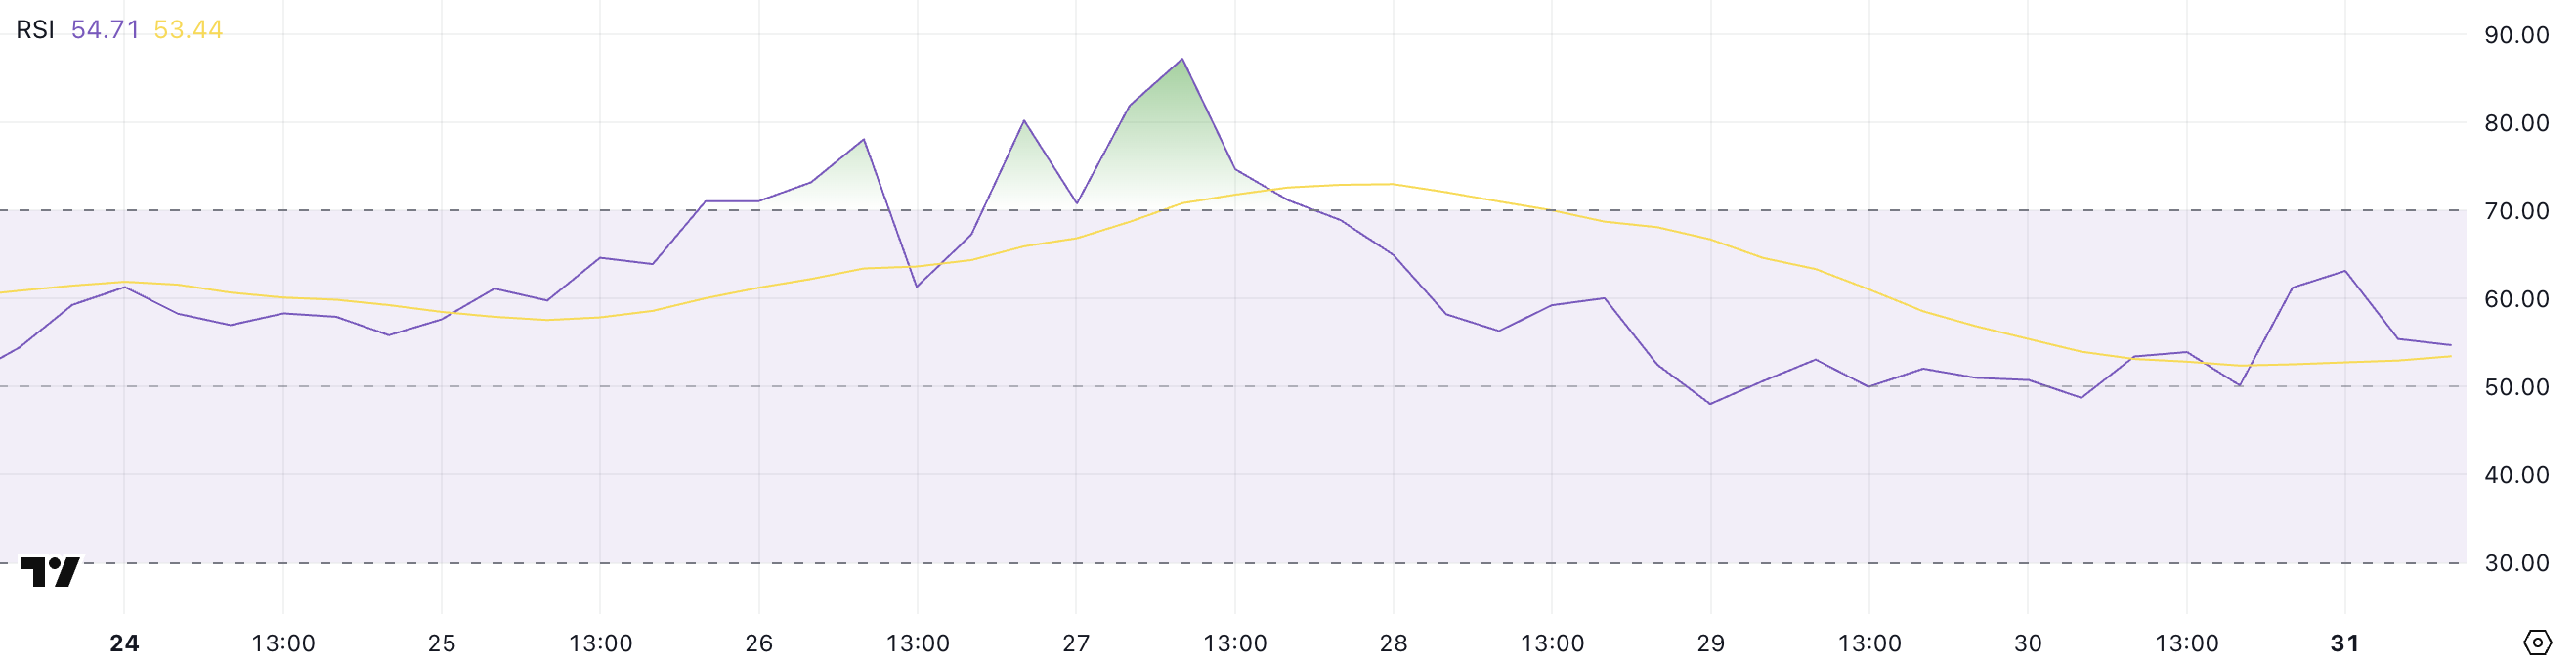
XRP RSI Is Up From Oversold Levels
XRP’s Relative Strength Index (RSI) is currently at 36.37, showing a notable rebound from a low of 27.49 just a few hours ago. This upward shift indicates a shift in momentum, as buying interest has started to pick up after a period of heavy selling pressure.
Although still in the lower range, this recovery suggests that traders may be stepping back in. That could mean they are potentially viewing the recent dip as an opportunity.
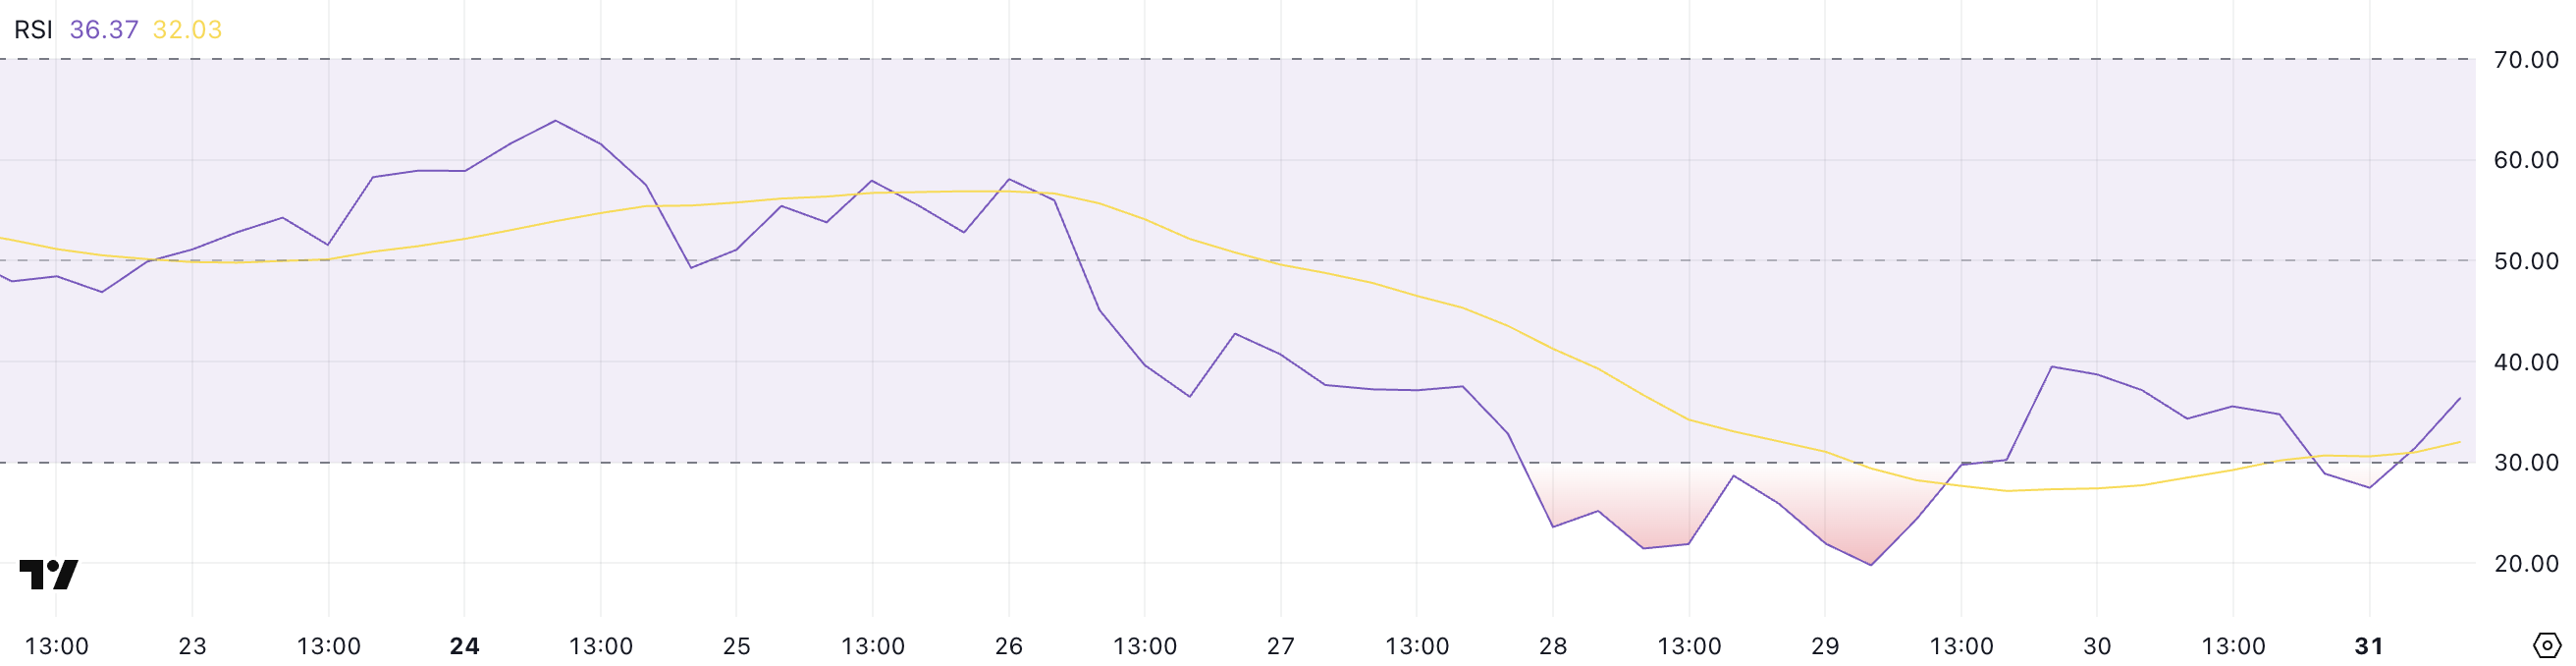
RSI is a widely used momentum indicator that measures the speed and change of price movements on a scale from 0 to 100. Readings below 30 typically indicate that an asset is oversold and may be undervalued, while readings above 70 suggest it is overbought and could be due for a correction.
XRP’s bounce from 27.49 to 36.37 signals that it may have just exited oversold conditions. This could mean that the recent selling phase is easing. If the buying momentum continues to build, XRP might be entering the early stages of a potential recovery.
XRP Ichimoku Cloud Shows A Bearish Scenario
XRP’s Ichimoku Cloud chart shows that the price action remains below both the red baseline (Kijun-sen) and the blue conversion line (Tenkan-sen). That indicates the prevailing momentum is still bearish.
The candles are also forming well beneath the cloud, which reflects a broader downtrend.
When the price is under all major Ichimoku components like this, it typically signals continued downward pressure unless a strong reversal breaks those resistance levels.
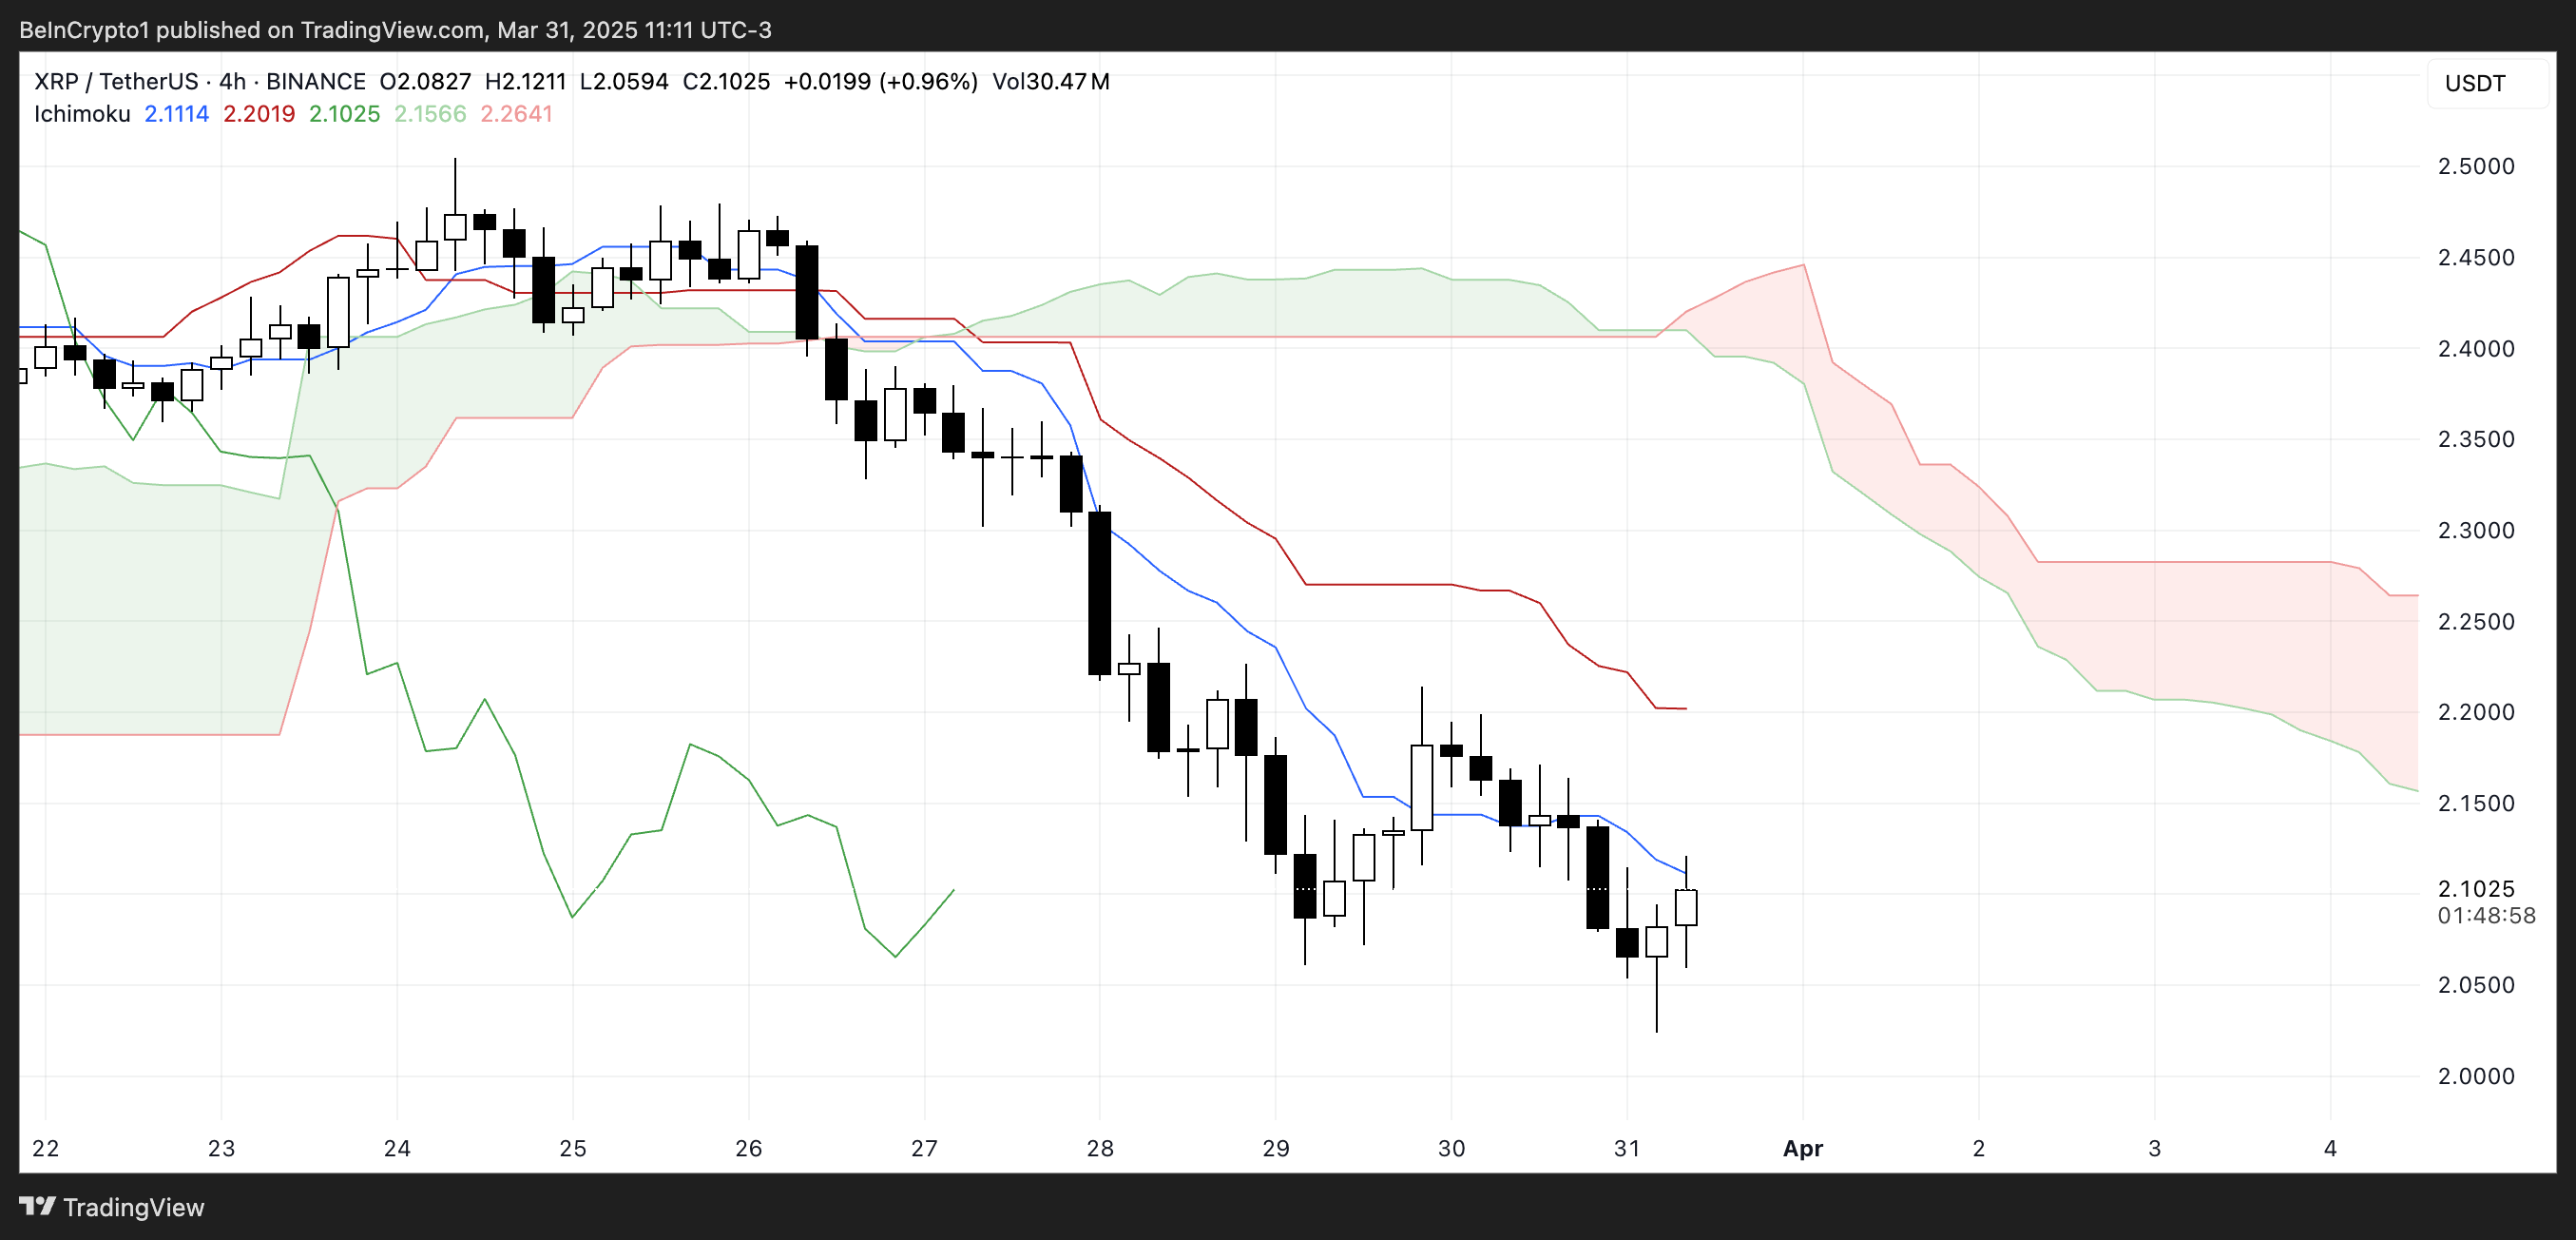
Additionally, the cloud ahead is red and spans horizontally with a downward slope, reinforcing the bearish outlook in the near term. The thickness of the cloud suggests moderate resistance if the price attempts to move upward.
However, some consolidation is evident in the recent candles, showing that sellers may be losing some control.
For any potential trend reversal, XRP would need to break above the Tenkan-sen and Kijun-sen, and eventually challenge the cloud itself — a move that would require a clear uptick in momentum.
XRP Could Rise After Testing An Important Support Yesterday
XRP’s EMA lines are clearly aligned in a bearish formation, with the short-term averages sitting well below the long-term ones and a noticeable gap between them—highlighting strong downward momentum.
Yesterday, XRP price tested the support level at $2.06 and rebounded, showing that buyers are still active at that zone. However, this support remains critical. If it is tested again and fails to hold, XRP could fall further. Its next major support sitting around $1.90.
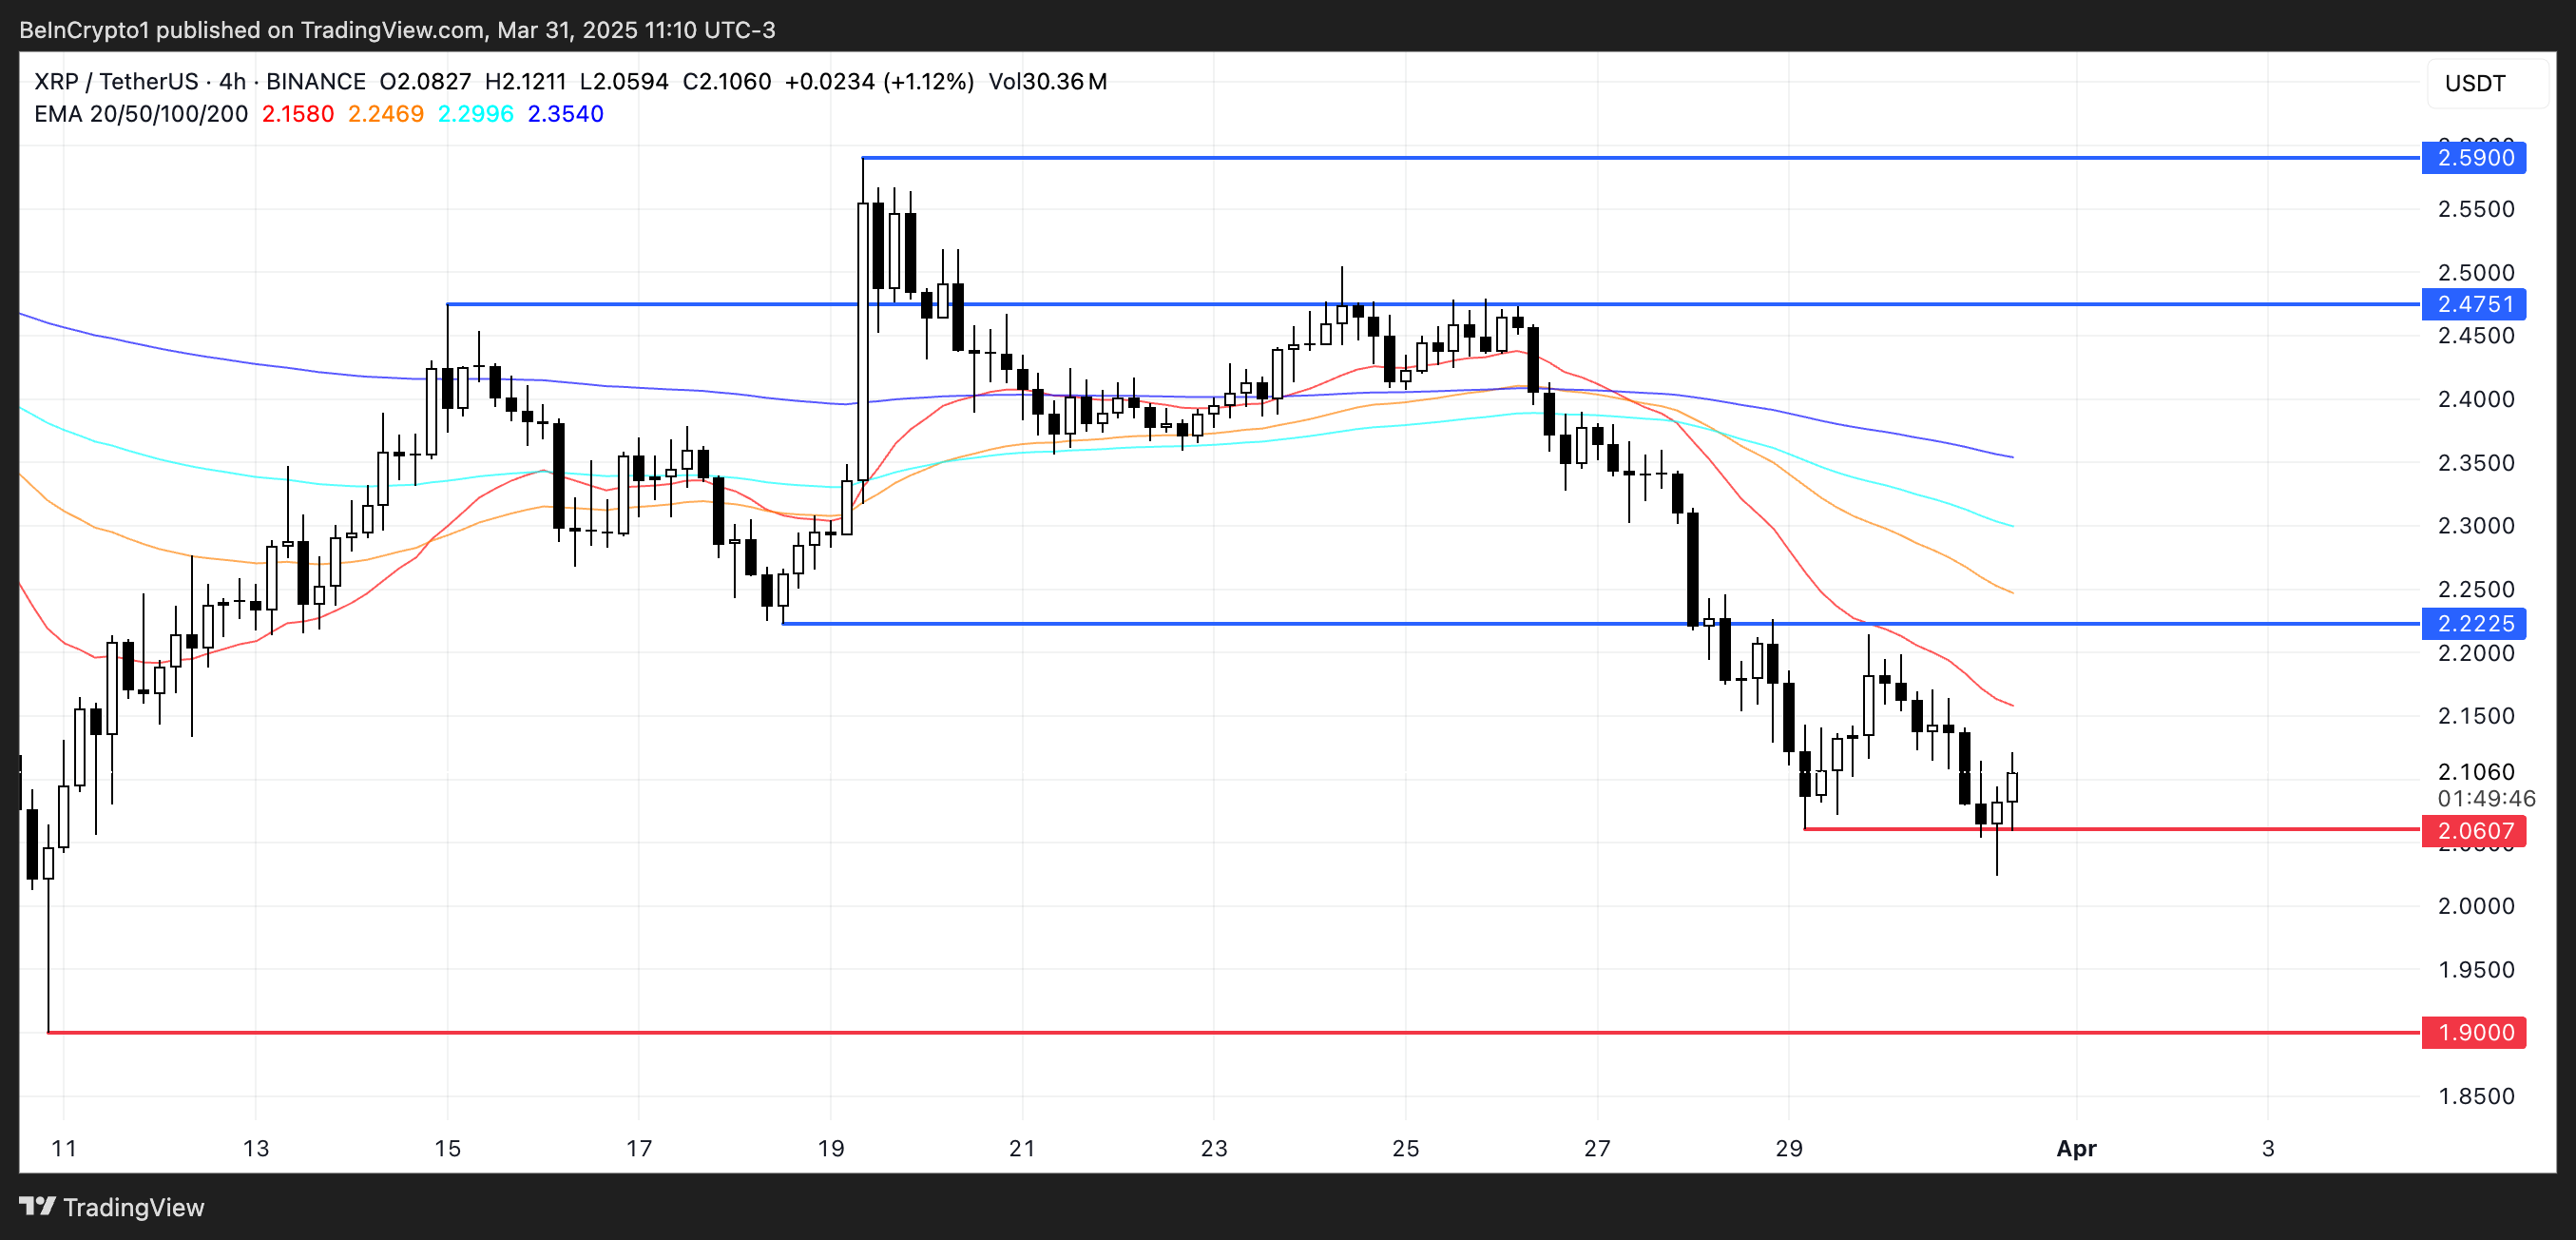
If the trend begins to shift and XRP breaks above the short-term EMAs, the first key resistance to watch is at $2.22. A successful move above this level could trigger a stronger recovery, potentially pushing the price toward $2.47.
If bullish momentum continues, the next upside target would be $2.59. For now, though, the EMA structure still leans bearish. XRP would need sustained buying pressure to flip the trend and aim for those higher resistance levels.
Disclaimer
In line with the Trust Project guidelines, this price analysis article is for informational purposes only and should not be considered financial or investment advice. BeInCrypto is committed to accurate, unbiased reporting, but market conditions are subject to change without notice. Always conduct your own research and consult with a professional before making any financial decisions. Please note that our Terms and Conditions, Privacy Policy, and Disclaimers have been updated.

SAFE has emerged as the best-performing altcoin of the day, with its price surging 5% in the last 24 hours and its market capitalization now close to $300 million. The coin is showing strong technical indicators despite some mixed signals from momentum oscillators that suggest consolidation may be on the horizon.
Technical analysis of the EMA lines remains bullish, with short-term averages positioned favorably above long-term ones, pointing to continued strength in the immediate term. However, recent RSI and BBTrend readings indicate a potential cooling-off period could be approaching as the asset digests its recent gains.
SAFE RSI Is Back To Neutral Levels After Reaching Overbought Levels
The SAFE RSI is currently at 54.71, maintaining a neutral position for the past three days after experiencing significant momentum earlier in the week.
This moderation in the indicator suggests that the previous buying pressure has subsided somewhat, allowing the asset to consolidate following recent price movements.
The current neutral reading indicates a balanced market where neither buyers nor sellers have a decisive advantage.
The Relative Strength Index (RSI) is a momentum oscillator that measures the speed and change of price movements on a scale from 0 to 100. Generally, an RSI reading above 70 is considered overbought, suggesting a potential reversal or pullback, while readings below 30 indicate oversold conditions that might precede a bounce.
With SAFE’s RSI recently peaking at 87 just four days ago, the asset was in strongly overbought territory, signaling excessive buying enthusiasm. The current value of 54.71 represents a significant cooling off from those extreme levels, suggesting that SAFE’s price could be entering a period of stabilization.
This moderation may provide a healthier foundation for sustainable price action moving forward, as the previous overbought conditions have been worked through without dropping into oversold territory. This potentially indicates underlying strength in the asset despite the retreat from recent highs.
SAFE BBTrend Is Still High, But Down From Yesterday
The SAFE BBTrend is currently at 13.6, maintaining a positive position for the last two days after reaching a peak of 19.39 yesterday.
This recent positive trend suggests that the price movement has been gaining momentum, though there appears to be some moderation from yesterday’s higher reading.
The continued positive BBTrend indicates that the asset is still showing strength, despite the slight pullback from yesterday’s peak value.
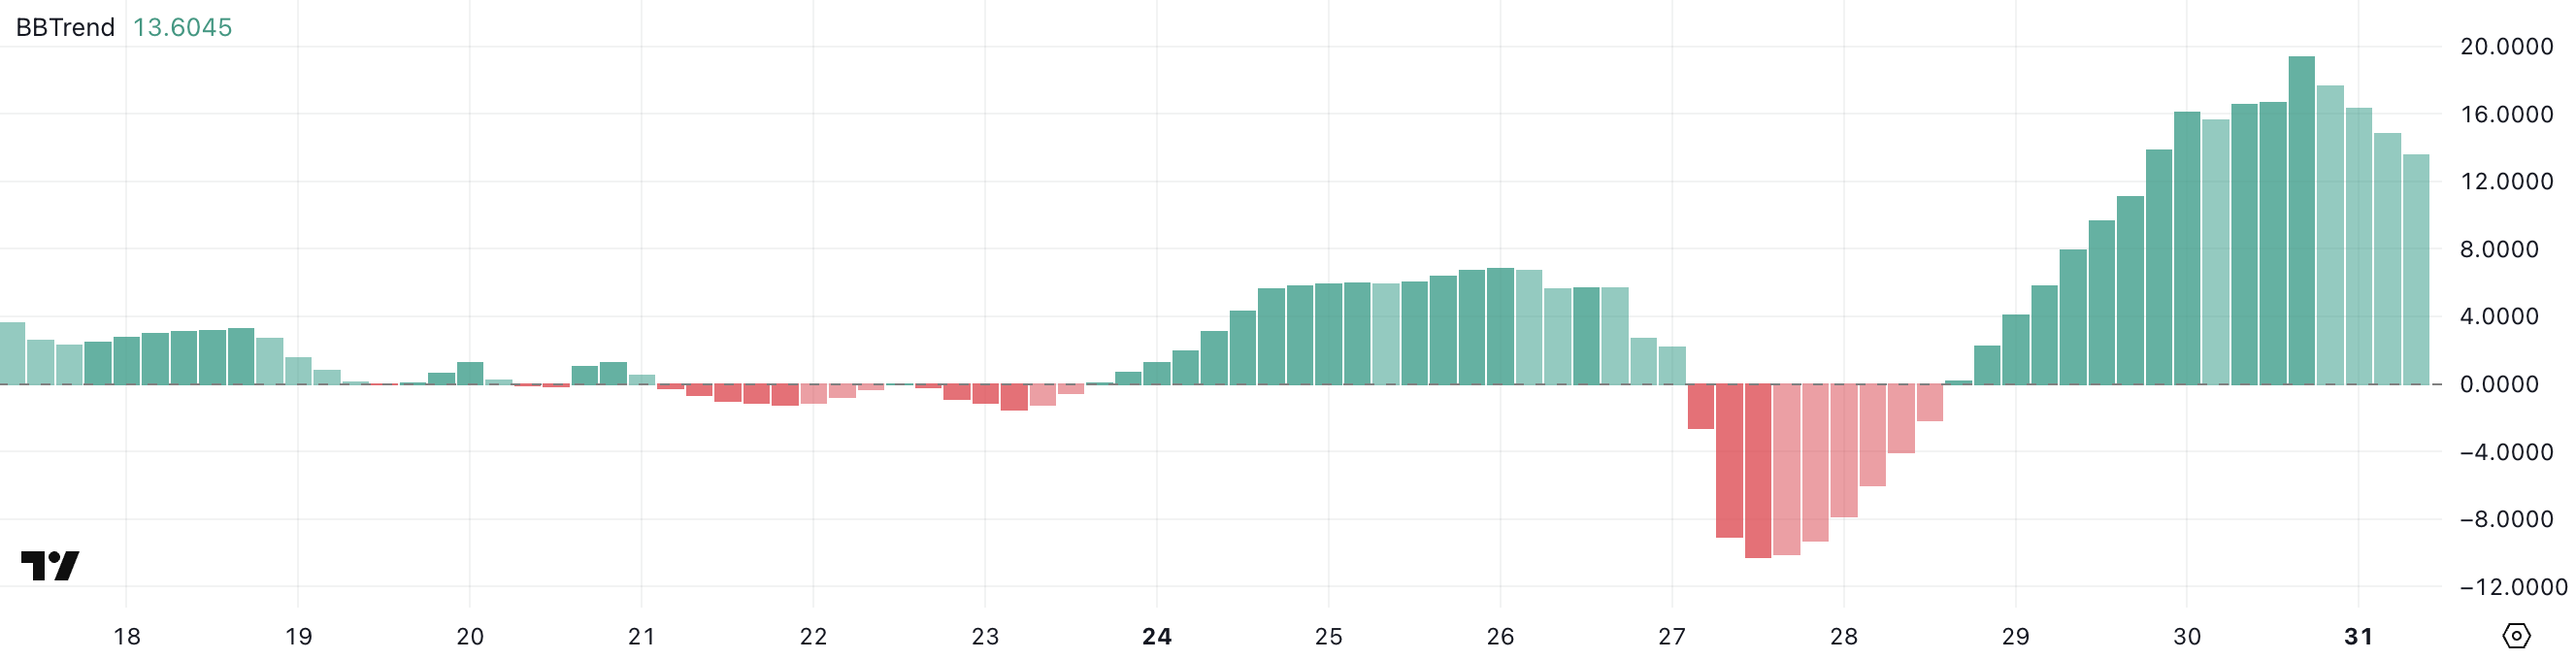
BBTrend (Bollinger Bands Trend) is a technical indicator that measures the strength and direction of a trend by analyzing the relationship between price and Bollinger Bands.
The indicator typically ranges from negative to positive values, with readings above 0 indicating a bullish trend and readings below 0 suggesting a bearish trend. With SAFE’s BBTrend at 13.6, this suggests a moderately strong bullish trend that could indicate potential for continued upward price movement in the near term for the altcoin.
However, the decrease from yesterday’s 19.39 peak might signal some slowing in momentum, potentially leading to consolidation before the next significant move higher.
Will SAFE Uptrend Revert Soon?
SAFE EMA lines are still bullish, with short-term lines positioned above long-term ones. This positive alignment of exponential moving averages indicates continued upward momentum in the price action.
If this uptrend momentum maintains its strength, SAFE could potentially climb to test the resistance level at $0.72.
Should this resistance be successfully broken, the next target would be $0.879. The altcoin could exceed $0.90 for the first time since January 19, sustaining its momentum as one of the most trending altcoins.
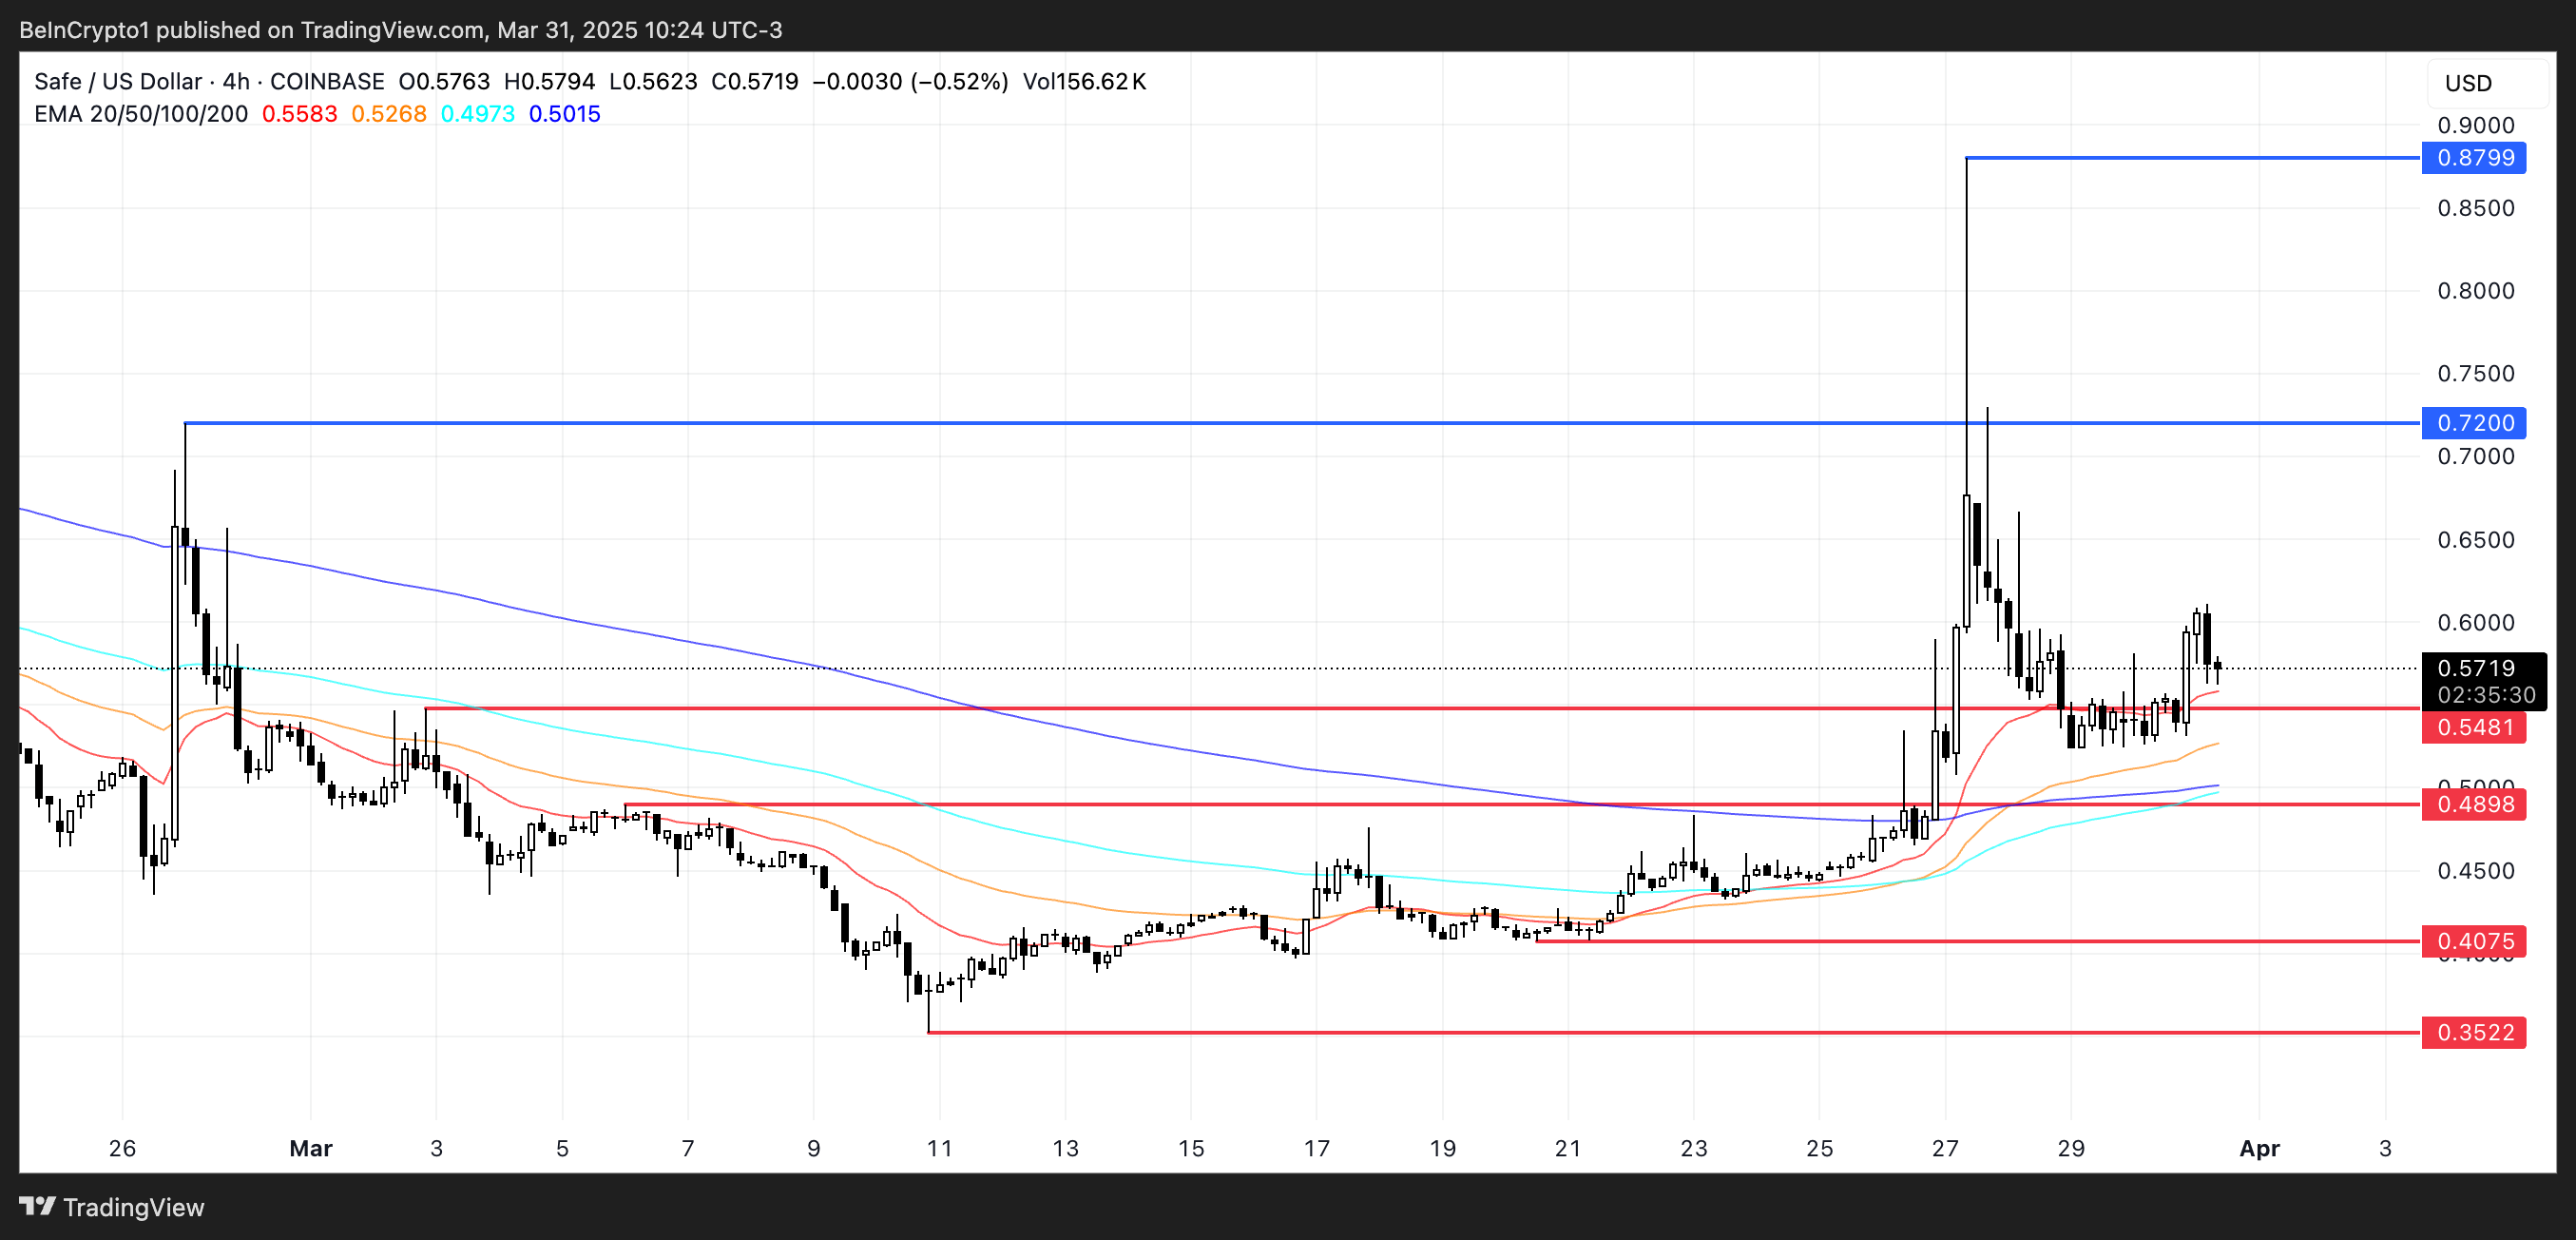
On the other hand, as indicated by the RSI and BBTrend indicators, the uptrend appears to be losing some momentum. This could signal a potential reversal in the near future.
If the trend does reverse, SAFE might test the nearby support level at $0.54, which sits precariously close to the current price.
Should this support level fail to hold, further downside could see SAFE decline to test subsequent support levels at $0.48 and $0.40. In a worst-case scenario, a drop all the way to $0.35 could potentially occur.
Disclaimer
In line with the Trust Project guidelines, this price analysis article is for informational purposes only and should not be considered financial or investment advice. BeInCrypto is committed to accurate, unbiased reporting, but market conditions are subject to change without notice. Always conduct your own research and consult with a professional before making any financial decisions. Please note that our Terms and Conditions, Privacy Policy, and Disclaimers have been updated.

Ethereum Bitcoin Ratio Drops to Record Low, What Next for ETH?

BlackRock’s Larry Fink Thinks Crypto Could Harm The Dollar

Ethereum May Have To Undo This Death Cross For Bull’s Return

XRP Bears Lead, But Bulls Protect Key Price Zone

Elon Musk Rules Out The Use Of Dogecoin By The US Government

Market Cap Now Approaching $300 Million

2.52 Million Altcoins Are Ruining Crypto’s Future

Animoca Brands Valuation Tanks 75% In Two Years, Here’s Why

Crypto exchange BingX hacked for $43 million

Are The Big Players Losing Interest?

Hong Kong’s Securities Association Tips Authorities On Crypto Self-Regulation

Coinbase cbBTC Set to go Live on Solana
2.52 Million Altcoins Are Ruining Crypto’s Future
Animoca Brands Valuation Tanks 75% In Two Years, Here’s Why
Crypto exchange BingX hacked for $43 million
Are The Big Players Losing Interest?
Hong Kong’s Securities Association Tips Authorities On Crypto Self-Regulation
Coinbase cbBTC Set to go Live on Solana
-
 Altcoin22 hours ago
Cardano Price Eyes Massive Pump In May Following Cyclical Patern From 2024
-

 Market18 hours ago
Bitcoin Bears Tighten Grip—Where’s the Next Support?
-

 Market17 hours ago
Ethereum Price Weakens—Can Bulls Prevent a Major Breakdown?
-

 Market13 hours ago
This Is How Dogecoin Price Reacted To Elon Musk’s Comment
-

 Bitcoin12 hours ago
US Macroeconomic Indicators This Week: NFP, JOLTS, & More
-

 Market12 hours ago
Don’t Fall for These Common Crypto Scams
-
 Bitcoin10 hours ago
Marathon Digital to Sell $2 Billion in Stock to Buy Bitcoin
-
 Market10 hours ago
Strategic Move for Trump Family in Crypto